Google Data Studio ETL is the foundation of automated reporting in Looker Studio. If you want Looker Studio dashboards that update automatically, combine multiple data sources, and scale with your business, you need a structured way to extract, transform, and load data.
At Vidi Corp, we have implemented Google Data Studio ETL pipelines for 50+ data sources, including Facebook Ads, Shopify, Google Ads, QuickBooks, ClickUp, and many others. We have delivered these solutions for global brands and agencies such as Google, NP Digital, and TubeScience, helping them automate reporting and centralise data for decision-making.
Looker Studio is a powerful visualisation tool, but it does not clean, restructure, or store complex datasets on its own. Without ETL, teams often rely on manual exports, spreadsheets, and repetitive data preparation. This approach is slow, error-prone, and difficult to scale.
In this guide, we’ll explain what Google Data Studio ETL is, how it works, the best strategies to implement it, and how to choose the right approach for your business.
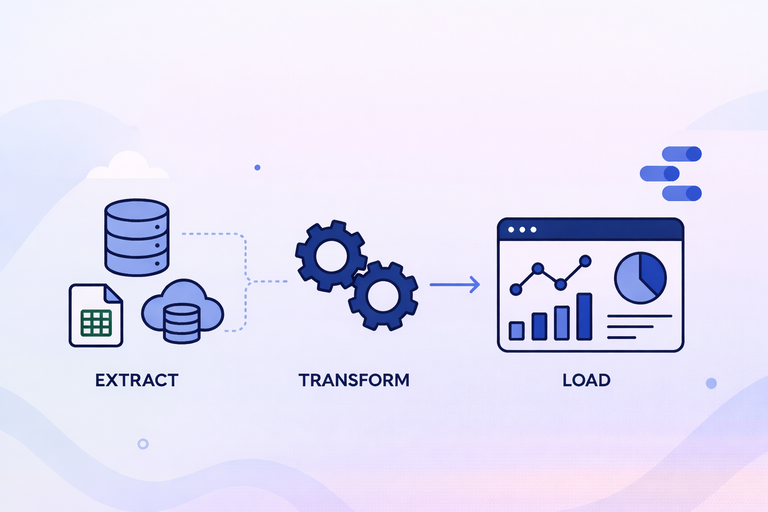
ETL stands for Extract, Transform, Load. It is a structured process used to move data from multiple sources into a single, reliable database where it can be analysed and reported on.
In practical terms, ETL automatically extracts data from systems such as CRMs, ERPs, marketing platforms, or spreadsheets. It then transforms that data by cleaning it, standardising formats, applying business rules, and resolving inconsistencies. Finally, it loads the processed data into a database like BigQuery or PostgreSQL, where it becomes ready for reporting and analytics.
The core goal of ETL is automation and consistency. All three steps run on a schedule or are triggered by an event, such as new data being added. This ensures your reporting is always based on up-to-date, structured, and trustworthy data.
It’s important to clarify that Looker Studio (formerly Google Data Studio) is not an ETL tool. It does not transform or store large volumes of processed data. Instead, it connects to databases and visualises data that has already been prepared.
ETL consists of three core components: Extract, Transform, and Load. Each step plays a specific role in preparing data for analysis and reporting in tools like Looker Studio.
The Extract step focuses on automatically pulling data from different sources. The main objective is to eliminate manual downloads and spreadsheet work.
In most cases, extraction is done through APIs (Application Programming Interfaces). Major marketing and business platforms such as Facebook Ads, Shopify, LinkedIn Ads, and Google Analytics provide open APIs. A script sends structured requests to the API, and the API returns the requested data.
In situations where APIs are not available, data can sometimes be collected through web scraping. In this case, a bot programmatically visits web pages and extracts specific variables. While less stable than APIs, scraping can be a practical alternative when no official integration exists.
The key principle of the Extract phase is automation. Data should flow into your system without human intervention.
Data extracted from APIs or websites is usually not ready for analysis. It often comes in a structured format such as JSON, which contains nested keys and values.
JSON files are not organised as simple rows and columns. Instead, they may include multiple nested objects and arrays. To make the data usable for analytics, it must be transformed into a flat table structure.
This transformation process typically involves:
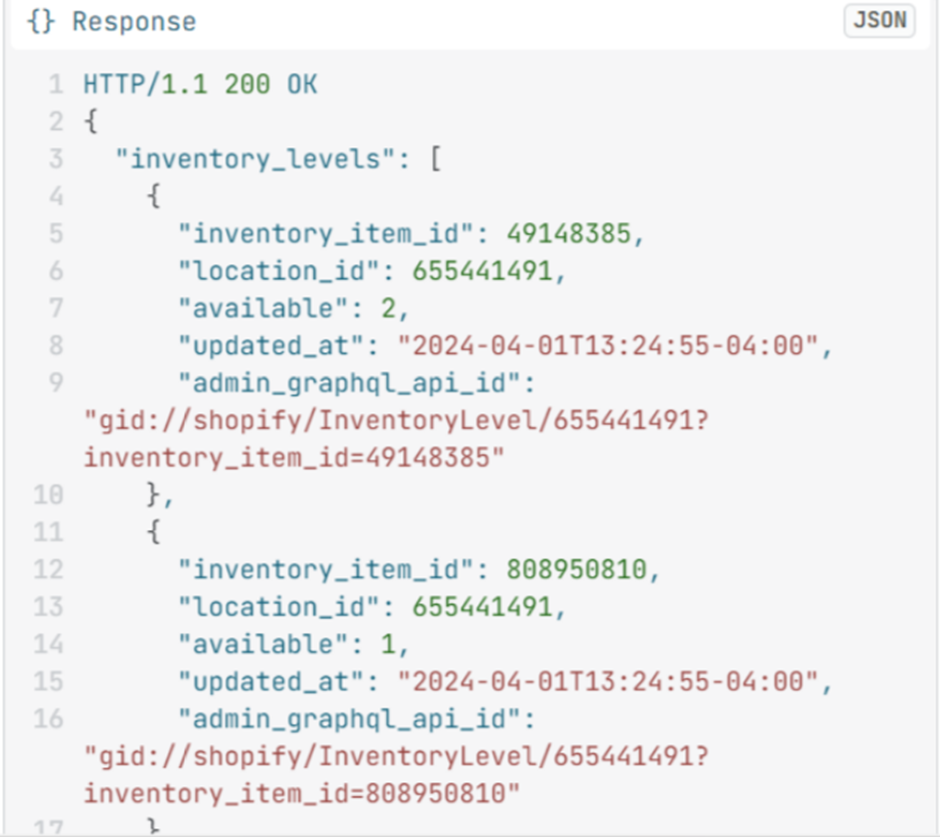
It is common for APIs to return data across multiple JSON files in response to a single request. This is done to avoid errors caused by large data payloads. The ETL process must therefore combine these responses into one consistent dataset.
The goal of the Transform step is to convert raw, technical data into a clean, structured format suitable for reporting and dashboard tools.
Once the data is transformed into structured tables, it is loaded into a database.
This database could be BigQuery, PostgreSQL, MySQL, or another data warehouse. The structured tables stored in the database become the single source of truth for reporting.
From there, analytics tools such as Looker Studio can connect directly to these tables. Because the heavy processing has already been completed during the Transform phase, reporting tools can focus purely on visualisation and analysis.
The Load step ensures that clean, structured, and reliable data is consistently available for decision-making.
Google Data Studio ETL is a critical concept if you want to build fully automated reporting instead of manually updating dashboards.
Looker Studio can visualise data, but it does not clean, restructure, or consolidate large volumes of raw data on its own. If your data lives in multiple platforms such as Facebook Ads, Shopify, LinkedIn Ads, or a CRM, you need a structured way to extract and prepare it before it reaches your dashboards. That structured process is ETL.
Without ETL, reporting usually involves:
This approach does not scale. It is slow, error-prone, and difficult to maintain.
With ETL in place, data is automatically extracted from multiple sources, transformed into a consistent structure, and loaded into a database. Looker Studio then connects directly to that prepared dataset. As new data flows into the system, dashboards refresh automatically.
This matters for three main reasons:
1. Automation
Reports update on a schedule or in near real time. No manual intervention is required.
For example, our Looker Studio consultants built dashboards for a full-service digital marketing agency serving 80+ clients. The dashboards automatically pulled data from Facebook Ads, Google Ads, SEMRush, GA4, Google Search Console and eliminated manual reporting work.
As a result, the agency saved 50 hours per week in reporting time, and reporting accuracy based on GA4 data increased by 40%.
2. Accuracy
Standardised transformation rules reduce inconsistencies and manual errors.
For example, we worked with The Wanamaker Project, a digital marketing agency. We implemented automated Looker Studio reporting for every client they serve. The dashboards are used to report on SEO, PPC, and other marketing efforts across channels.
As a result, they automated marketing reporting for 7 clients, saving 10 working hours per month, while ensuring clients received consistent and reliable performance updates.
3. Scalability
As you add new channels or increase data volume, the reporting structure remains stable.
For example, we implemented a BI data warehouse for a retail company with transactions, customers, products, and lab data. New transactions are added every five minutes, and lab data refreshes incrementally on the same schedule.
The Looker Studio dashboard was connected to this database and refreshes automatically on demand or on a schedule. Importantly, the dashboard continued to function exactly as before while now running on a scalable database foundation.
This setup ensured that as transaction volume grows, reporting performance remains stable and reliable.
If you want to combine multiple data sources, build reliable dashboards, and ensure your reports refresh automatically, some form of ETL is not optional. It is the foundation that makes automated Looker Studio reporting possible.
Choosing the right ETL strategy depends on your technical skills, data volume, and reporting complexity. In most cases, businesses choose between ready-made ETL tools and custom data warehouse integrations.
Below are the most effective approaches based on practical experience.
Ready-made connectors are pre-built integrations that extract data from platforms and send it directly to Looker Studio. These connectors are developed and maintained by third-party providers.
The main advantage is simplicity:
For example, SEMrush provides its own free Looker Studio connector for customers. Once connected, data flows automatically into dashboards without manual exports.
There are also dedicated ETL tools such as Windsor.ai, Supermetrics and Vidi Corp
These tools offer multiple integrations across advertising, e-commerce, CRM, and financial systems.
Windsor is one of the most affordable options. You can get up to 3 integrations starting from $20 per month, and you can use code VIDI for an additional 10% discount.
Based on our experience, Windsor connectors work well for sources like:
However, they tend to run slower with more complex APIs such as:
Ready-made connectors are ideal for agencies or small teams that need quick deployment without managing infrastructure.
At Vidi Corp, we also provide our own Looker Studio integrations for platforms such as Shopify, QuickBooks Online, ClickUp, and others.
Unlike basic connectors that send data directly to Looker Studio, our integrations first extract API data into a data warehouse like BigQuery. This allows us to clean, restructure, and optimise the data before it reaches your dashboards.
Because the data is prepared inside BigQuery rather than processed live in Looker Studio, dashboards load significantly faster. This performance improvement is driven by BI Engine, which we explain in the next section.
An alternative to ready-made connectors is to build your ETL process from scratch using BigQuery as the backend. This approach gives you full control over how data is extracted, transformed, and structured. Sometimes it is the only approach you have as pre-built connectors are not available for many data sources.
Instead of relying on third-party tools, you write custom code to extract data directly from APIs. This gives you flexibility in handling complex logic, large datasets, and custom transformation requirements.
Google provides an in-memory acceleration layer called BI Engine, which speeds up SQL queries coming from Looker Studio reports.
Because queries are processed directly inside BigQuery using BI Engine:
This makes BigQuery the natural backend for scalable Looker Studio dashboards.
Our typical setup follows this structure:
This creates a fully automated, warehouse-based ETL pipeline.
As you can see this approach is more code-heavy and requires some specialised skills. If you don’t have these skills in-house we recommend discussing your project with data warehousing consultants.
Choosing the right ETL strategy depends on your technical capabilities, budget, and timeline. Below are the three main factors to consider.
If your team does not have experience in data warehousing, APIs, or cloud infrastructure, pre-built ETL tools are the safer option.
Ready-made connectors are code-free. You do not need to manage databases, write Python scripts, or deploy Google Cloud Functions. Everything is handled by the provider.
On the other hand, building a custom BigQuery-based ETL pipeline requires technical expertise in:
If you lack in-house technical skills, pre-built connectors reduce complexity and risk.
Pre-built connectors are typically more affordable upfront. However, they can be more expensive if you are connecting to a large number of accounts.
Most ETL tools operate on monthly subscription pricing. This makes costs predictable and lower compared to building custom infrastructure, which requires development time and potentially ongoing maintenance.
Custom ETL development involves:
For smaller teams or agencies, pre-built connectors are usually the most cost-effective starting point.
If you need dashboards deployed quickly, pre-made connectors are ready to go.
You can connect data sources to Looker Studio within minutes or hours. There is no need to design databases, write extraction logic, or configure cloud functions.
A custom BigQuery-based ETL pipeline takes longer to design and implement. However, it may pay off long-term if you require scalability and performance.
The right ETL approach depends on your data volume, technical setup, and growth plans. You can start with ready-made connectors for speed and simplicity, or build a BigQuery-based architecture for performance and flexibility. What matters most is building a structure that supports automation and accuracy from day one.
If you want help designing or improving your Google Data Studio ETL setup, contact us. Our data warehouse consultants will assess your current reporting process and recommend the most efficient solution for your business.
![]()
![]()
![]()