Domo dashboards are a collection of data visualizations that help to find trends and patterns in the data. They usually extract data from one or multiple data sources, blend it together, and present multiple KPIs on the same screen.
At Vidi Corp, our Domo consultants have created dozens of dashboards from sources like HubSpot, QuickBooks Online, Google Ads, and Facebook Ads.
In this article, we will show 3 examples of Domo dashboards that we built, explain the thinking process behind them, and demonstrate the features that we used in those projects.
Let’s dive into it! But first…
Domo is a data analytics platform that connects automatically to 2000+ data sources, enabling developers to transform this data and visualize it. Domo helps companies to simplify the reporting process by creating a fully automated dashboard.
It is fully cloud-based meaning that all your work happens in the browser. As a result, developers can access it from any operating system: Windows, Mac, Linux, etc.
It is quite an expensive software, with every license cost being negotiated individually, but most of our clients pay $600-2000 per month.
Domo is quite SQL-heavy, which is great because many developers learn SQL outside of Domo and then can apply it in the platform. This makes the transition into developing Domo dashboards easier for developers who can code in SQL. At the same time, this is a barrier to entry for developers who do not work with SQL.
Domo has no-code tools like Magic ETL, which allows you to transform data with a drag-and-drop interface. However, in our experience, you can be a lot more flexible in your data transformations if you can write SQL queries.
Domo has many interactive dashboard features that enable a more engaging user experience. Well-designed Domo dashboards use these features to allow users to dig deeper into data and gain more context for their business performance.
Some of the Domo interactive dashboard features worth mentioning are
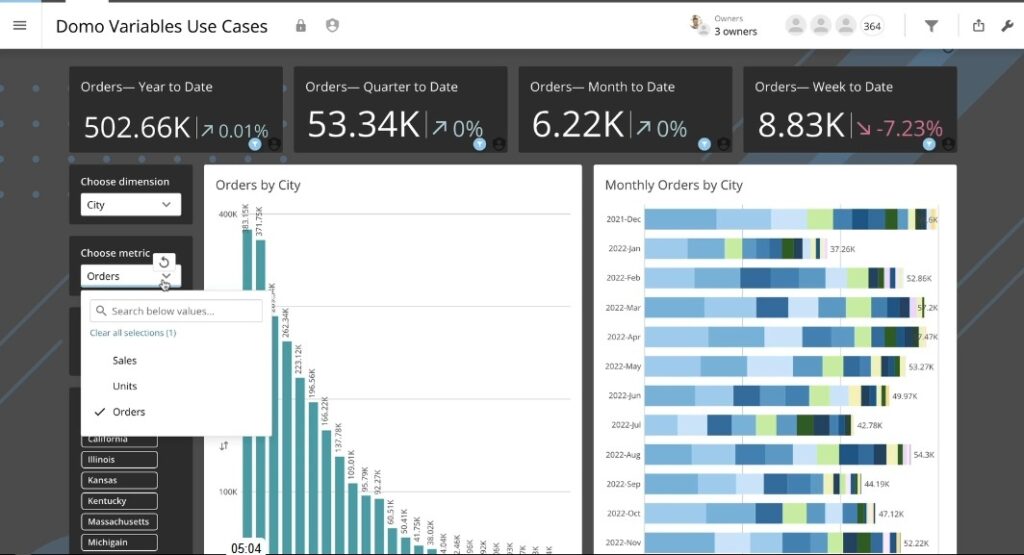
Domo variables are selection menus that look like filters, which can be numeric or categorical.
Categorical variables can be used to allow users to pick a metric that they want to view in the chart. They can be used to switch between sales, units, and orders in the charts.
Numerical variables are parameters that can be adjusted and passed to other formulas. They can be used for what-if analysis, where a user adjusts a numerical variable (such as discount %) to see the impact on all the other metrics in the dashboard.
Domo data writeback allows users to write data back into their data source straight from their Domo dashboards. It is really useful for tasks like financial forecasting, where directors would be analyzing the data in the dashboard and then entering their forecast input without leaving Domo.
Data writeback is currently only supported for 25 connectors, such as Google Drive, OneDrive, Salesforce, and Smartsheet.
This feature is quite unique and you can not find it in other BI tools like Power BI, Tableau, or Looker Studio.
Domo drilldown is a feature that allows to surface relevant insights when users click on any element in the chart. For example, when users click on a bar in a column chart, we can use drilldown to show them another graph. This new graph would be filtered to the selected category.
Based on our experience, Domo dashboards are most impactful when you need to blend multiple data sources. We will demonstrate several Domo case studies below that our BI consultants built for clients.
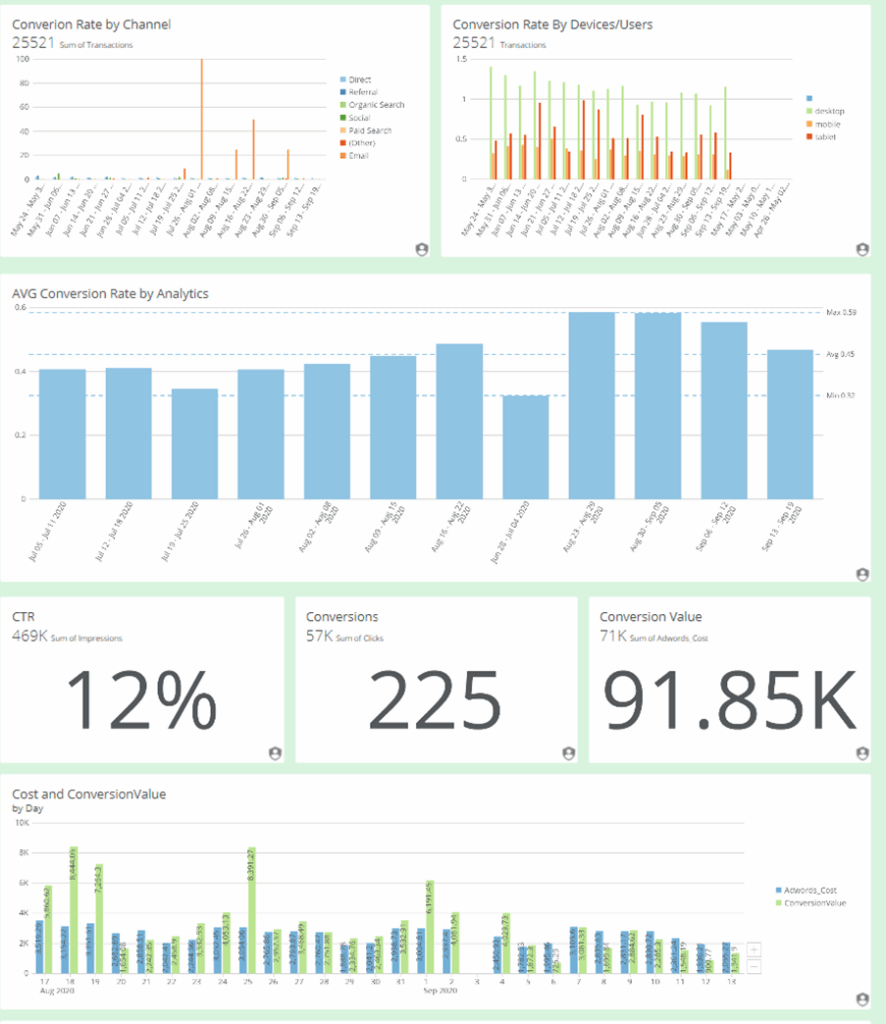
This Domo marketing analytics dashboard combines online marketing data for 7 websites, including 7 WooCommerce accounts, GA properties, and Google Ads accounts.
The client operates in multiple countries and deals in multiple currencies. This Domo dashboard converts all the revenue and cost data to USD for easy reporting. It is also making it easy to compare current performance to last month and last week by combining all the data from multiple stores together.
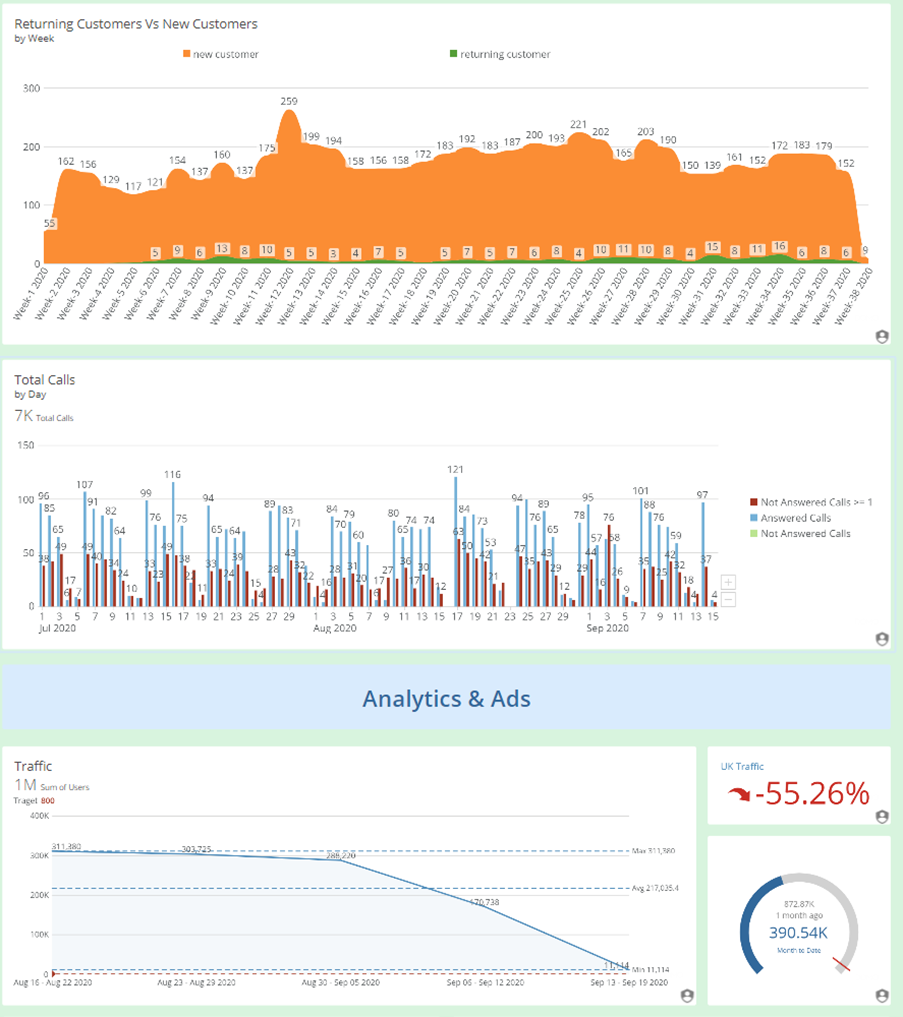
The next section of this Domo marketing analytics dashboard visualises the number of new and recurring customers by week. This analysis helps to measure how effectively the marketing team reactivates existing customers.
This Domo dashboard also shows the trend for the number of calls generated from the website. Crucially, it provides insights into the number of unanswered calls since those are missed sales opportunities. The management can use this analysis to inform hiring decisions for the sales team and plan capacity throughout the week.
Finally, we combined 7 Google Analytics properties to report on the number of website visitors by week. The client can also filter to a website from a single country and analyze their traffic numbers.
Finally, this Domo marketing analytics dashboard shows the conversion rate by device and traffic channel.
These graphs make it easy to see that the conversion rate for desktop is higher than mobile, which means that the user interface needs to be optimized for mobile.
This analysis also discovered that the highest conversion rate is for email, which means that the marketing team needs to emphasize collecting emails from the website traffic.
Finally, this Domo dashboard compares the Google Ads cost with the conversion value to measure the profitability of the marketing efforts.
If you’d like to build a similar marketing analytics dashboard for your organization, get in touch with our marketing analysts today!
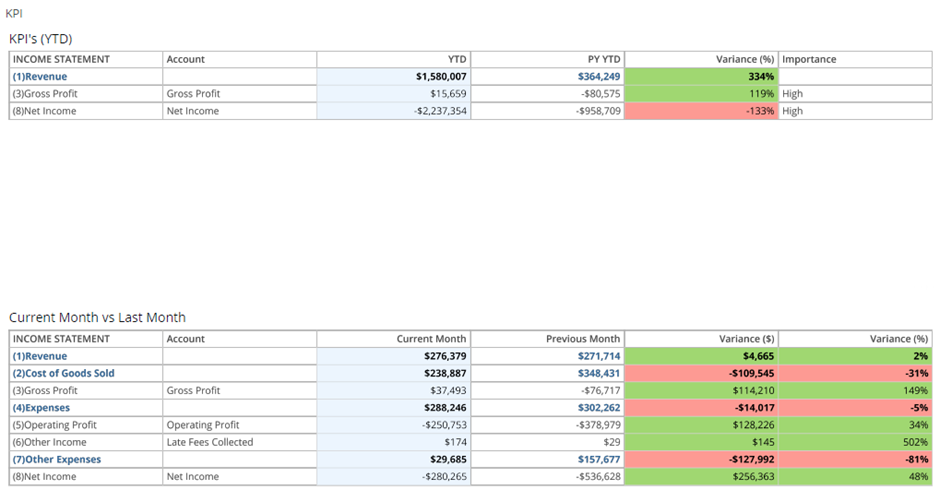
This financial analytics Domo dashboard analyses the accounting data from QuickBooks Online to inform financial management decisions. It visualizes the data from financial statements like P&L, Balance Sheet, and Cash Flow to offer a year-to-date view and compare performance to last year.
This Domo dashboard starts by showing the year-to-date P&L performance and comparing it to last year. It then compares the current month’s financial performance for every P&L line to the previous month’s performance.
This analysis helps to track the business’s progress towards improving its financial position over time.
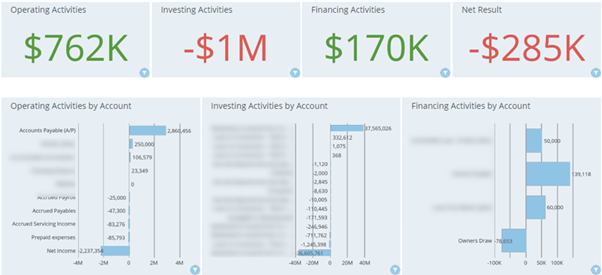
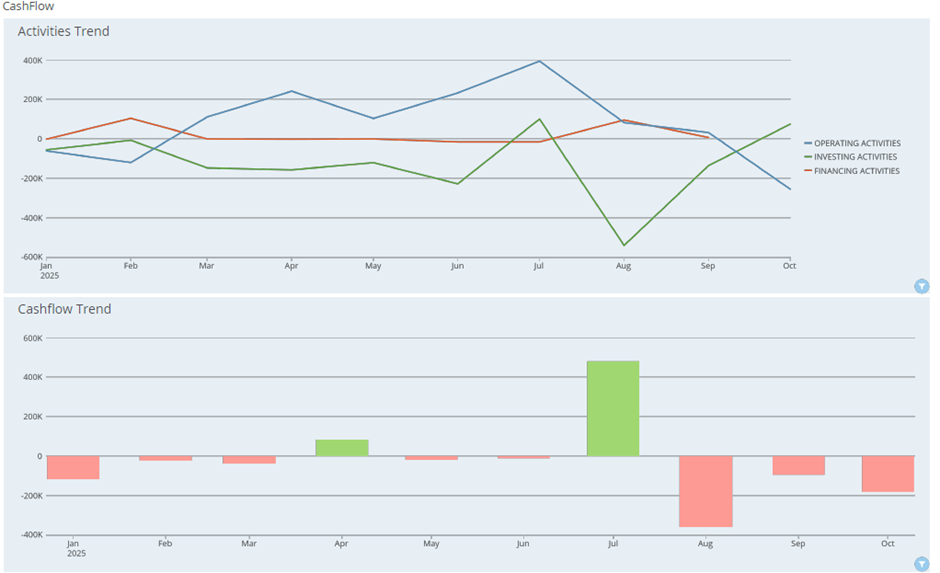
The next part of this Domo dashboard analyzes the cash flow changes for the selected period. It shows the changes in cash flow from operating, investing, and financing activities over time.
The main benefit of this dashboard is being able to separate the investing activities from the rest. This helps the financial director to ensure that the operating activities provide sufficient cash flow for the business to be profitable.
The cash flow for every type of activity is broken down further by account to see the largest items that impact the overall cash flow.
Finally, we analyzed the cash flow by month to help the client track whether the latest months make a positive or negative impact on the cash flow
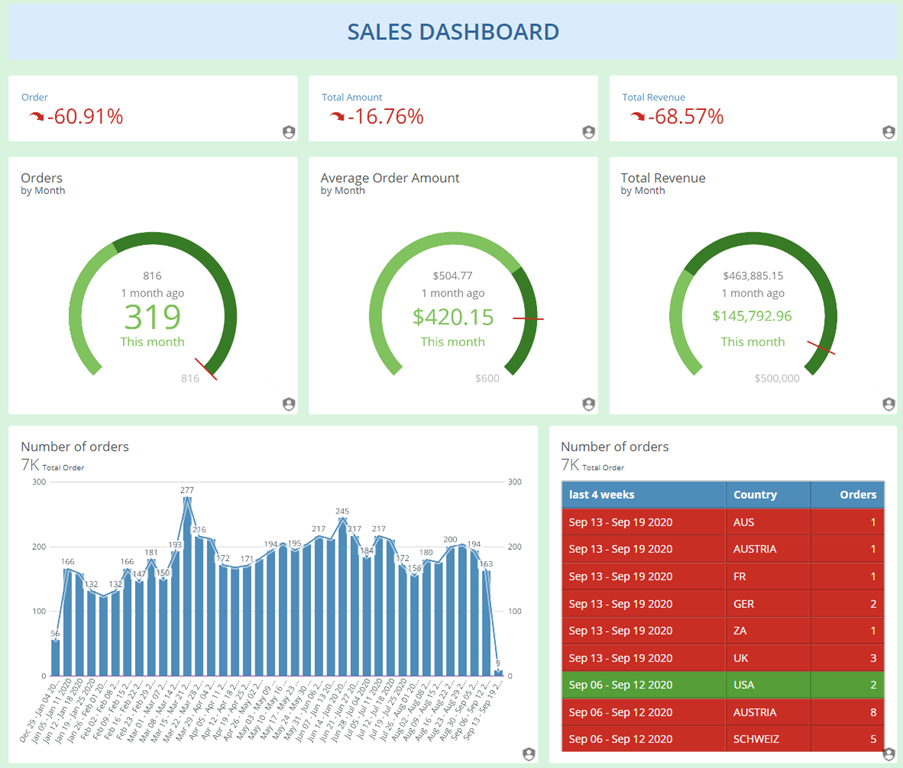
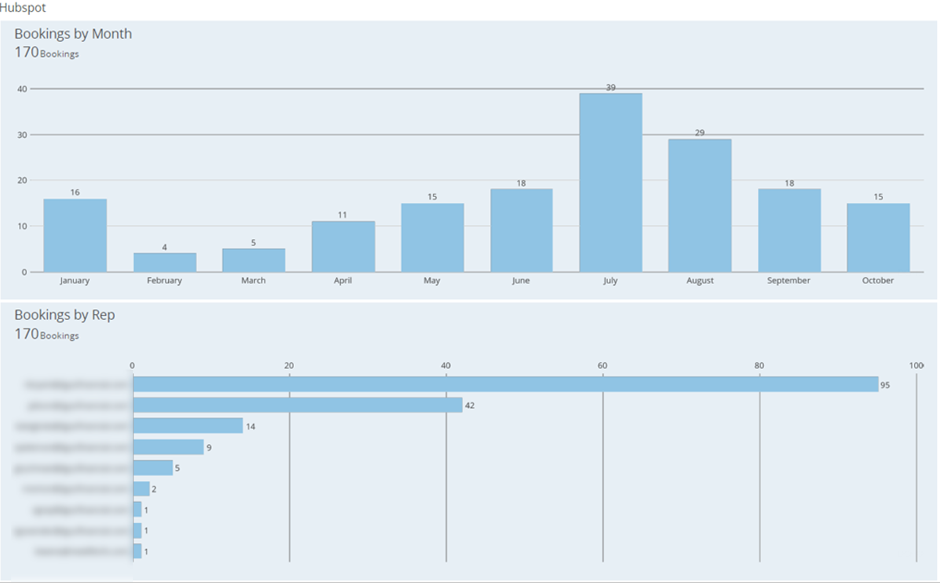
The Domo sales dashboard that our BI consultants created analyzes the sales team activities and results by pulling data from HubSpot.
The purpose of this Domo dashboard is to help with the sales team management and make the sales performance more predictable.
We started by analyzing the number of booked meetings by month and sales reps. The number of meetings is a strong predictor of upcoming sales and is a key indicator of the prospecting effectiveness.
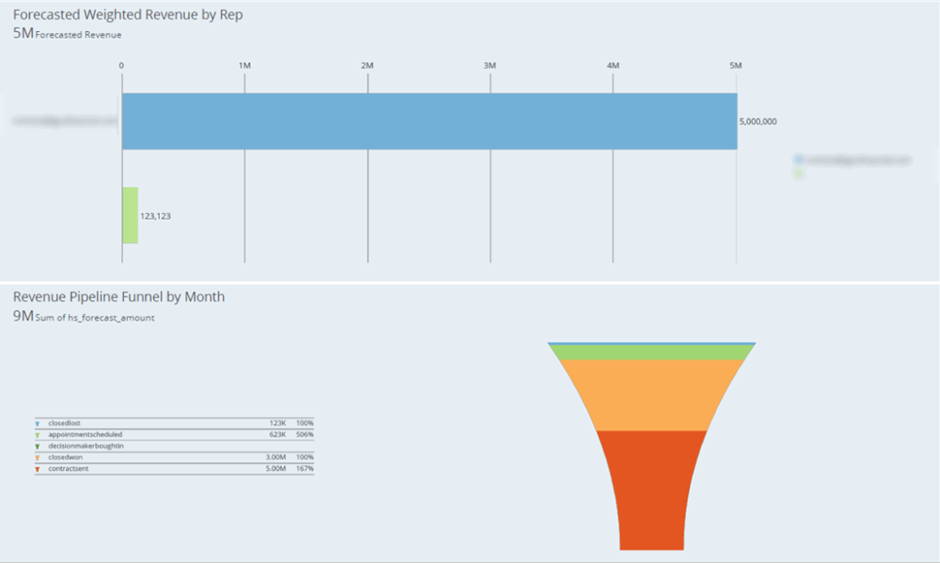
We then analysed the forecasted revenue by sales rep and how much revenue is sitting in every step of the pipeline. This data visualization helps the sales director to forecast sales for the end of the current month.
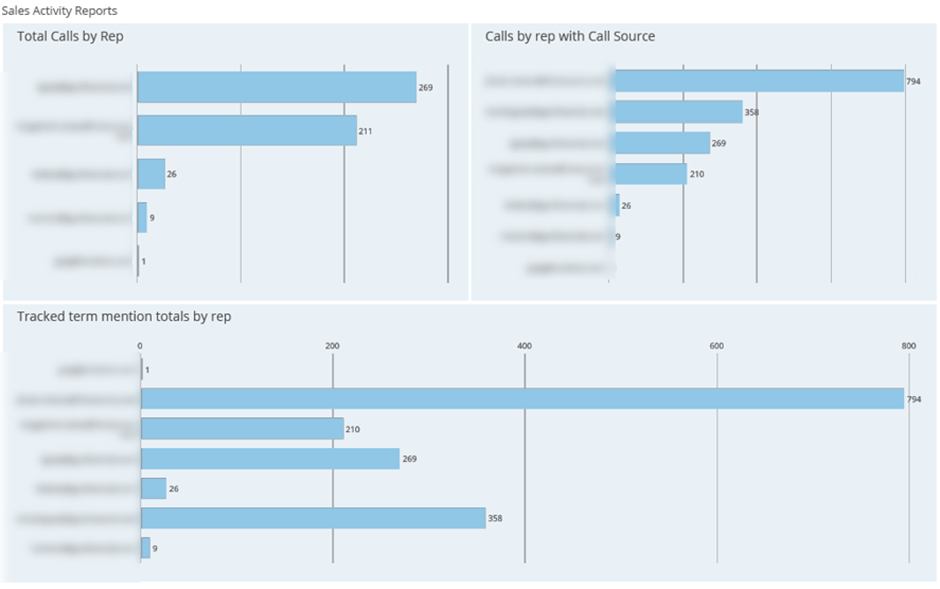
The Domo dashboard then analyzes the number of calls by sales rep to measure if the sales reps are meeting their activity target. In this case study, HubSpot was also integrated with a call tracking software, which tracked how often a specific phrase was mentioned. We then visualized the number of tracked term mentions to determine which sales rep contacts more relevant prospects.
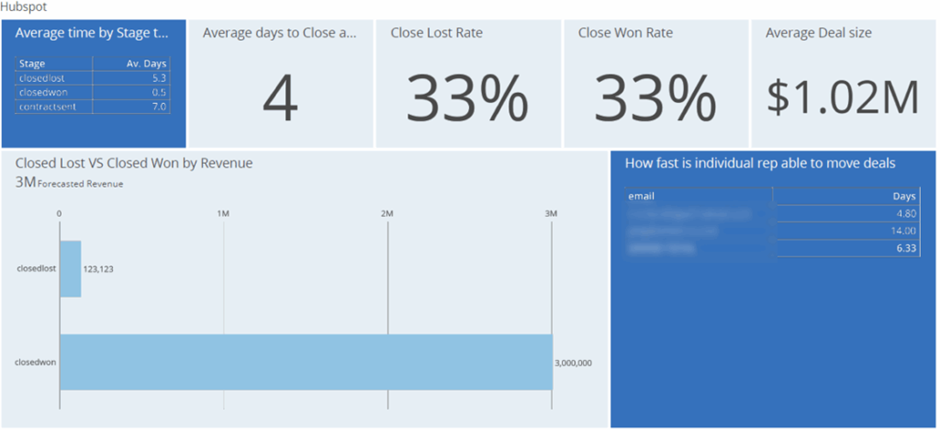
Finally, we analysed the number of days that it takes each sales rep to move a deal to the next step of the funnel. This analysis makes it easier to predict when the current deals will be closed.
We also analyzed the percentage of won deals and the average deal size. The sales director uses this analysis to predict how many current deals will convert into revenue in any particular month.
At Vidi Corp, we have developed 1000+ data visualization solutions for 600+ clients, including Google, Teleperformance, and Heineken. We have experience in many different industries, and we are already familiar with the data format in all the common data sources.
We are currently ranked as the #1 business intelligence consultancy in the world by G2 and have received dozens of international awards.
We would be excited to bring our experience to your project! Contact us today to start building your Domo dashboards.
![]()
![]()
![]()