Visualising data that drives growth
Our dashboard development services design, build, and optimise analytics dashboards that produce the right KPIs, at the right time, for business decision makers, so that they can implement with confidence.
#1
Business intelligence consultancy worldwide, according to G2
1000+
Dashboards
developed
600+
Happy
Dashboard development clients
20k+
Hours
worked


We specialise in creating dashboards that are both functional and visually compelling, ensuring teams can access the data they need quickly and intuitively.

We build BI dashboards using industry-leading platforms like Tableau, Power BI, and Looker to provide strategic insights and enable smarter business decisions.

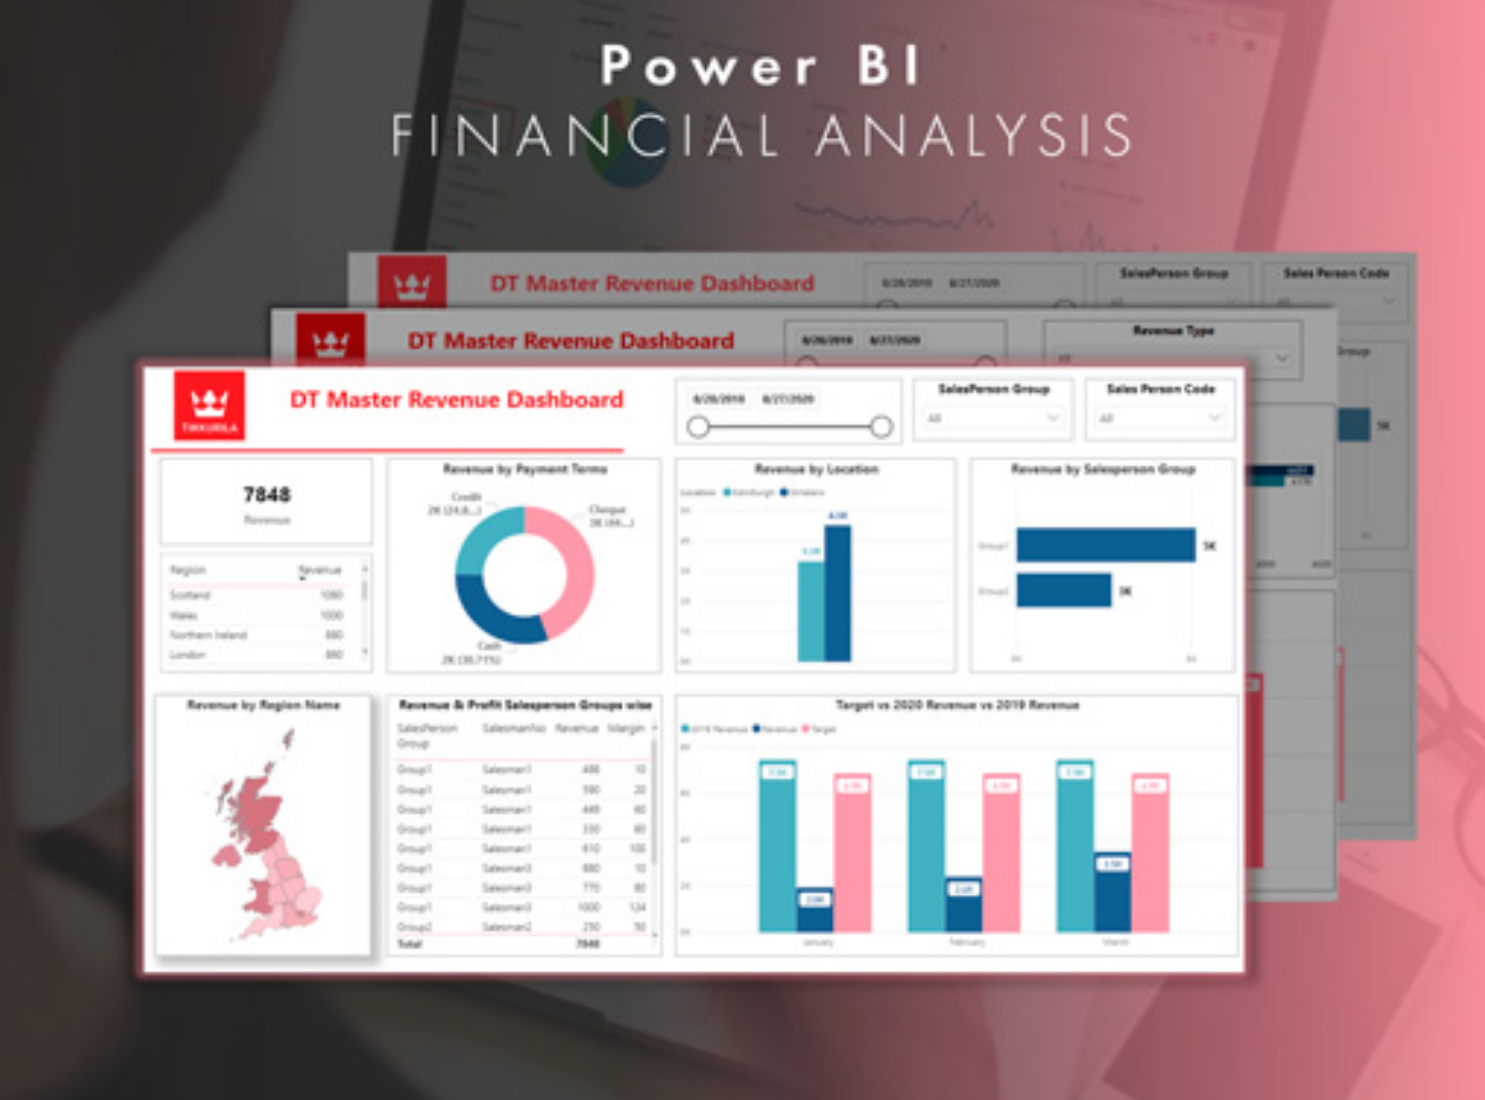
We provide expert Power BI dashboard development services that transform complex business data into actionable visual intelligence. Our approach combines Microsoft-certified technical expertise with a strong focus on delivering measurable business value and ROI, beginning with a free needs analysis to ensure strategic alignment.

We excel in delivering strategic dashboard design services that merge intuitive user experience (UX) with robust data architecture to create powerful, decision-driving analytics tools.
Our agency approach is distinctively business-outcome-led, beginning each project by identifying the critical questions that need answering to ensure every design delivers actionable insight, not just data visualisation.

Vidi Corp provides expert dashboard migration consulting services to seamlessly transition organisations from legacy systems or disparate tools to a unified, modern analytics environment powered by platforms like Microsoft Power BI and Tableau.
Our proven methodology begins with a comprehensive audit of existing dashboards and data sources, crafting a strategic roadmap that prioritises business continuity and value.


Our structured approach ensures your dashboards are customised, business-focused, and easy to scale.
Our team brings decades of specialised dashboard design and deep industry expertise to address the unique challenges within healthcare, retail, finance, and manufacturing.
We believe in a collaborative approach, co-creating tailored strategies that are built around your specific business objectives, compliance framework, and operational DNA.

Clarity over clutter
Minimalist canvases, clear hierarchy, scannable headlines, plain-language labels.

Performance first
Efficient queries, incremental refresh, aggregates, and caching to keep load times low.

Accessibility
Keyboard navigation, contrast ratios, alt text, and colour-blind-safe palettes.

Mobile-ready
Responsive layouts and touch-friendly interactions for execs on the move.

Governance & Trust
Data lineage, metric catalogues, and audit trails.

Enhanced Profitability
Move beyond guesswork and base your critical decisions on definitive data. An example is our client, Neterra Telecommunications: following our dashboard implementation, they not only identified efficiency gains worth €50,000 but also discovered new business opportunities that established €10,000-€20,000 in annual recurring revenue.

Improved Operational Efficiency
Our dashboard services enable optimal allocation of resources; human, temporal, or financial, ensuring they are directed toward the highest-impact activities.
For example, after implementing for the marketing team at DS Smith, they achieved time savings exceeding 30 working hours per month, allowing them to focus on strategic initiatives rather than manual data compilation.

Better Strategic Decision-Making
Our dashboard development turns complex data into a clear catalyst for growth, providing a definitive edge in competitive markets. After implementing a tailored dashboard solution for an HVAC company, they achieved a 40% faster turnaround on strategic decisions and reduced their executive review cycles by two full days.

Faster Problem-Solving
Anticipate risk before it becomes a crisis. Following a €100M regulatory fine, Google partnered with us to build a global compliance dashboard that automatically tracks and assesses new legislation, transforming risk management from reactive to strategic.

Expertise & Quality
Power BI democratises data access by automatically aggregating live information into user-friendly dashboards. A review from an agricultural manufacturer highlights this impact, noting that linking QuickBooks Online to Power BI eradicated manual errors and established a new standard of reporting precision.
Implementing Power BI reports delivered immediate and long-term value. We saved €50,000 right after launch by identifying a timely cost-saving opportunity, and uncovered new business opportunities that now generate €10,000–€20,000 in monthly recurring revenue. Automation through Power BI eliminated the need for a full-time business analyst dedicated to Excel reporting. The impact of our reporting was also recognised nationally, contributing to our win in the “Transformation of the Financial Function” category at the 2024 CFO of the Year awards in Bulgaria.
Mariyan Rangelov, CFA

This Power BI report replaced three legacy reports, saving over 30 hours per month on data consolidation and maintenance. It eliminated manual errors, enabled real-time insights for senior directors, and empowered the marketing team to focus on analysis and strategy. The visually engaging format highlights marketing ROI, even for non-marketing stakeholders.
Regional Category Manager, DS Smith
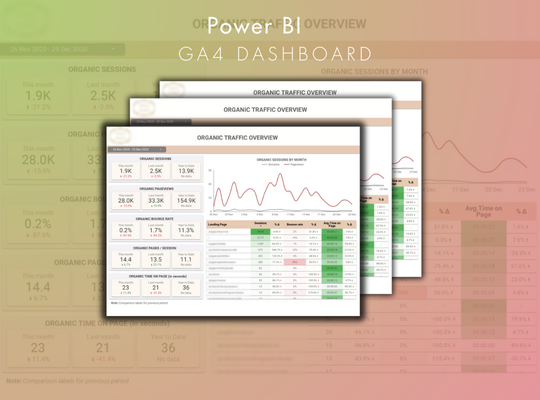
Vidi Corp played a key role in setting up automated Looker Studio reports for our performance marketing agency, enabling efficient client updates across SEO, PPC, and other channels. They also audited and fixed GA tracking for several clients, providing clear documentation and successfully implementing accurate conversion tracking. Their continued GA4 consulting support remains invaluable.
CEO, The Wanamaker Project

Choosing us means working with a dedicated team of data experts, designers, and developers who understand both the technical and business side of dashboard development. We create solutions that are not only advanced but also tailored to deliver long-term value.
Whether you need a custom-built business dashboard or enhancements to an existing BI environment, we provide end-to-end solutions that grow with you.
Contact us today for a complimentary consultation and discover how a customised dashboard solution can enhance your workflow.
Dashboard Development Services involve the professional design and creation of a custom dashboard that transforms your raw data from spreadsheets, databases, software, and other sources into easy-to-understand charts, graphs, and key performance indicators (KPIs).
An MVP focused on a single domain typically ships in 1–4 weeks. Multi-domain programs may run for 6–12 weeks, depending on the complexity of the data.
Yes, multi-entity rollups (e.g., multiple QuickBooks/Xero or Salesforce orgs) are common; we standardise dimensions and currency handling.
We ensure your data is accurate by source-to-report reconciliation, unit tests on transformations, and documented metric definitions you can audit.
You do. We hand over files, models, and documentation, and can maintain under a support plan if desired.
![]()
![]()
![]()