Our data visualization consulting services help design executive-ready dashboards, build clear data stories, and embed best-practice visual analytics so business leaders act faster, with confidence.
Our data visualization experts combine industry expertise with cutting-edge visualization technologies to blend design, analytics, and change enablement, so your visuals don’t just look good; they move the business.
#1
BI data visualization agency worldwide, according to G2
1000+
Completed
projects
600+
Happy
clients
20k+
Hours
worked

As a top data visualization consultancy, we provide end-to-end data visualization services to address your unique business challenges and opportunities across all organizational levels.
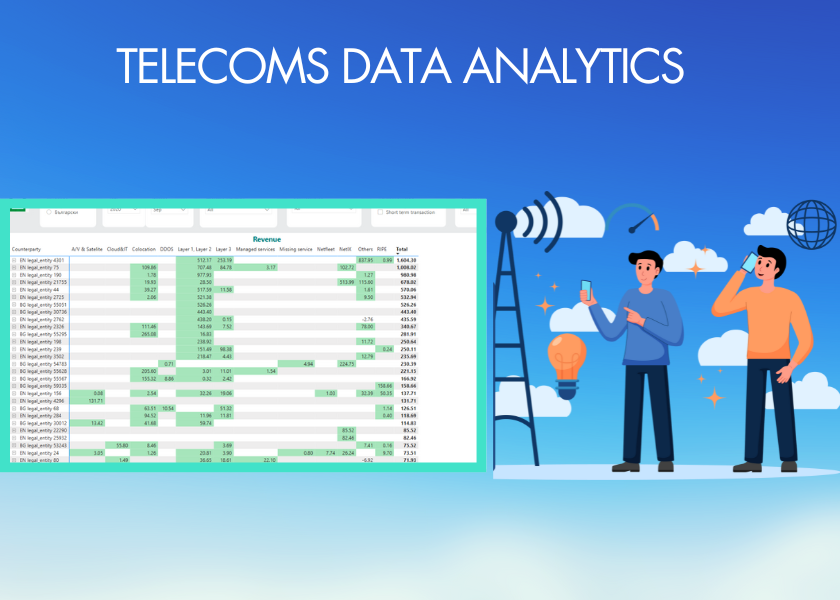
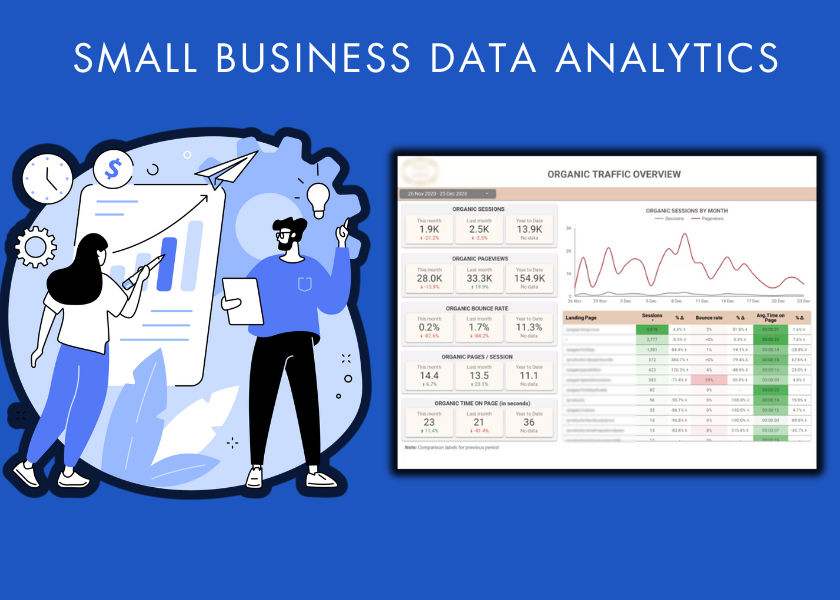
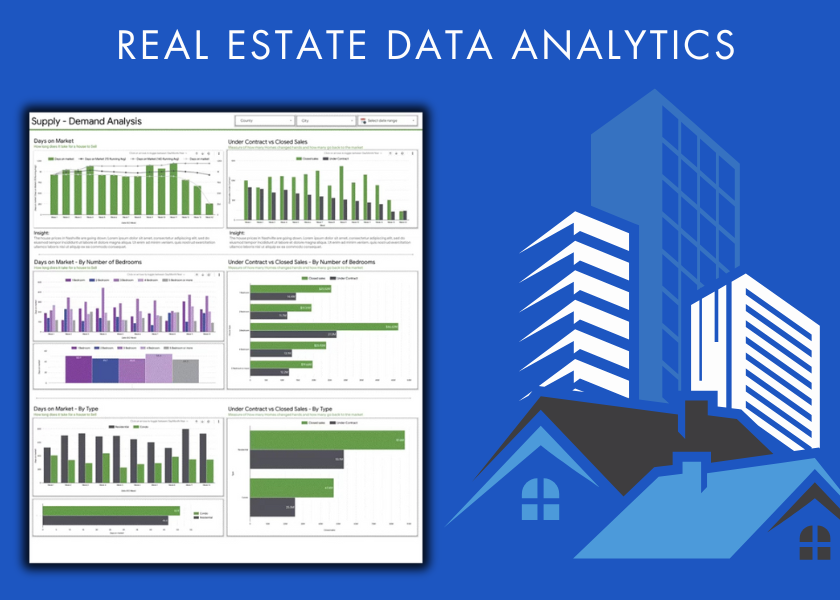
We tailor our solutions to address unique challenges and opportunities across diverse sectors, delivering measurable business impact where it matters most.
Our data visualization experts develop dashboards that provide a unified view of your business performance are built for your business. Clients use these analytical dashboards to uncover trends, correlations, and performance drivers, empowering teams with data-backed decisions. All dashboards are mobile-friendly and responsive, ensuring you can monitor performance, track KPIs, and visualize trends anytime, anywhere.
We provide data visualization services in Tableau to businesses that need advanced analytics. Tableau offers unmatched flexibility for creating tailored visualizations comparing to other BI tools. Our Tableau consulting services include dashboard design, Tableau server configuration, performance tuning and beyond!
Our data visualization agency helps you design and implement automated reporting systems that eliminate manual data extraction and transformation. By integrating directly to your data sources and analytics platforms, we ensure that reports are refreshed and delivered automatically to key stakeholders. This approach guarantees that every department has accurate, up-to-date information without waiting on analysts or monthly reporting cycles.
We develop a tailored data visualization strategy that aligns with your organization’s unique goals, data maturity, and decision-making processes. Our consultants assess your current analytics landscape, identify key business questions, and define how visual storytelling can drive clarity and action across departments. This includes establishing visual design standards, KPI frameworks, and governance models to ensure consistency, accuracy, and scalability as your data evolves.
Enterprise-ready intelligence capabilities in data visualization. Transform complex data into clear, actionable insights that streamline operations, drive revenue growth, and position your business for long-term success.


I recently worked with Vivid Corp on a series of Power BI dashboards, and I couldn’t be more impressed with the outcome. Eugene and his team were absolutely spot-on from start to finish. They took the time to understand our specific needs and delivered dashboards that were not only visually appealing but also packed with the insights we needed to drive our business forward. Communication throughout the project was seamless, and any adjustments or tweaks were handled with professionalism and efficiency. If you’re looking for a team that combines technical expertise with exceptional customer service, I highly recommend Eugene and the crew at Vivid Corp. They truly
James Yacoub

We’ve really enjoyed working with Eugene. It’s been a challenging project to get right but Eugene has been very diligent in supporting us through it and we are delighted with the results. Eugene has always been reliable, accessible and super helpful and we are looking forward to building a longer term partnership in the future. Would be happy to endorse his work.
Simon Bassett
Vidi Corp Team helped my company build the financial and business reporting needed both for the day-to-day business of the company and the strategic decision making. They created outstanding automated Power Bi reports that completely changed some of our processes by providing us reliable, live business information. The communication with Vidi team is smooth and friendly. They do understand what the customer needs and really know how to crunch complex data. I would recommend them to anyone.
Mariyan Rangelov
We automate your data visualization reports, saving your team valuable time and resources. Many of our clients report saving 10+ working hours per month after working with us. This is the time they reinvest in other initiatives.
With over 1,000 successful projects across diverse sectors, we deliver domain-specific insights that solve each industry’s unique challenges.
We bridge the gap between strategy and execution, designing, building, and optimizing data visualization solutions in full partnership with your team. From aligning data initiatives with business goals to deploying scalable dashboards and performance workflows, we ensure seamless integration across people, processes, and technology..
Our structured process ensures successful solution delivery that aligns with your business objectives while maximizing return on investment.

Data Visualization Consultation
We begin with comprehensive stakeholder requirements gathering to understand your specific KPIs, user personas, and decision-making workflows. Through in-depth analysis, we establish clear success metrics and project milestones while evaluating your organization’s analytical maturity level to ensure solution-fit.

Data Assessment & Architecture
Our data visualization experts conduct thorough audits of your data landscape, evaluating source system reliability, data quality standards, integration complexity, and security requirements. We identify data gaps and enhancement opportunities while creating detailed data dictionaries and mapping documentation for accurate project scoping.

Solution Development & Integration
Our development team builds custom visualization solutions using agile methodologies that enable continuous feedback and refinement throughout the process. We establish robust data connections, implement automated refresh schedules, and conduct comprehensive testing to ensure security, performance optimization, and cross-platform compatibility.

Deployment & Optimization
We manage seamless solution deployment with minimal business disruption while establishing monitoring protocols for performance tracking. Through continuous optimization based on user feedback and changing business requirements, we ensure your visualization solution evolves with your organization’s needs.

Training & Change Management
Success depends on user adoption, so we develop role-specific training sessions and user guides while implementing change management strategies that build analytical literacy across your organization. We establish knowledge transfer protocols for independent maintenance and continuous improvement.
Data visualization consulting services empower organizations to turn raw, complex data into clear, visually engaging insights through custom dashboards, interactive reports, and impactful data storytelling. These services encompass data integration from diverse sources, the design of strategic and operational dashboards, and the optimization of existing visualization systems to enhance clarity, speed, and performance. Consultants also provide training and enablement, ensuring teams not only use visualization tools effectively but also interpret and communicate data with confidence to support smarter, faster decision-making.
Common forms include charts and graphs (bar, line, pie) for comparisons and trends, tables for precise values, maps for geographic data, dashboards for real-time KPI tracking, infographics for storytelling, and advanced visuals like scatter plots, treemaps, or network graphs to reveal complex relationships and patterns.
Discovery: Assess needs, data maturity, and goals.
Planning: Co-create a roadmap with milestones.
Execution: Develop, test, and deploy solutions.
Optimization: Monitor performance and refine strategies.
We use Power BI, Tableau, Domo, and Looker Studio
![]()
![]()
![]()