
Automotive business intelligence brings together the best of data integration, advanced analytics and some seriously cool visualisation tools to help transform the way car makers, Tier 1 and Tier 2 suppliers, dealerships, rental companies and mobility platforms handle data. By doing this, you can take raw automotive data and turn it into real actionable insights – not just something to look at on a dashboard.
BI consolidates information from enterprise resource planning systems, manufacturing execution systems, dealer management systems, telematics, warranty databases, and CRM platforms
At Vidi Corp, our business intelligence consultants have a proven track record of delivering top-notch automotive BI solutions to major car manufacturers like Chrysler, dealership chains with 100+ stores, and loads of other companies, too. In this article, we’ll give you a quick rundown of the bi solutions we’ve developed, explain how they get used in the real world and the tech that we use to build them.
Effective BI doesn’t just depend on having some nice-looking dashboards – it needs a robust technical architecture as well. Knowing what the core components are will help decision makers evaluate bi solutions and plan for implementation.
Source Systems: These are the places where all the data is generated in the first place – from factory sensors to logistics platforms and dealer management systems. All this data is flowing in 24/7.
The ETL/ELT Layer: This is where the magic happens, folks. This is where disparate data formats get converted into something that’s actually usable for analysis.
Business Intelligence Data Warehouse: This is where all the historical data gets consolidated. We’re talking structured warehouse schema combined with flexible data lake capabilities.
Analytics and Visualisation: This is where the business users come in – they get to access dashboards, reports, self-service exploration tools and even embedded analytics within dealer and plant portals. In our experience, the most popular choices for BI dashboards in the automotive industry are Power BI, Tableau or Looker Studio.
The automotive industry is churning out massive amounts of data on a daily basis. The challenge is to turn that data into real, measurable improvements across the operation. Based on our experience, here’s where automotive bi creates real value in 2025-2026.
Automotive manufacturing dashboards are a real game changer for production managers, maintenance teams and plant directors. They help them monitor equipment performance, component wear and operational reliability across all those assembly lines. They’re especially useful in OEMs and Tier 1 suppliers where machines are running continuous, high-volume production cycles. Any small inefficiency can really impact output.
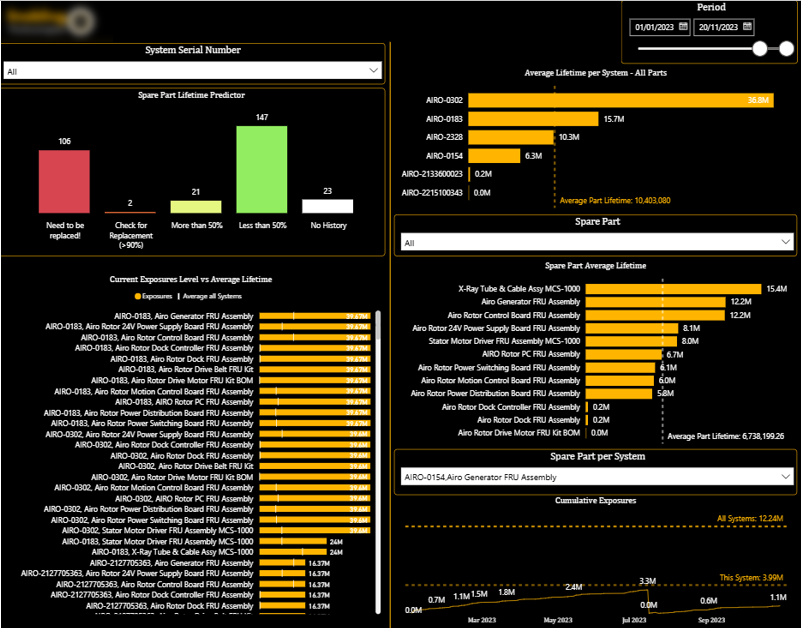
Our Power BI consultants developed a custom dashboard to help our client analyse the lifecycle of machine components based on usage data. We broke down each machine into individual parts and tracked their accumulated cycles alongside expected lifetime thresholds. It combined historical replacement data, calculated lifespan metrics and usage trends with interactive visuals to flag overused components and filters to group parts by remaining lifespan. A detailed trend view showed how individual components accumulated cycles over time and reset after replacement. This all created a clear audit trail of maintenance activity.
This gives teams the power to plan maintenance proactively – identifying which components need attention based on actual usage. Maintenance schedules can be aligned with real operating conditions, spare part planning gets more accurate and teams can validate whether replacements are happening at the right time. Operational decisions start getting based on measurable equipment behaviour rather than just fixed schedules.
Automotive supply chain dashboards are a must for sales leaders, operations managers and supply chain teams to monitor demand, backlog and delivery pressure across all those product lines and customers. They’re commonly used by aftermarket parts manufacturers where demand and production constraints directly impact order fulfilment.
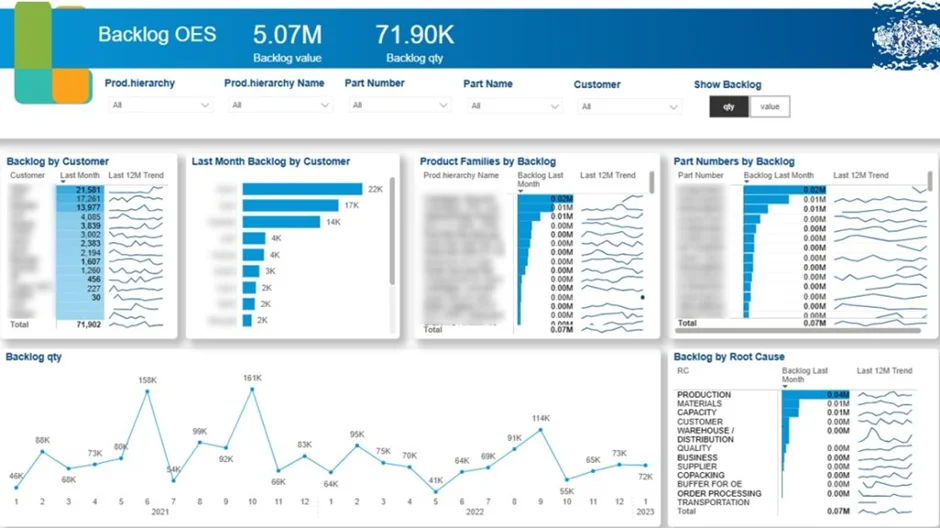
Our data visualization consultants developed a bi dashboard for an aftermarket parts manufacturer to analyse sales demand and order backlog over time. It tracked backlog by month, customer and product, and compared it against average monthly sales to assess whether delays were increasing or being resolved. It also included root cause analysis to identify what was driving backlog growth. Interactive filters allowed users to drill into specific accounts, product categories and time periods.
This helps teams to prioritise backlog reduction based on commercial impact. Customer-level analysis highlights which key accounts are most affected, while product-level insights support more accurate delivery commitments. Management can use backlog versus sales trends and root cause data to focus on the areas that reduce delays fastest and stabilise supply chain performance.
Automotive dealership dashboards are a must-have for sales managers, finance teams, and general managers to track vehicle sales performance, stock levels, and revenue mix across all sales channels. They’re commonly used by dealerships to manage inventory turnover, optimise sales strategy and improve profitability across new and used vehicles.
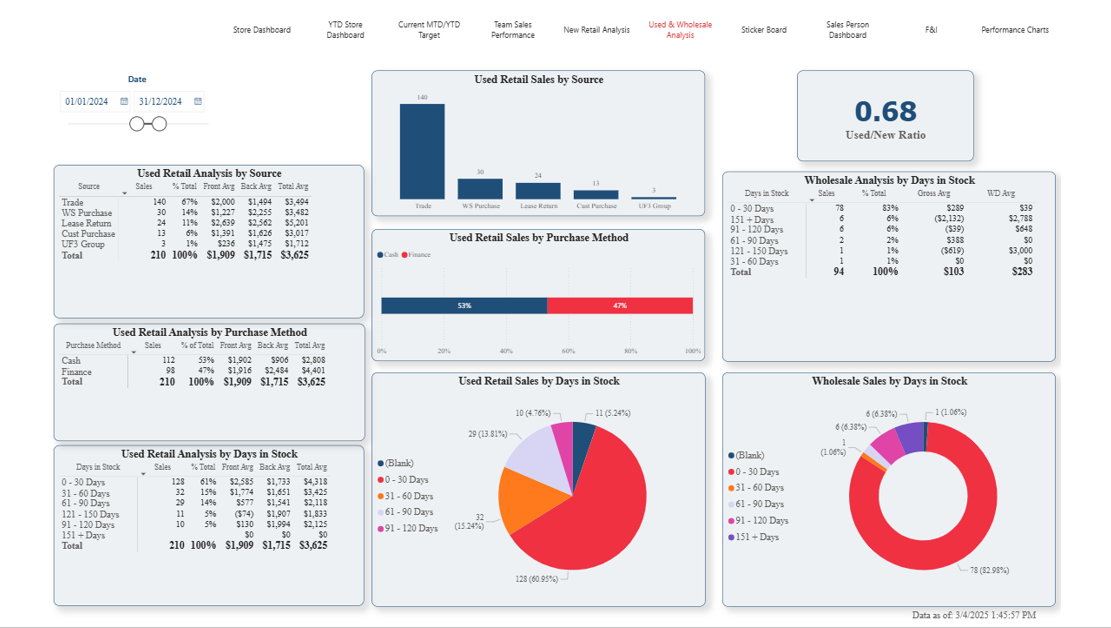
In this project, our Power BI developers built a custom dashboard for an automotive dealership to poke around in the numbers of their sales performance. The dashboard analyses how people pay for their vehicles – cash, credit, or finance – and tracks how long vehicles sit on the lot. Users can filter the analysis into new versus used cars or drill down into specific models. It also includes a detailed view of used car sales by source – lease returns, trade-ins, or direct purchases from customers, alongside a comparison of the share of new versus used sales.
This structure for car dealership analytics helps dealers to get their sales strategy and inventory management on track. Teams can identify which financing options bring in the most cash, keep an eye on slow-moving stock, and adjust their used vehicle sourcing strategy to reflect what’s actually selling. The visibility into new versus used sales mix also helps with pricing, purchasing, and promotion decisions, ensuring their inventory and sales efforts are in sync with what customers want.
One more example of business intelligence for automotive dealerships is helping sales managers and general managers size up the performance of individual salespeople across revenue, deal flow, and inventory movement. It helps them understand how each salesperson is contributing to the bottom line and where they can improve.
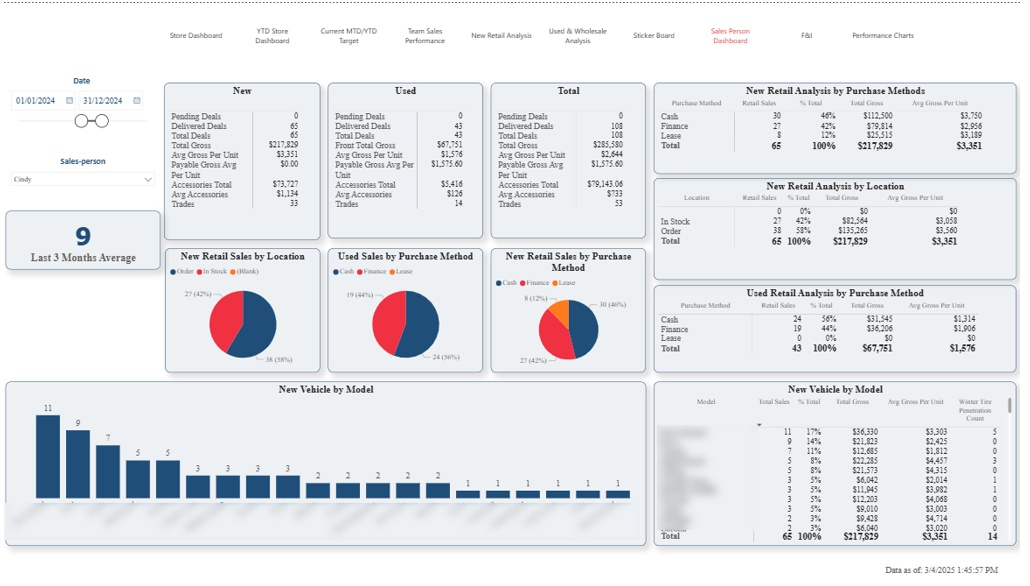
In this project, our dashboard consultants built a custom Power BI dashboard focused on salesperson analysis. Users can pick a salesperson and see key metrics like pending deals, delivered deals, total revenue, and trade-ins. These metrics are split up between new and used cars, with further breakdowns for new car sales by model, and all sales by payment method – cash, lease, or finance. The dashboard also tells the difference between vehicles sold from stock and those ordered up specifically for customers.
This structure gives management a more practical way to evaluate performance and actually act on it. Sales leaders can identify their top performers by revenue and deal type, see if their salespeople are selling accessories or other high-margin products well, and figure out how reliant they are on in-stock versus ordered vehicles. These insights help them with more focused coaching, better stock planning, and clearer sales strategies across the dealership.
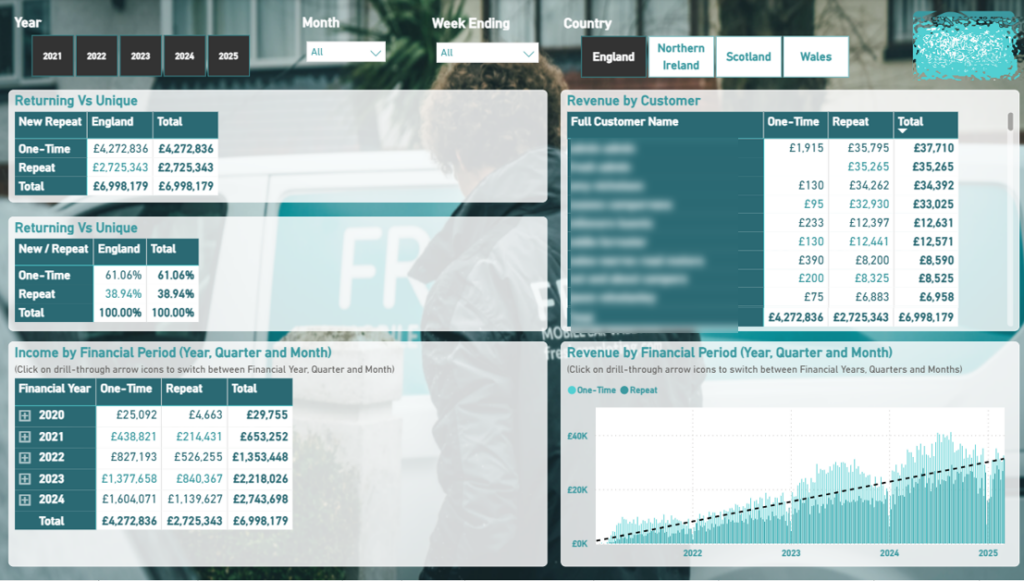
Business intelligence for automotive dealerships doesn’t just stop at selling cars – it extends into things like repairs, inspections, and maintenance services too. Service managers and operations teams use these dashboards to get a handle on customer retention, service demand, and revenue stability.
In this project, we built a custom Power BI dashboard for a mobile automotive service provider, covering car valeting, dent repairs, and maintenance. The dashboard looks at one-time versus repeat sales and breaks those down by country and year. It also provides a detailed view of individual customers, showing which ones generate repeat business, alongside monthly trends to track how service demand is changing over time.
This structure helps teams get a better grip on customer behaviour and improve their service strategy. Managers can identify which markets drive repeat revenue, keep an eye on retention patterns, and focus on customers with the highest lifetime value. The monthly trends also help with resource planning and make sure they’ve got the right amount of capacity across different regions to keep up with demand.

Business intelligence for automotive teams helps marketing, sales, and leadership understand how customers are brought in and how likely they are to come back. These dashboards are used to evaluate the long-term value of customers and measure the effectiveness of their acquisition strategies.
In this project, Vidi Corp built a custom Power BI customer analytics dashboard that tracks the number of customers brought in by year and quarter. The dashboard groups customers into cohorts based on when they were first brought in and calculates the percentage of each cohort that comes back for more business. This cohort analysis lets users compare retention rates across different time periods and spot trends in customer behaviour.
This structure gives teams a way to evaluate the quality of their customer acquisition, not just the volume. Management can identify which periods brought in high-value, repeat customers and adjust their marketing or sales strategies accordingly. It also gives a clear view of retention performance over time, supporting more informed decisions about customer engagement and lifecycle management.
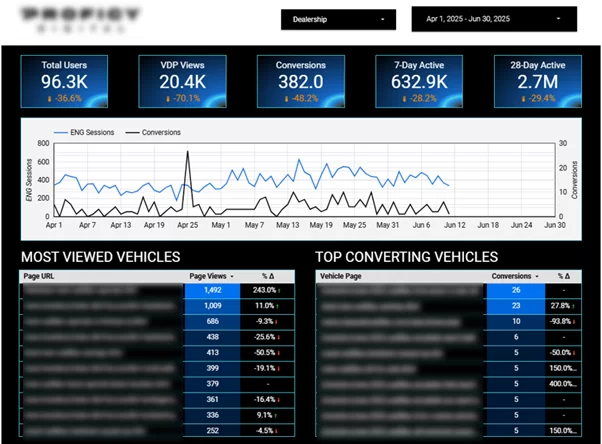
Business intelligence for automotive marketing teams helps dealerships and automotive businesses get a handle on how users interact with their website and what drives conversions. These dashboards are used by marketing managers and digital teams to optimise campaigns, improve targeting, and boost lead generation.
In this project, our marketing analytics consultants built a dashboard focused on three key areas of website performance. The dashboard tracks how many users look at Vehicle Detail Pages (VDPs) to see which cars are getting the most interest, with breakdowns by new versus used vehicles and specific segments like electric cars. It also looks at service page views to measure demand for after-sales services, alongside conversion metrics like form submissions, calls, and direction requests. Conversions are further broken down by page type, such as spare parts, financing, and vehicle categories.
This structure helps teams get a better handle on both demand and intent across the customer journey. Marketers can identify which vehicles and services are generating the most interest, spot where users drop off along the way, and focus on high-performing areas. The conversion breakdown also supports targeted remarketing, letting teams re-engage users based on the specific products or services they showed interest in.
Many automotive organisations are now shifting their analytics from old on-site systems to cloud-based platforms like Power BI or Tableau. The traditional approach has always had its limitations, such as struggling to scale during peak reporting periods, dealing with the hassle of replacing hardware every few years, and grappling with integrating data from all around the world.
Cloud-based BI has a big number of advantages: it can scale up or down as needed, makes it much easier to link up with connected car and IoT systems, and lets people work remotely from anywhere in the world. But when it comes to data storage, EU operations need to be careful about complying with GDPR (that’s the General Data Protection Regulation), getting the right certifications, and making sure everything is secure.
| Factor | On-Premise | Cloud |
| Scalability | Limited, hardware-dependent | Elastic, on-demand |
| Integration | Complex for modern sources | Pre-built connectors |
| Cost Model | Capital expenditure | Subscription-based |
| Global Access | Requires infrastructure | Built-in |
| Compliance | Direct control | Requires vendor certification |
Getting a BI project up and running in 2026 requires a solid game plan. Whether you’re a car maker, a supplier or a dealer group, these steps are what you need to follow.
BI projects absolutely need to align with the company’s overall goals – whether that’s changing over to electric vehicles, cutting costs, or making sure customers are happy. Before you start, figure out what questions you most want to answer – like ‘Which plants are losing the most money per unit?’ or ‘Where are we losing out in the SUV market?’
Set up a data governance council that includes people from IT, manufacturing, supply chain, sales, finance, and compliance. Get everything down on paper: who owns what data, how do we keep it in good nick, and how do we let people access it from day one.
Just about every automotive BI project fails because it starts with a poor data foundation, not because the dashboard isn’t good enough. Identify and list all the important data sources you’re working with – that’s your old mainframes, Excel spreadsheets, dealer systems, and all the IoT stuff.
Choose an ETL/ELT tool and design a data warehouse that can grow with your business. Do some quality control checks to make sure everything is up to scratch – that’s checking VIN numbers are correct, dealer IDs are consistent, and there are no duplicate customer records. You should start with just one or two areas before taking it on a larger scale.
Get some role-based business intelligence dashboards up and running for plant managers, supply chain planners, car dealers and executives. Do it iteratively – build a prototype, get some feedback, refine it.
Get your power users set up with some self-service analytics and sort out some training for them. Change management is a thing – get some stories of quick wins and successes up in lights to keep the project on track.
Leaders expect some serious returns from BI investments. Tie your initiatives to some clear KPIs – cut inventory days, get more vehicles through the factory in a given time, increase revenue per vehicle.
Make some before-and-after comparisons to see the impact – Q1 2024 compared to Q1 2025, for example. Track the softer benefits too – decision making’s faster, fewer reports need to be done manually, people are working better together in the plants and with the dealers.
Get a continuous improvement loop going where the insights from looking at the data drive process changes, which then get monitored using the same tools. That’s how you build up value over time.
The dashboards we’ve talked about in this article are just the start of what business intelligence can do for car companies. Whether you’re looking to get some visibility on how your dealers are doing, your supply chain’s running, what your customers are doing, or your marketing’s working, the same rules apply to building a solution that’s just right for you.
If you’ve got a use case in mind – or you’re still exploring how business intelligence could work in your organisation – get in touch with Vidi Corp and we’ll work with you to get the right solution in place.
If you get your pilot projects right, like a dashboard for dealers or optimising parts inventory – you should be seeing some real results within 3-6 months. A big enterprise rollout across manufacturing, supply chain and customer analytics takes longer – 18-24 months. Pick one or two high-impact use cases to get some momentum going.
You need data engineers, BI developers, data scientists and people with domain expertise from manufacturing, supply chain, sales and finance. There are now also analytics translators who help get the technical teams and operational teams working together. Cloud platforms don’t need as much deep coding, allowing business users to explore the data themselves.
Cloud-based platforms are on a subscription model, so supplier groups or smaller companies can start with a limited number of users and build up. Leverage your existing data from DMS, accounting systems and spreadsheets before investing in a big data warehouse. Industry-focused consultants can help avoid all that overhead.
BI platforms link in with your core systems, rather than replace them. Data goes in on a schedule or in real-time, then gets standardised for analysis without disrupting the day-to-day business. Make sure your solution supports links with all the major automotive and manufacturing platforms.
Common issues people run into include underestimating data-quality problems, getting fixated on ‘oh look at my fancy dashboard ‘ instead of actually asking what business problems you’re trying to solve, and not having someone in a senior position who’s actually invested in the project. And then there’s the thing about ignoring data governance – especially when it comes to things like customer and vehicle info – that really does create the potential for some serious compliance and reputational issues. So what should you do? Start small, get the people who are actually going to be using your analytics on board right from the start, and make sure it’s crystal clear who is responsible for delivering on the promises you make with your analytics.
![]()
![]()
![]()