
Real estate investor reporting is the process of collecting, analysing, and presenting data that shows how a property portfolio or real estate business is performing. These reports provide investors with a clear view of financial performance, asset profitability, and market conditions so they can evaluate whether their investments are generating the expected returns.
As a business intelligence consulting company, we have developed 1,000+ reporting solutions for real estate investors, property managers, and real estate agencies that need visibility into portfolio performance. These dashboards integrate data from accounting systems, property management tools, and CRM platforms to create structured investor reports that are easier to analyse and share with stakeholders.
This article explains what real estate investor reporting is, why it is important for portfolio management, and how investors use structured dashboards to monitor financial performance, analyse market conditions, and support investment decisions. It also covers practical reporting examples, key reporting components, common challenges, best practices, and the tools used to build modern real estate investor reporting systems.
Real estate investor reporting is the process of collecting, analysing, and presenting data that shows how a real estate portfolio or property business is performing. These reports give investors clear visibility into financial performance, asset profitability, market conditions, and operational activity.
Modern real estate investor reporting typically relies on automated dashboards that combine data from property management systems, accounting tools, CRM platforms, and market data sources. This allows investors and management teams to monitor portfolio performance in near real time and make faster, data-driven decisions about pricing, financing, acquisitions, and portfolio growth.
The purpose of a real estate investor report is to help investors evaluate how well their properties and portfolio are performing. These reports summarise key financial and operational metrics so investors can quickly assess whether their investments are generating the expected returns.
Investor reports typically highlight metrics such as rental income, operating costs, net operating income (NOI), cash flow, and occupancy levels. By reviewing these indicators regularly, investors can identify underperforming properties, detect cost increases, and monitor changes in portfolio profitability.
Another important purpose of investor reporting is to support strategic decisions. With structured reports and dashboards, investors can determine when to adjust pricing, refinance debt, invest in property improvements, or acquire new assets. This allows them to manage risk more effectively and optimise long-term portfolio performance.
Real estate investor reporting combines multiple types of analysis to give investors a complete view of how their portfolio and business operations are performing. Successful real estate companies rely on structured reporting to monitor property profitability, financial stability, market conditions, and the effectiveness of their sales and marketing activities.
The following examples show how real estate investor reporting can be implemented through data dashboards. These reports help investors and real estate agencies monitor performance, identify risks and opportunities, and make more informed decisions about pricing, investments, and portfolio growth.
Property performance analysis is a core part of real estate investor reporting. Investors need clear visibility into how each property contributes to portfolio profitability, including rental income, operating costs, and overall margins.
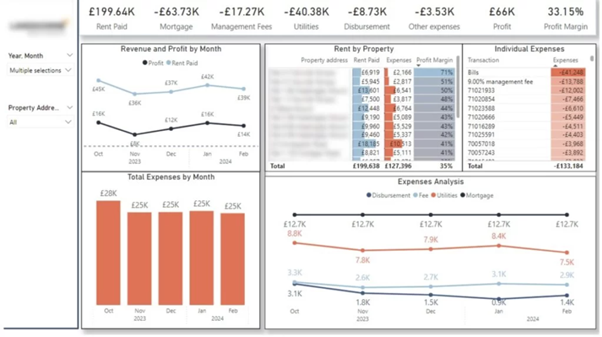
Our data analysts developed this real estate investor report to help a client evaluate the financial performance of their portfolio. The dashboard analyses profit margin by property, making it easy to identify the most profitable assets. It also tracks operating expenses by month, allowing investors to quickly detect unusual cost spikes and identify the specific expense categories driving them.
The report also includes filters that allow investors to focus on a single property and review monthly rent and expense trends. This helps identify vacancy periods, monitor unexpected costs, and plan future budgets more accurately.
One of the key benefits of this type of real estate investor reporting is faster and more reliable decision-making. By consolidating financial data into automated dashboards, investors can quickly detect cost overruns, identify underperforming properties, and optimise portfolio performance.
Financial reporting forms the foundation of commercial real estate investor reporting because it provides a clear view of a portfolio’s financial health and profitability. Investors rely on structured financial reports to monitor income, operating costs, debt levels, and cash availability across their properties.
The following dashboards demonstrate how financial reporting can be implemented in commercial real estate investor reporting. They provide detailed insights into portfolio profitability, financial stability, and cash flow management, helping investors make informed decisions about budgeting, financing, and long-term portfolio growth.
Profit and loss reporting plays a central role in real estate investor reporting because it shows how profitable a property or portfolio truly is. Investors rely on this analysis to track income, operating costs, and key profitability metrics such as Net Operating Income (NOI).
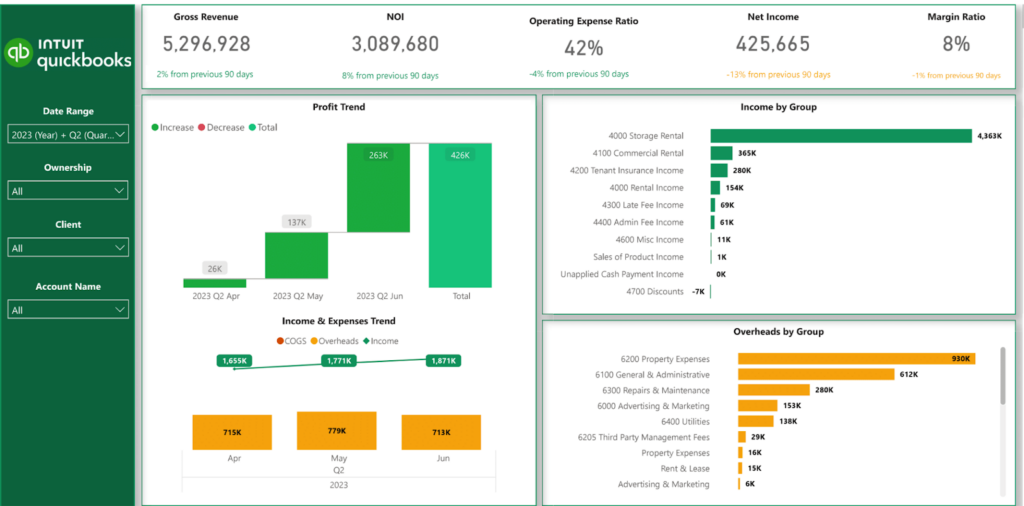
Our Power BI specialists built this free Profit and Loss template to help a client monitor financial performance across their properties. The report displays monthly trends for income, overheads, and net income, providing a clear picture of how profitability evolves over time. Income and expenses are also broken down by account and supporting transactions, helping investors understand exactly where revenue is generated and where costs occur.
The dashboard allows users to switch between accrual and cash accounting methods and apply filters for different clients. Additional filters by class enable more detailed financial analysis across different segments of the portfolio.
One of the main advantages of this dashboard is stronger financial control. By bringing income, costs, and profitability metrics into a single dashboard, investors can recognise trends earlier, identify inefficiencies, and make better decisions about budgeting, cost management, and portfolio growth.
Balance sheet analysis is an important part of real estate investor reporting because property investments are often financed through loans and mortgages. Investors and real estate managers use balance sheet reports to monitor the relationship between assets and liabilities and evaluate whether the business has sufficient resources to meet its financial obligations.
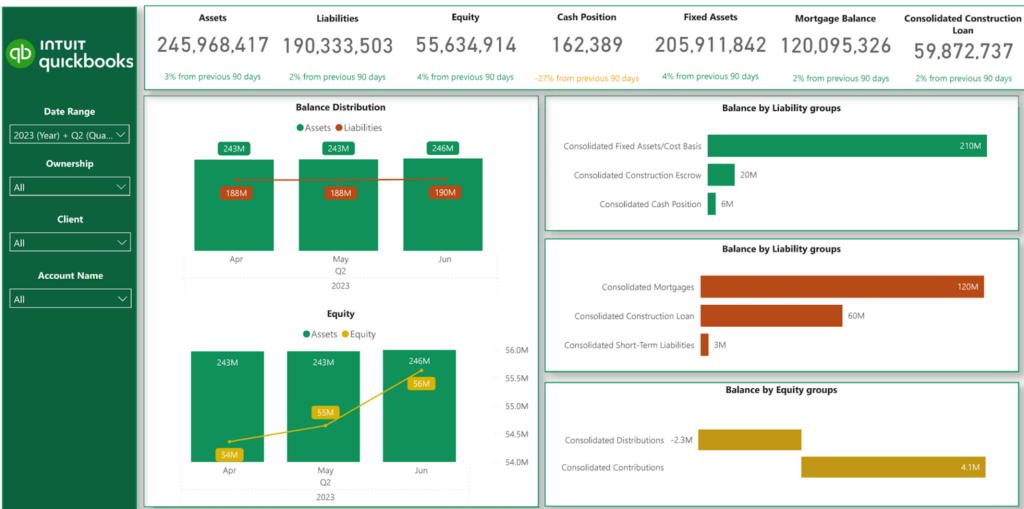
Our data visualization experts developed a free Balance Sheet template to help a client analyse the financial position of their company. The report visualises trends for assets, liabilities, and equity over time, providing a clear overview of financial stability. Each category is further broken down by account groups and individual transactions, allowing investors to understand what drives changes in the balance sheet.
The dashboard also provides a detailed view of the company’s liabilities portfolio by grouping different types of debt. This makes it easier to compare assets against liabilities and assess the company’s ability to repay loans and maintain a healthy financial structure.
Similar to the other financial reports, users can switch between accrual and cash accounting methods. The dashboard also includes filters by date, class, and client, enabling investors to analyse the balance sheet from multiple perspectives and maintain accurate investor reporting.
Cash flow analysis is an essential element of real estate investor reporting because investors must closely monitor how much cash their properties generate and where it is being spent. Even profitable portfolios can face financial pressure if cash inflows and outflows are not managed properly.
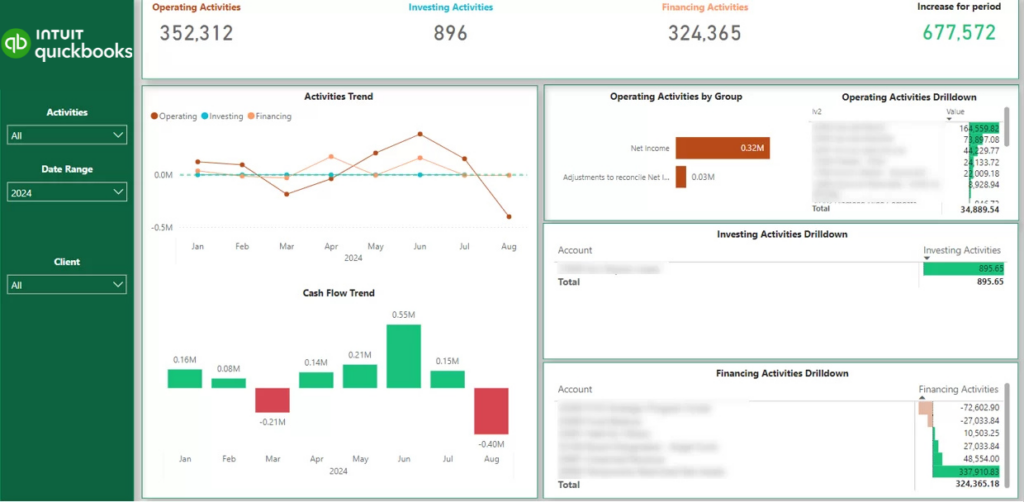
Our free Cash Flow template helps clients track changes in their cash reserves over time. The dashboard shows the total increase or decrease in cash during the selected period and visualises month-over-month trends. This allows investors to quickly understand whether their portfolio is generating positive cash flow or consuming capital.
The report breaks down cash movements into three main categories: operating, investing, and financing activities, following the same structure used in accounting systems such as QuickBooks Online. Each activity category is further divided into the underlying accounts, allowing investors to see exactly which transactions contribute to cash inflows and outflows.
This dashboard helps investors to gain a clear view of how cash moves through their real estate portfolio. This dashboard helps improve liquidity planning, ensures sufficient cash reserves for property operations, and supports better financial decision-making.
Market analysis reporting helps real estate investors understand how local market conditions affect property values, demand, and transaction timing. Since real estate markets can vary significantly between neighbourhoods and property types, investors need reliable data to evaluate opportunities and position their assets competitively.
The following dashboards illustrate different types of market analysis reporting used by real estate investors and agencies. They provide detailed insights into location-level pricing trends, market supply and demand, and listing price reductions to support more informed investment and pricing decisions.
Location analysis is an important element of real estate investor reporting because property prices and demand often vary significantly between neighbourhoods. Investors and real estate agencies need location-level insights to understand market conditions and make informed investment and pricing decisions.
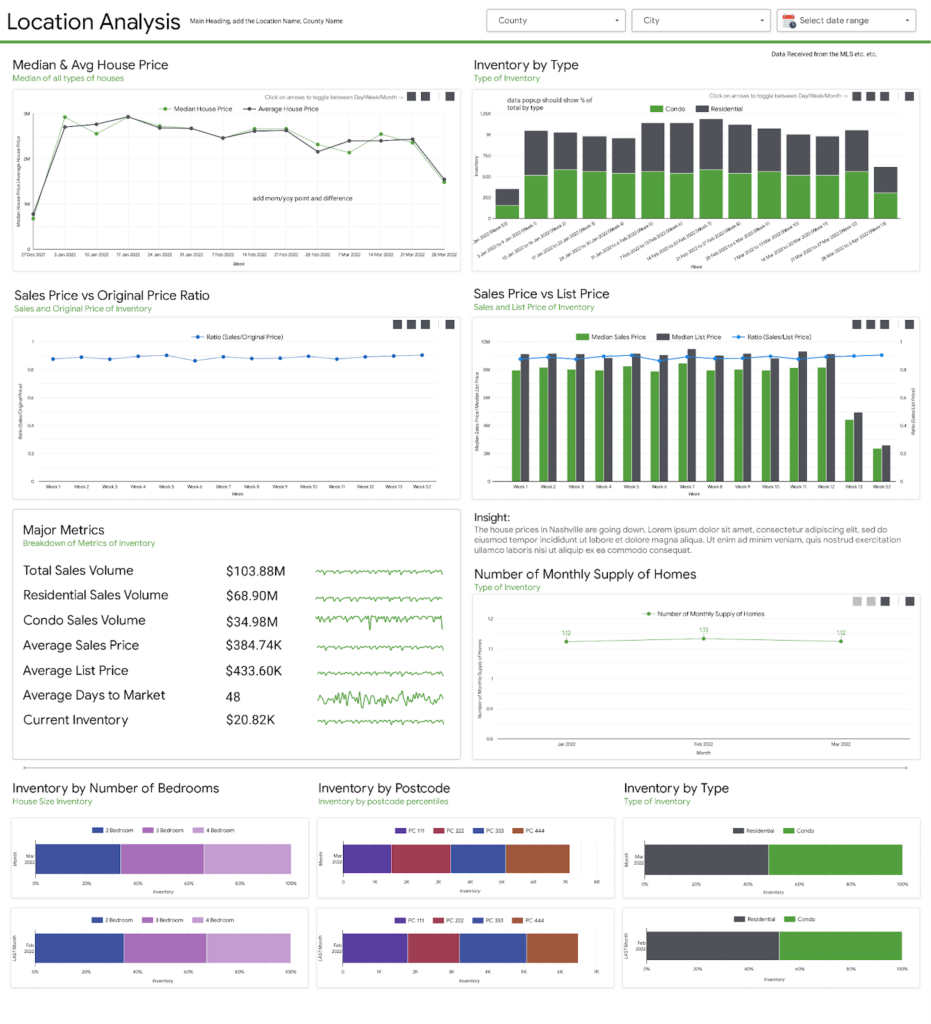
Our data visualization experts built a Location Analysis dashboard that analyses average property prices by home type and location, allowing users to compare different neighbourhoods and identify areas with higher or lower market values. It also tracks local market activity to estimate the typical time required to buy or sell properties in each area.
The dashboard enables agents and investors to benchmark individual properties against local market averages and assess demand patterns across different locations. This makes it easier to determine competitive pricing and identify areas where properties are likely to sell faster.
One of the key benefits of this dashboard is more accurate market positioning. With clear insights into pricing trends and demand by location, investors can make stronger offer decisions, set realistic expectations for clients, and improve the timing of property transactions.
Monitoring supply and demand trends is a key part of real estate investor reporting because market conditions directly influence pricing strategies and transaction timing. Investors and agents need to understand how quickly properties move through the market in order to evaluate whether conditions favour buyers or sellers.
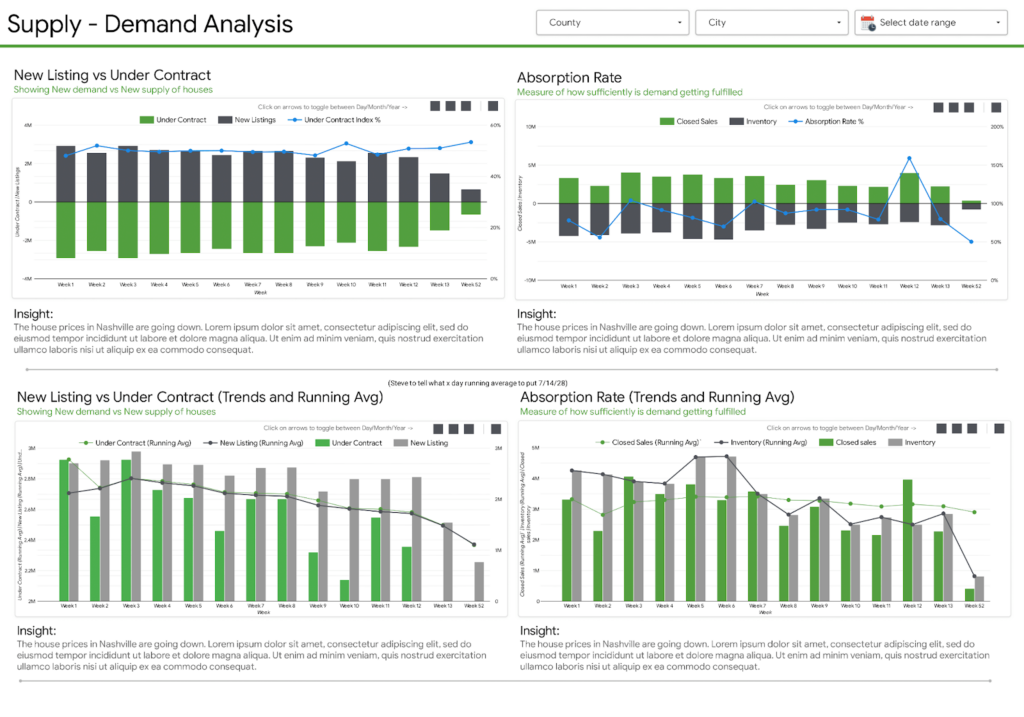
Our data analysts developed this real estate investor dashboard to help clients analyse market activity across different areas. The report tracks new listings, properties under contract, and the total number of available homes in the market. By monitoring how many homes are entering and leaving the market, investors can better understand how quickly market conditions are changing within each location.
The dashboard also calculates the absorption rate by comparing the number of monthly home sales with the total number of active listings. This metric helps identify the balance between supply and demand.
This analysis helps agents and investors to gain a clearer understanding of market dynamics. These insights help refine pricing strategies, determine the optimal timing for listing properties, and support stronger negotiation decisions in competitive markets.
Pricing trends are an important element of real estate investor reporting because frequent price reductions often indicate shifts in market demand. Investors and agents need to understand when and why properties require discounts in order to adjust pricing strategies and avoid long listing periods.
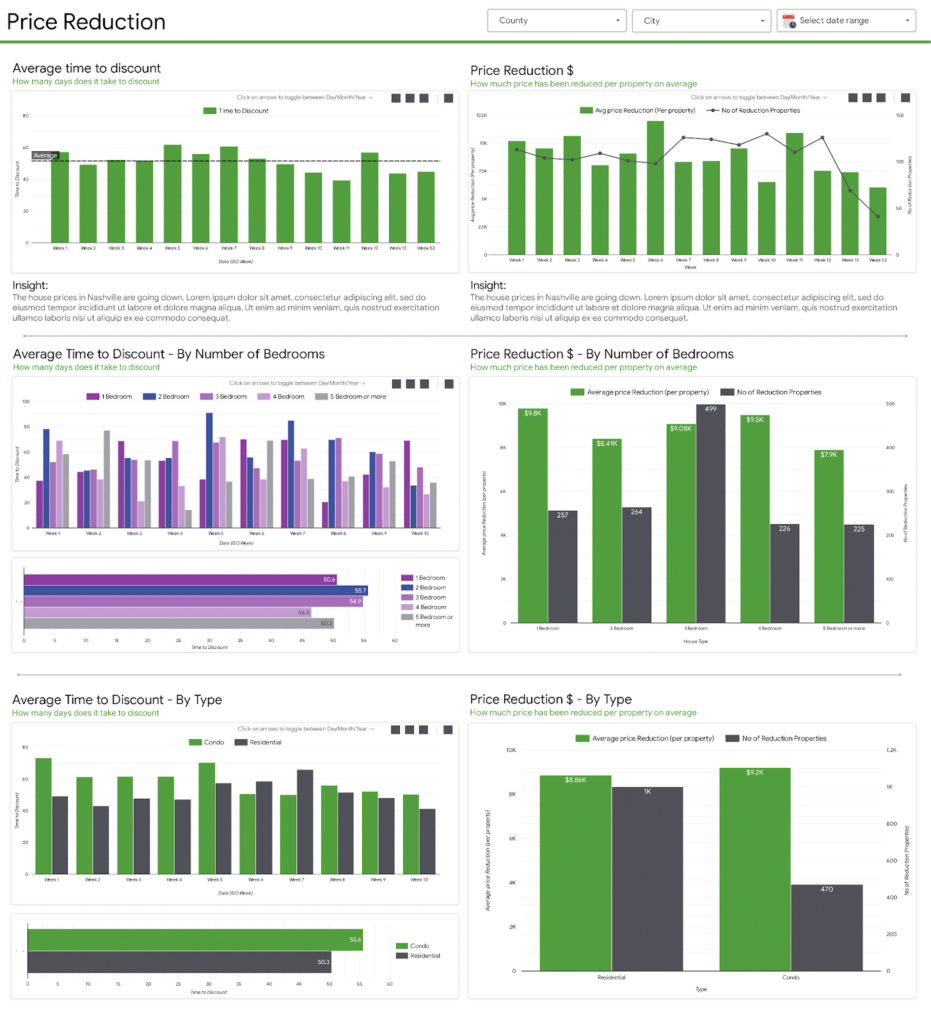
Our team developed this real estate investor dashboard to analyse listing price reductions across the market. The report measures the average time it takes for a property to receive its first price discount, the typical size of those reductions, and which property types experience discounts most frequently.
The dashboard helps investors identify markets where buyers have stronger negotiating power and where properties tend to stay listed longer before price adjustments occur. By analysing these patterns, investors gain a clearer understanding of pricing pressure within different segments of the market.
Including this analysis in real estate investor reporting allows investors and agents to set more competitive listing prices from the beginning. It also helps avoid prolonged time on market and supports more informed negotiations based on current market conditions.
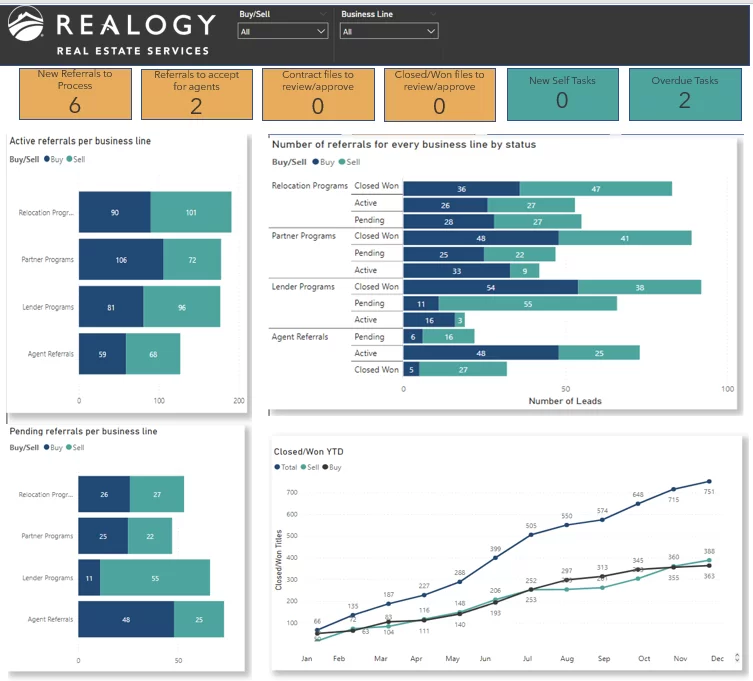
Sales performance reporting is an important component of real estate investor reporting because the productivity of sales teams directly affects deal flow, revenue generation, and portfolio growth. Investors and agency leadership need clear visibility into how effectively agents convert leads, manage referrals, and move opportunities through the sales pipeline.
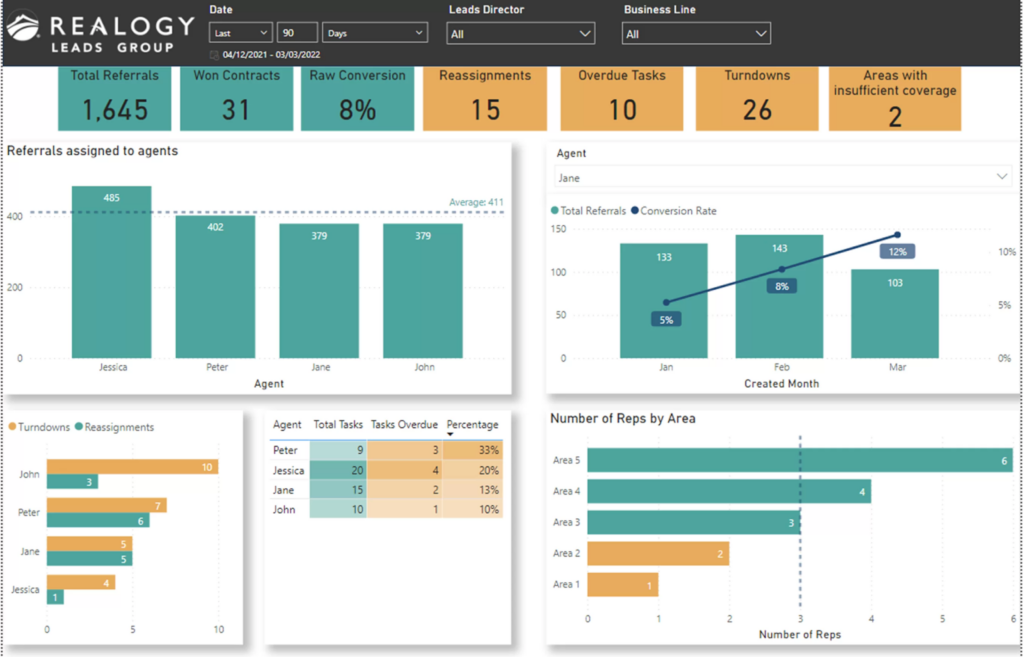
Our Power BI experts developed an Agent Performance Dashboard to give managers a structured view of sales team activity. The dashboard consolidates key metrics such as total received referrals, referral conversion rates, completed tasks, and overall agent workload. By bringing these metrics into a single report, managers can quickly evaluate how effectively agents turn opportunities into completed transactions.
The analysis provides a comparable view of performance across teams and individual agents. By visualising referral activity and task progress, the dashboard highlights bottlenecks in referral assignment, gaps in follow-up, and uneven workload distribution that can negatively impact conversion rates.
As part of real estate investor reporting, this dashboard helps leadership optimise referral allocation, improve task discipline, and coach agents using real performance data. This leads to higher productivity, stronger conversion rates, and more predictable sales outcomes across the agency.
Marketing performance reporting is an important part of real estate investor reporting because the effectiveness of marketing channels directly influences deal flow and revenue generation. Investors and agency leadership need to understand which marketing sources generate qualified opportunities and which channels fail to convert leads into transactions.
Our data analysts developed a Lead Source Performance Dashboard to help a real estate agency evaluate the effectiveness of their marketing channels. The dashboard analyses the number of active, pending, and closed deals generated by each lead source. This allows managers to clearly distinguish between channels that generate large volumes of leads and those that consistently produce completed transactions.
By tracking how deals move through the sales pipeline, the dashboard highlights which lead sources bring high-quality opportunities and which tend to stall in early stages. This provides agencies with a more reliable view of marketing performance than simply analysing lead volume.
As part of real estate investor reporting, this analysis helps agencies and investors understand how marketing activities translate into deals and revenue. With better visibility into pipeline quality and deal conversions, leadership can allocate marketing budgets more effectively and forecast future transactions with greater confidence.
Effective real estate investor reporting brings together several types of analysis to give investors a complete picture of portfolio performance. Instead of focusing on a single metric, these reports combine financial, asset-level, market, and operational insights to support informed investment decisions.
Financial performance metrics are the foundation of investor reporting. These typically include profit and loss analysis, balance sheet metrics, and cash flow reporting. Together, these reports help investors understand profitability, debt exposure, and liquidity across their portfolio.
Asset performance analysis focuses on how individual properties contribute to overall returns. Investors often review metrics such as rental income, operating expenses, profit margins, and vacancy trends. Property-level analysis helps identify the most profitable assets and detect properties that require operational improvements.
Market analysis insights provide context for investment decisions. These reports analyse local pricing trends, supply and demand dynamics, listing activity, and price reductions. Understanding market conditions helps investors price properties accurately and evaluate new investment opportunities.
Operational performance metrics are also important for agencies and investment firms managing large portfolios. These reports track sales performance, lead generation, and marketing effectiveness to understand how internal operations contribute to revenue and deal flow.
Together, these components create a comprehensive real estate investor reporting framework that helps investors monitor performance, manage risk, and optimise portfolio growth.
Real estate investor reporting helps investment firms and property managers present portfolio performance clearly to investors, partners, and internal stakeholders. By organising financial, operational, and market data into structured reports and dashboards, companies can communicate performance metrics in a consistent and transparent way.
Investor reporting consolidates property data, financial statements, and market insights into a single reporting environment. This allows investment managers to prepare investor updates, management reports, and performance presentations using one reliable data source.
Modern real estate investor reporting tools automate the preparation of investor reports by pulling data directly from accounting systems, property management software, and CRM platforms. Reports can be generated from standard templates and distributed to investors automatically, reducing manual work and improving reporting efficiency.
Clear and structured reporting improves communication with investors. Many real estate companies now provide dashboards or investor portals where stakeholders can review portfolio performance, financial metrics, and property updates whenever needed.
Standardised reporting templates ensure that investors receive regular updates in a consistent format. This makes it easier to present key metrics such as income, cash flow, occupancy, and property valuations while maintaining a professional and structured reporting process.
By integrating investor reporting systems with accounting and operational data sources, companies can ensure that every report reflects the latest portfolio information. This significantly shortens reporting cycles and allows investment managers to present up-to-date performance insights during investor meetings and portfolio reviews.
Real estate investor reporting can be difficult to manage because data is often spread across multiple systems. Financial data may come from accounting platforms, property performance metrics from property management systems, and sales or marketing data from CRM tools. Combining these different sources into a single investor report requires significant effort and can create inconsistencies if the data is not properly integrated.
Another common challenge is the reliance on manual reporting processes. Many real estate firms still export data into spreadsheets and build investor reports manually. This approach takes time, especially when reports need to be updated frequently or prepared for multiple investors. Manual processes also increase the risk of errors when data is copied between systems or calculations are performed outside of automated reporting tools.
Maintaining accuracy and consistency across reports is also a key challenge. Investor reports must present reliable financial and operational information, but inconsistencies can occur when different teams prepare reports using different data sources or reporting formats. Investors expect regular updates with consistent metrics and comparable results across reporting periods.
Finally, real estate investor reporting must present complex portfolio data in a way that investors can easily understand. Property portfolios generate large amounts of financial, operational, and market data. Transforming this information into clear dashboards and structured reports requires thoughtful data modelling and visualisation to ensure that key insights are communicated effectively.
Effective real estate investor reporting requires more than just collecting data. Investment firms need structured processes that ensure reports are accurate, consistent, and easy for investors to understand. Following a few reporting best practices can significantly improve how portfolio performance is communicated.
Real estate firms often manage data across accounting platforms, property management systems, and CRM tools. Using a centralised reporting platform helps consolidate these data sources and ensures that investor reports are generated from a single, reliable dataset. This reduces manual data transfers and improves reporting accuracy.
Professional reporting templates help investment managers present information in a consistent format. Standardised templates ensure that each report includes the same key metrics, charts, and financial summaries, making it easier for investors to review performance across reporting periods.
Investor reports should be delivered on a predictable schedule, such as monthly, quarterly, or annually. A regular reporting cadence helps build trust with investors and ensures that stakeholders always have up-to-date information about portfolio performance.
Real estate portfolios generate large amounts of data, which can be difficult to interpret in raw form. Visual dashboards, charts, and structured reports make complex information easier to understand and help investors quickly identify trends, risks, and opportunities.
By applying these best practices, real estate firms can create more efficient reporting workflows while providing investors with clear and reliable insights into portfolio performance.
Real estate investment reporting software helps investors and property managers collect, analyse, and present portfolio data in a structured way. Instead of preparing reports manually from spreadsheets and multiple systems, modern tools automate reporting workflows and provide dashboards that clearly display portfolio performance.
Most reporting solutions connect directly with accounting systems, property management platforms, and CRM tools. By integrating these systems, investment managers can automatically consolidate financial data, operational metrics, and market insights into a single reporting environment.
Below are some commonly used tools together with the key capabilities they provide for real estate investor reporting.
Power BI is widely used for building custom real estate investor reporting dashboards. It allows firms to connect multiple data sources and create interactive reports that track portfolio performance, property profitability, and market trends.
Key features include:
Tableau is another business intelligence platform used to analyse and visualise real estate data. It helps investors explore complex datasets and identify trends in portfolio performance and market conditions.
Key features include:
Excel remains one of the most commonly used tools in real estate investment reporting, especially for financial modelling and detailed calculations.
Key features include:
QuickBooks is frequently used as the accounting system behind real estate investor reporting. Financial data from QuickBooks often feeds into dashboards and investor reports.
Key features include:
Salesforce is commonly used by real estate agencies and investment firms to manage deal pipelines and client relationships. Data from Salesforce can support operational reporting and sales performance analysis.
Key features include:
By combining business intelligence tools with accounting and operational systems, real estate firms can automate investor reporting, improve data accuracy, and present portfolio performance through clear and interactive dashboards.
Real estate investor reporting is evolving as investment firms adopt more advanced data and analytics technologies. Instead of relying on static spreadsheets or periodic reports, many organisations are moving toward interactive dashboards that allow investors to monitor portfolio performance in real time.
A major trend is system integration and automated reporting. Modern reporting platforms connect directly with accounting systems, property management software, and CRM tools. This integration allows financial and operational data to flow automatically into dashboards, reducing manual reporting work and ensuring that investors always see the most up-to-date information.
Another development is the growing use of advanced analytics and predictive insights. By analysing historical portfolio data and market trends, reporting tools can help investors forecast rental income, occupancy levels, and future property performance. These insights allow investment managers to anticipate risks and identify new opportunities earlier.
Artificial intelligence is also beginning to support reporting workflows. AI tools can help detect anomalies in financial data, highlight unusual performance trends, and automate data preparation for investor reports. As these technologies continue to evolve, real estate investor reporting will become more automated, transparent, and focused on forward-looking insights rather than only historical performance.
Real estate investor reporting helps investors and property managers understand how their portfolio is performing and where improvements are needed. By consolidating financial data, property-level performance, and market insights into structured reports or dashboards, investors gain a clearer view of profitability, cash flow, and long-term portfolio stability.
Modern reporting tools also make the process more efficient. Instead of manually preparing reports from multiple systems, data can be integrated and updated automatically, allowing investors to monitor portfolio performance in real time and respond more quickly to market changes.
If you are looking to improve how your portfolio performance is reported and analysed, contact us to discuss your requirements! Our team can help you integrate your data sources, design investor reporting dashboards, and build reporting systems that provide reliable insights for investors and stakeholders.
![]()
![]()
![]()