
Most companies start with business intelligence reports, hoping to automate their reporting. They migrate spreadsheet-based reports into BI tools, but many end up stuck with manual processes, just in a different interface. Business intelligence automation goes beyond visualisation by removing manual data extraction, transformation, and monitoring altogether.
As a top BI consultancy, we have delivered 1,000+ automated business intelligence solutions across marketing, finance, procurement, operations, and executive reporting. Our experience spans BI tools like Power BI and Looker Studio, data warehouses, APIs, and workflow automation, helping organisations scale analytics without scaling manual effort.
In this article, we break down where business intelligence automation delivers the most value, the practical steps to implement it, and real-life examples of how companies have used automated BI to save time, improve accuracy, and make faster decisions.
When we are planning a business intelligence automation project, we start by analysing what steps are done manually. Here is how we break them down:
Now that we know what steps to automate, we need to understand what exactly we need to do to automate these steps. Based on that we will know which tools to pick for our BI automation project.
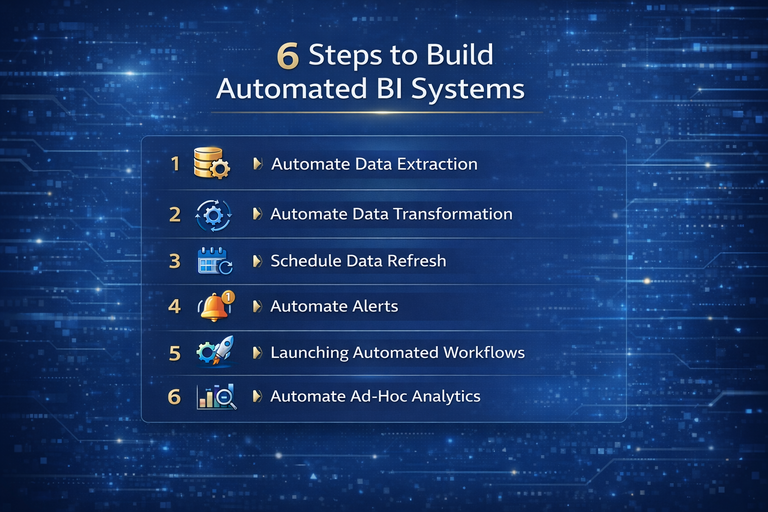
Automated business intelligence starts with automated data extraction. There are 5 options for automating data flow:
BI tools usually have a module for defining data transformation steps that will be performed automatically every time: Power BI has Power Query, Tableau has Tableau Prep, etc. These tools allow analysts to remove columns, fix data types, create calculated fields, and merge datasets through repeatable steps. Once set up, these steps run automatically whenever the data refreshes.
When working with a business intelligence data warehouse, data transformation is typically handled using SQL. SQL is used to filter rows, rename fields, join tables, and calculate KPIs at scale. Because this logic runs centrally in the warehouse, all BI reports use the same definitions and calculations.
Once data extraction and transformation are automated, the next step is keeping reports up to date. In tools like Power BI, you can schedule dataset refreshes to run automatically—daily, hourly, or based on business needs. This ensures dashboards always reflect the latest data without analysts needing to open reports or trigger refreshes manually.
Some BI tools go even further. Looker Studio refreshes data dynamically as users interact with reports, meaning queries are re-run every time a filter or date range is applied. This makes automation in business intelligence feel real-time and ensures stakeholders always work with the most current data when exploring insights.
Automated business intelligence is most valuable when insights are pushed to users instead of waiting to be discovered. Power BI includes built-in data alerts that can notify users when a KPI crosses a defined threshold, such as spend exceeding budget, revenue dropping below target, or productivity falling outside expected ranges. These alerts help teams react quickly without constantly monitoring dashboards.
For more advanced scenarios, Power Automate can be used alongside Power BI to trigger alerts and actions when data changes. Power Automate can send emails, Teams or Slack messages, create tasks, or launch follow-up workflows when a dataset refreshes or a metric meets specific conditions. This level of BI automation turns dashboards into proactive monitoring tools rather than passive reports.
Automation in business intelligence does not have to stop at alerts. Instead of only notifying users, dashboards can also trigger real actions. Power Apps can be embedded directly inside a Power BI report, allowing users to interact with data and launch Power Automate workflows with a single click.
This enables operational workflows to run straight from analytics. For example, we have built dashboards where finance teams can see submitted expenses, review individual entries, and approve or reject them directly within Power BI. Behind the scenes, a Power Automate workflow updates the finance system and notifies the relevant stakeholders, turning the dashboard from a reporting tool into an execution layer.
Modern BI tools now support AI-driven ad-hoc analysis. Tools like Copilot for Power BI in Microsoft Fabric allow dashboard users to ask questions in plain language. The AI then responds with a chart, table, or short text explanation, similar to ChatGPT, without the analyst building anything manually.
To make this work well, data must be prepared for AI. Tables and columns should be renamed clearly and descriptively so the AI can understand what the data represents. Ambiguous names or technical codes reduce accuracy and limit what the AI can answer.
You can also guide the AI by adding instructions. This includes telling it which tables to use for certain types of questions and providing example queries users are likely to ask. For common questions, you can even supply a SQL query that the AI should reuse. This approach turns BI reports into true self-service analytics tools and reduces repetitive ad-hoc requests to analysts.
The following examples are real automated business intelligence projects we have delivered for clients, showing how BI automation works in practice across different industries and use cases.
DS Smith is a large, publicly listed global manufacturer of corrugated packaging, operating across multiple regions with complex marketing and sales operations.
They needed to consolidate data from 6 Facebook Ads accounts, 7 Google Ads accounts, 14 LinkedIn Ads accounts, organic social channels, and their CRM system. Previously, this reporting relied on multiple legacy reports and extensive manual data consolidation.
We built a fully automated Power BI solution that extracted data from all sources automatically and blended it into a single interactive report. This business intelligence automation replaced three legacy reports and saved over 30 hours per month in manual data consolidation and report maintenance. It also eliminated common data inaccuracies caused by manual handling and gave senior directors a real-time, user-friendly view of marketing performance.
Mercy Corps is a large international non-profit humanitarian organisation operating globally and managing complex procurement activities across regions.
They relied on a Power BI report analysing procurement data from SAP Ariba, but the data refresh process was manual and time-consuming. The goal was to fully automate data extraction while preserving reporting accuracy.
We built an automated solution that extracts data from SAP Ariba using Python and loads it into an Azure SQL Server data warehouse. The existing Power BI report was rebuilt on top of this new automated data pipeline, with all figures matching the legacy report. This BI automation saves around 5 hours per month , allows more frequent report refreshes, and provides a scalable foundation for additional automations and Power BI reports in the future.
This client is a mid-sized digital marketing agency specialising in the fitness and healthcare industries, delivering PPC, SEO, and lead management services to a large portfolio of clients.
They needed to automate client reporting at scale and replace manual data extraction across advertising, analytics, and SEO platforms. We built Looker Studio dashboards for over 80 clients that automatically pull data from Facebook Ads, Google Ads, SEMrush, forms, GA4, and other sources. In parallel, we set up accurate GA4 tracking across their client base, including server-side tracking for selected accounts.
This automated business intelligence solution improved reporting accuracy by 40% and saved the agency around 50 hours per week in manual reporting work. Quarterly lead reporting, which previously took over 20 hours to compile, is now fully automated, allowing the team to focus on optimisation and client strategy instead of data preparation.
Neterra EOOD is a telecommunications solutions provider, operating at scale and managing complex financial and operational data across the business.
We worked with Neterra to build fully automated Power BI reports directly from their ERP system running on SQL Server, which contained tens of millions of rows. The reports had to be heavily optimised for performance and designed for use across all business units, including sales, marketing, procurement, operations, and finance. The analysis covered core financial and operational areas such as revenue, cash flow, and asset depreciation, and included a language toggle to switch all reports between English and Bulgarian.
The impact of this automated business intelligence solution was immediate. The reports helped identify a €50,000 cost-saving opportunity shortly after launch and uncovered new business opportunities generating €10–20K in monthly recurring revenue per year. The automation also replaced manual Excel reporting, saving the cost of a full-time business analyst, and the project was recognised nationally when it supported Neterra’s CFO winning the “Transformation of the Financial Function” award in Bulgaria.
Modern Cannabis is an agricultural manufacturing company operating multiple legal entities and managing complex financial data across them.
We worked with Modern Cannabis to integrate Power BI with QuickBooks Online using the Vidi QuickBooks Online connector, which automatically extracts financial data into an Azure SQL Server database. This setup allowed multiple QuickBooks companies to be consolidated into a single data warehouse, while still enabling reports to be filtered by individual entity. Power BI dashboards were then built on top of this database, providing real-time, user-friendly financial reporting that overcome the limitation of their current existing accounting system.
This automated business intelligence solution reduced the time spent compiling multi-entity financial reports by over 75%, eliminated manual data entry errors, and shortened the month-end close by several days.
Stewart’s Lawn Care is a local lawn care and pest control company operating in Utah, with a large field workforce and operationally complex daily reporting needs.
Their HR team was spending 15–16 hours per reporting cycle manually calculating technician productivity, efficiency, chemical usage, and revenue. We automated the data transformation logic and reporting in Power BI, standardising all calculations and refreshing them automatically. As a result, the same process now takes around 2 hours, freeing up significant time for performance analysis instead of manual calculations and ensuring consistent, reliable metrics across the business.
The most effective BI automation projects start by identifying where time is being lost and automating those steps first. With the right combination of BI tools, data warehouses, and workflows, reporting becomes a reliable system that runs in the background and scales as the business grows.
If you want to automate your business intelligence and eliminate manual reporting, contact us. We help teams design and implement BI automation that saves time, improves accuracy, and supports better decision-making across the organisation.
![]()
![]()
![]()