

Zoom


Azure SQL Server

Tableau
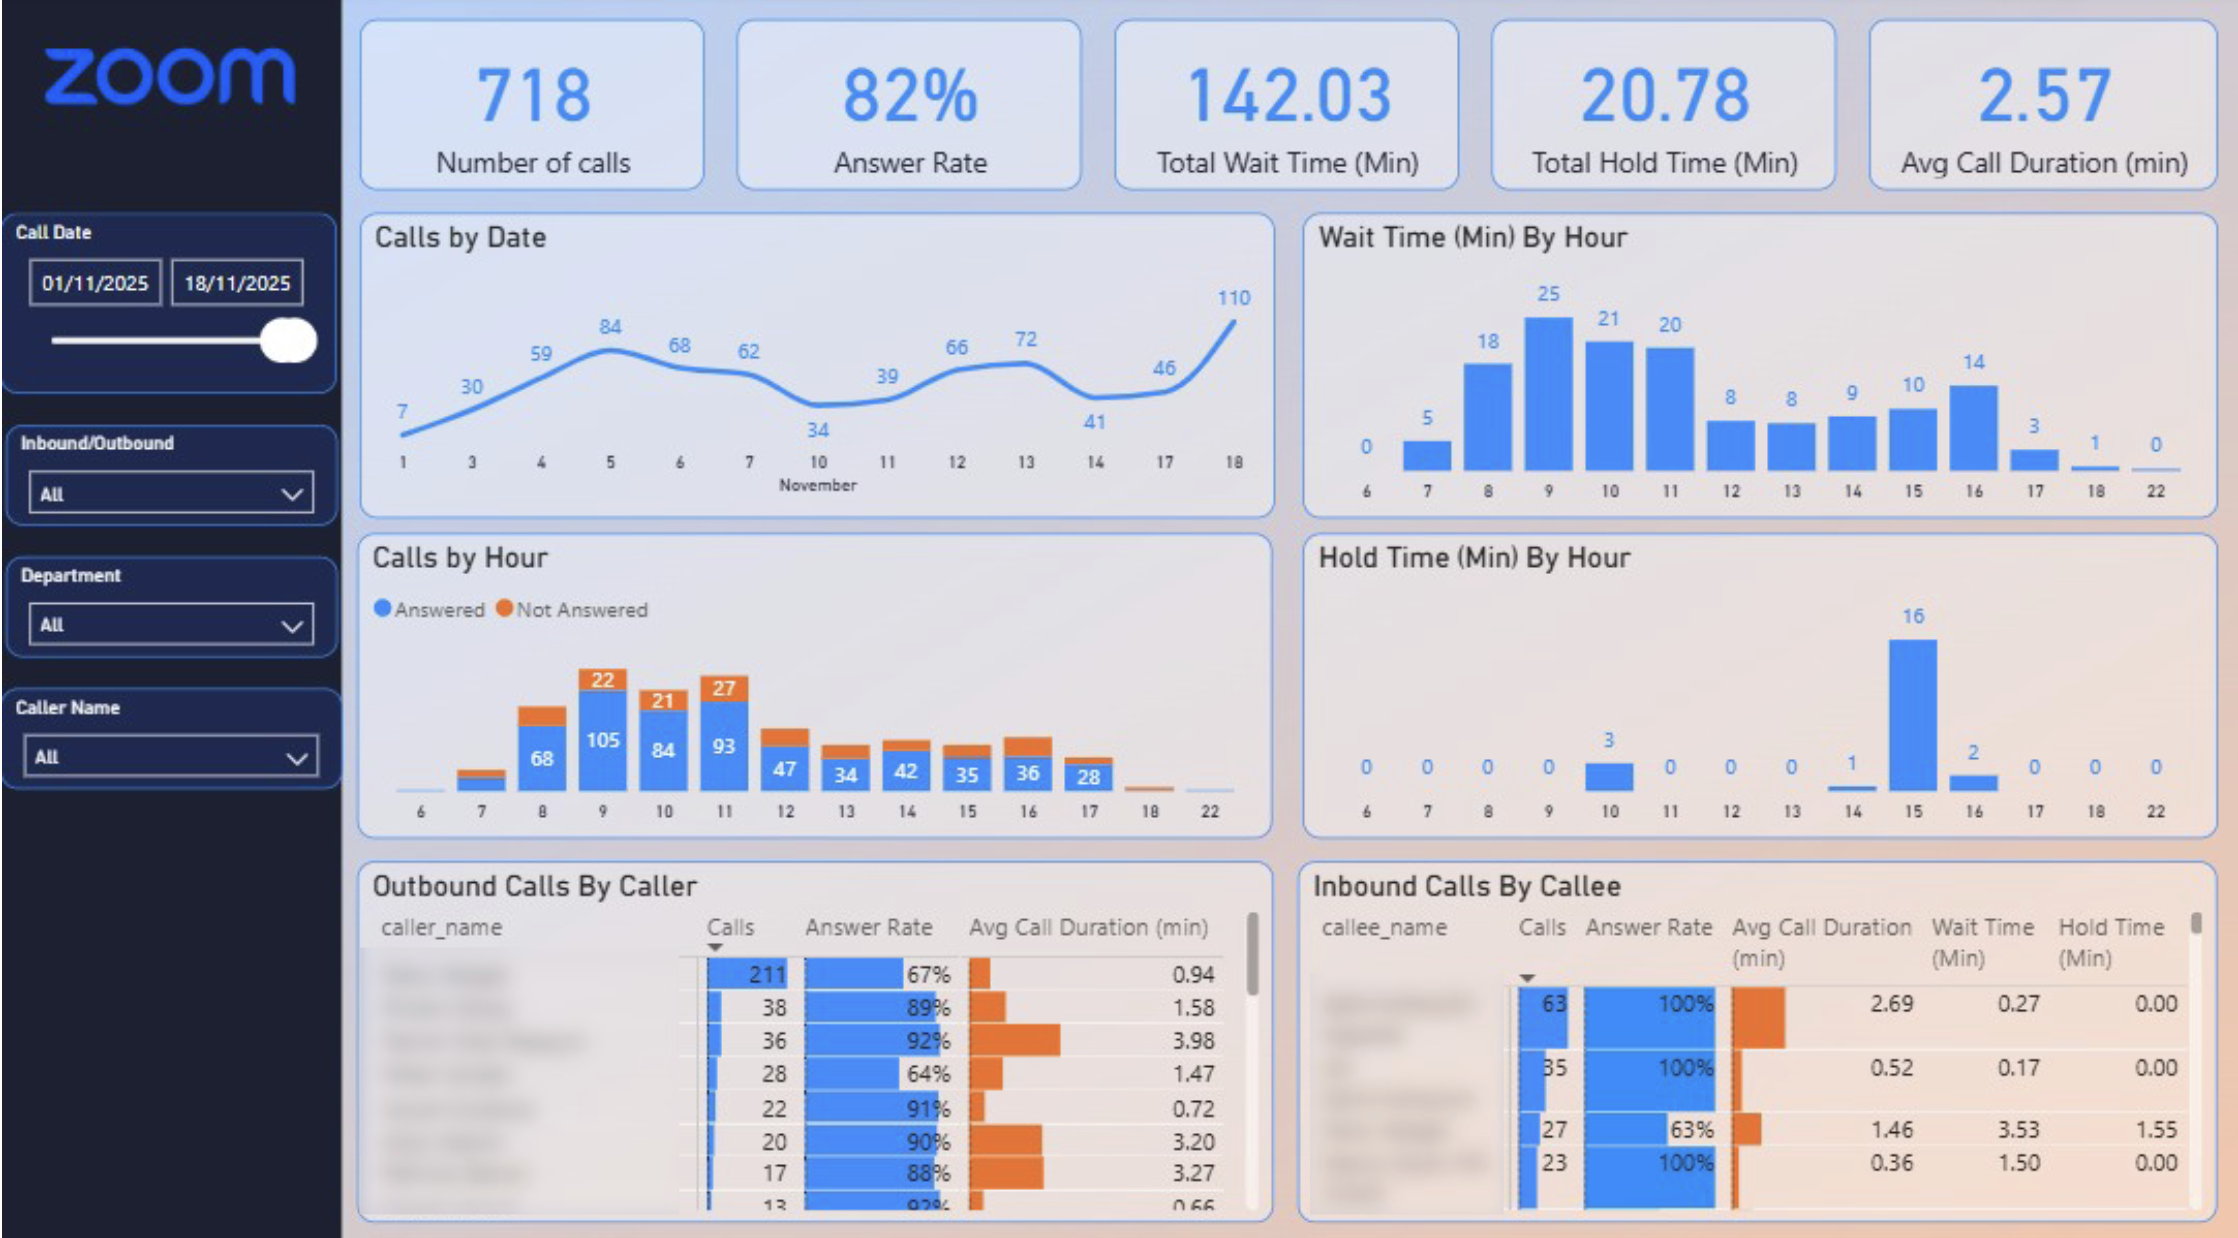
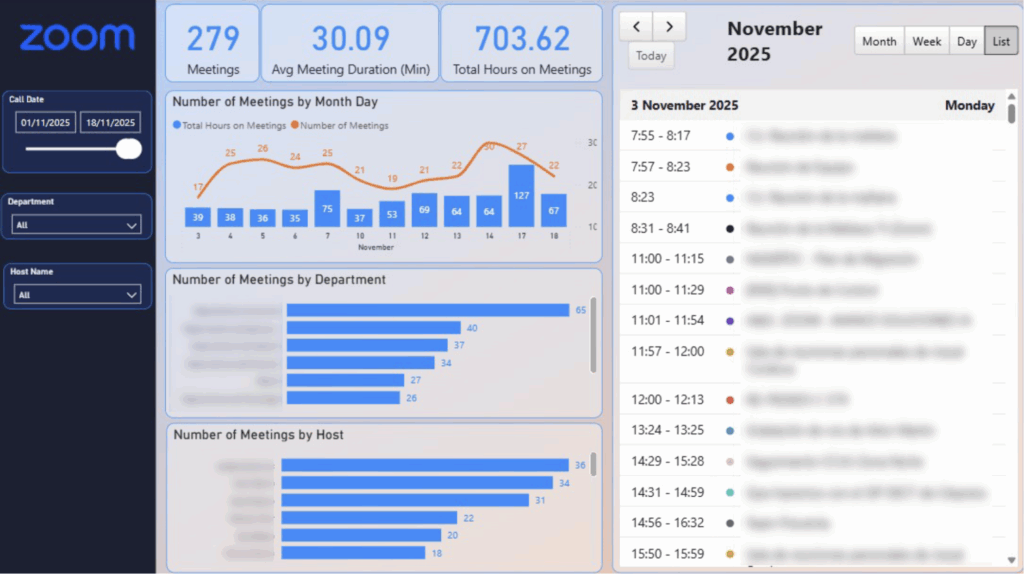
The Zoom Tableau connector enables you to analyse essential metrics, including Meeting Attendance, Participant Engagement, Session Duration and other data insights.
We developed the Zoom Tableau Connector to seamlessly integrate your Zoom data with Tableau. Visualise meeting analytics, participant engagement, session performance and more in real-time.
Utilise our Zoom Tableau Connector to extract valuable insights from your customer data, enabling you to make data-driven decisions that fuel business growth.
Learn more about our connector below:


Vidi Corp solution pulls data from Zoom, transforms it into easy-to-use tables, and stores it in databases like BigQuery or Azure SQL. From there, the data can be effortlessly connected to Power BI for reporting.

Install
Open our client portal, locate the Zoom connector, and click Install. We will set up the tables in the database you select.

Connect new company
Sign in to your Zoom account and select the accounts you want to connect.

Wait for the data to sync
We will then configure automated data refresh to ensure your Tableau reports update in real time.

Install our free Zoom Tableau template
Download our free Zoom Tableau template to begin visualizing your data in minutes.
Our Zoom Tableau connector simplifies data extraction and deliver information in a user-friendly format, saving you countless hours on data blending tasks. You will receive tables such as:
Additional customisations are available upon request.
You get a FREE dashboard when you purchase our connector
The template includes the following pages:
Old price of the dashboard – $3000
New price – free with the purchase of our connector.
$1400 per year

14 days free trial

Unlimited number of Zoom accounts

Unlimited Customer Support

Challenge

Digital Marketing Agency Measures Webinar ROI
A digital marketing agency was struggling to demonstrate the ROI of client webinars. They needed a way to track attendee behaviour, lead generation, and post-webinar conversions to prove the value of their services.
Solution

They used the Zoom Webinar Connector with Tableau to create detailed dashboards that visualized webinar performance and ROI metrics. This allowed them to provide clients data insights.

Challenge
Healthcare Provider Tracks Patient Education Webinars
A healthcare provider was hosting patient education webinars but had low participation rates. They needed to track attendance and feedback to improve content relevance and engagement.
Solution
They used our Zoom Connector with Tableau to analyse webinar performance and patient feedback. This allowed them to tailor their content to better meet patient needs.

Challenge
Nonprofit Organisations
A nonprofit organisation dedicated to environmental conservation was hosting a series of fundraising webinars to support their initiatives. However, they faced significant challenges in understanding attendee behaviour and optimising their fundraising strategies.
Solution
With our Zoom Connector, client was able to automate data collection and to create dashboards that visualise key metrics includng attendee demographics, engagement levels and donation patterns.
Great service and tools worked exactly as expected
Michael Khoury

The team at Vidi has been great to work with! Super responsive to my numerous questions, and even going so far as to help me learn and make small changeson my own.
Chris Ginsbach
Great group to work with, understood my needs and helped me design a solution that works
Michael Russell
![]()
![]()
![]()