Eugene Lebedev is a Power BI consultant by background. Before founding Vidi Corp in 2021 he created Power BI reporting for Autodesk. His Power Bi reports were used by VPs of Finance and C-suite of Autodesk. As part of Vidi Corp, Eugene created dashboards for Google, Teleperformance, Delta Airlines and 200+ clients worldwide.
In this article let’s speak about merge queries in Power BI. Understanding merge types is very important when merging two tables in Power BI. Depending on the merge type that you select, the output will be different. There are six types of joins available in Power BI:
The image above is often used to visualise what happens with tables during joins in Power BI. Before we discuss each join in detail, let’s discuss the terminology that is used in the join names.
To see how you can optimise your reporting with Power Bi, make an enquiry here.
As you see, there are 2 circles in every type of merge representing 2 tables. Because of this diagram, we speak of merge queries in Power BI as an operation between a Left and a Right table. This is how we are going to refer to our tables later on in this blog.
Left Join means that the Left table is more dominant during the merge e.g. after the join we will get all the records from the Left table and only some from the Right table.
Right join is the opposite. After the join we will get all the records from the Right table and only some from the Left table.
You might wonder what this means in terms of the Power Query interface. The merge menu in Power Query always shows you the Left table as the top table and the right table as the bottom table. In the screenshot below, the employee table is the Left table and the Sales table is the Right table
Inner join refers to the inner section between the 2 circles in the Venn diagram that you see above. This join looks for rows that have matching values in the 2 tables and only returns the results when there is a match in values. If there are rows for which the values don’t match, those rows won’t be included.
Outer join refers to the outer section of the circles. Unlike inner join, it does not filter out the rows that have no matching values. It keeps all the rows and simply returns null values for the rows that have no match.
Anti join is the opposite of the regular join. Instead of returning the rows that have matching values between the 2 tables, it returns only the rows that have no match. Now that we are familiar with the terminology let’s dive deeper into each join type.
The comment Power BI gives for Left Outer Join is “all from first and matching from second”.
This means it will return all the available rows from the Left table and matching rows from the Right table. This is the default type of join in Power query. If you are an Excel user, this functionality would be familiar to you since this is exactly what happens during a VLOOKUP.
Let’s use an example to understand this better. Assume we have two tables in Power BI:
We can join the 2 using an EmpID since this is a common column in both tables. When we select the 2 columns, Power BI will evaluate the number of matching rows. In this case 78 rows in the Sales table have an EmpID which can also be found in the Employee table.
After we click ok, we can get a new column from which we can expand other columns.
Select Columns from the employee table. Here we will select EmpName, EmpDesignation and EmpCountry. Those will now appear in the Sales dataset.
Now we have EmpName, EmpDesignation and EmpCountry in the Sales table. Since 78 out of 100 rows have a matching value, we get some values for them in the columns that we expanded. The 22 rows that have no matching values are still kept in the resulting table but they have null values in the columns that we expanded.
Power BI explains Right outer Join as “all from second, matching from first”.
This is exactly the opposite of Left Outer Join where it returns all the rows from the Right table and only matching rows from the Left table.
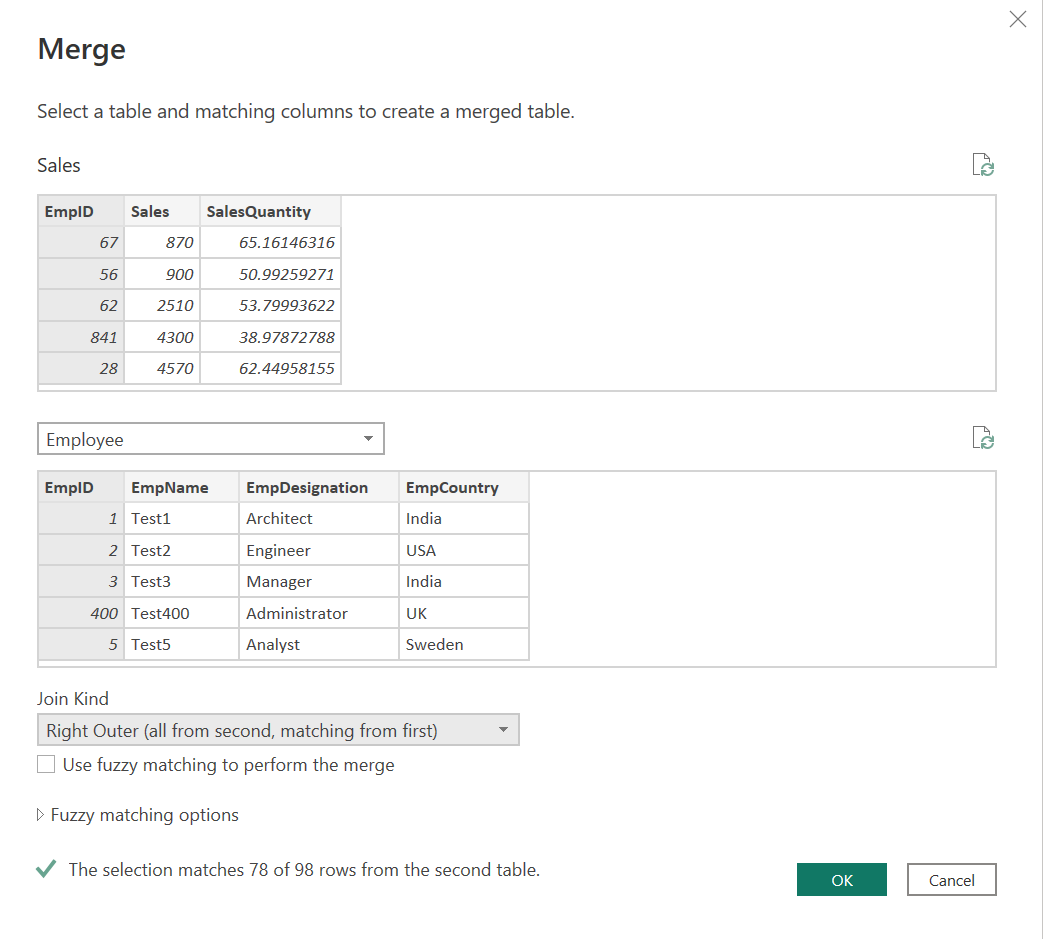
Let’s try to use this merge type on the same 2 tables. Merge Sales table (Left) to the Employee table (Right) on based on EmpId using Right outer Join:

First of all, the number of rows has increased to 98 since there are 98 rows in the Right table. Secondly, there are no blanks for the Right table but there are some blanks for the unmatched values in the Left table.
You can think of a full outer as a combination of Right Outer and Left Outer joins. Power BI explains Full Outer Join as “all rows from both”.
This join will return all the rows from both tables. It includes matching and non-matching rows. This means that the number of rows we are going to get after the join will increase.
As for the null values, we will get all the null values that were the output of a Right Outer join and the Left Outer join.
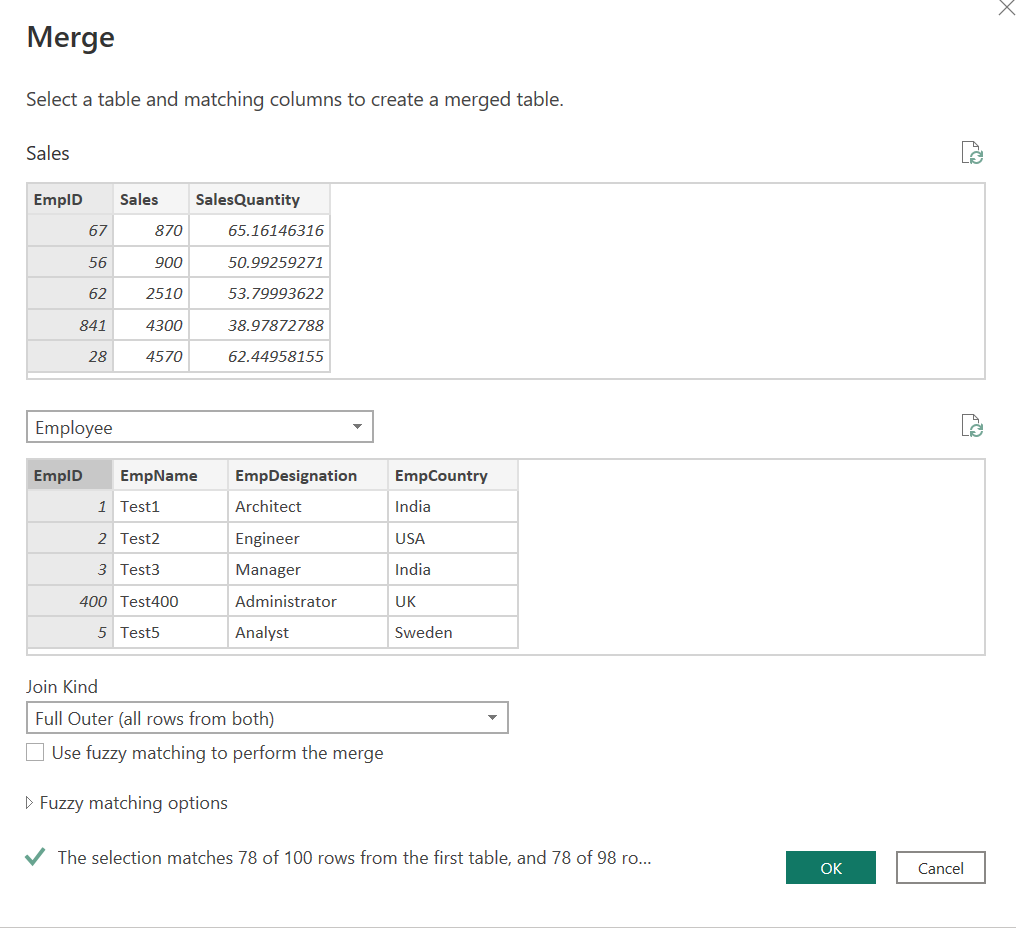
Merge Sales table (Left) to the Employee table (Right) on based on EmpId using full outer join as follows:

There are null values which are non-matching rows as the full outer join displays everything.
Unlike Outer join that returns all the rows, inner join automatically filters out the nulls. Imagine if you did a Full Outer Join and then filtered out all the resulting null values from all the columns. This is exactly the output you are going to get from the inner join.
Power BI explains Full Inner Join as “only matching rows ”.
This join is the opposite of outer joins and will return only matching rows between both tables. There will not be any null value record here because it returns matching rows only.
Merge Sales table (Left) to the Employee table (Right) on based on EmpId using Inner join as follows:
As you see, no record with null values can be found in the final table.
Power BI explains Left Anti Join as “Rows only in first”.
This join will return all the rows from the Left table which are not matching in the right table.
Merge Sales table (Left) to the Employee table (Right) on based on EmpId using left anti join as follows:
As per the above screenshot 78 of 100 rows match from the sales table so the remaining 22 rows will be returned by this join.
Power BI explains Right Anti Join as “Rows only in second”.
This join will return all the rows from the Right table which are not match in the Left table.
Merge Sales table (Left) to the Employee table (Right) based on EmpId using the full outer join as follows:
As per the above screenshot 78 of 98 rows match from the sales table so the remaining 20 rows will be returned by this join.
In addition to trying to match the values exactly using regular merge, there is an option to match those values if they are 50%, 70% or 90% similar to each other. Select the check box under the merge table dialog box to use fuzzy merge options.
We can configure other operations while using fuzzy matching like Similarity Threshold, Ignore Case, Match by combining text part and transformation table:
Let’s understand with an example. We have 2 tables as follows:
City Table
Population Table:
Let’s merge both the table using normal merge and using fuzzy matching options merge:
Normal merge Output:
Fuzzy Matching Output:
In the normal merge Power BI matched 2 records only and ignored Paris and New York as they are spelled as Pari and New york in the right table whereas Fuzzy matching did not ignore these records and returned 4 matching records.
I hope that you found this blog interesting and informative! Have fun merging the datasets!