
Real estate business intelligence is about turning everyday property data into insights that people can actually use. From property listings and transactions to agent activity, finances, and market trends, real estate businesses generate large amounts of information across multiple systems. Business intelligence brings this data together, organises it, and turns it into clear insights that teams can trust when making decisions. Instead of relying on spreadsheets or disconnected reports, commercial and residential organisations use BI to understand performance, improve pricing, manage risk, and plan growth with confidence.
As a BI consultancy, we’ve delivered 1000+ business intelligence solutions for real estate agencies, investors, and property managers. Our team has built dashboards for portfolios ranging from small residential holdings to enterprise organisations, including Fortune 100 companies, covering pricing, performance, financial reporting, and market analysis. These solutions are enabled by advanced technology, which drives industry modernization and enhances the value of business intelligence.
In this article, we explain what business intelligence means in a real estate context, break down its core components, and share real-world dashboard examples. We’ll also outline the practical benefits of using real estate business intelligence across operations, sales, and investment strategy.
Business Intelligence in real estate refers to the process of collecting, combining, and analysing data from across the business and the market to support better decision-making. It brings together information from property listings, transactions, financial systems, CRMs, and external market sources into a single, structured view.
Real estate business intelligence is used to monitor performance and understand what is happening across key areas such as pricing, supply and demand, agent activity, lead sources, profitability, and financial health. Instead of relying on static reports or manual spreadsheets, teams use dashboards that update automatically as new data becomes available.
By providing a clear view of both operational and market-level data, business intelligence delivers valuable insight that helps real estate companies identify trends, spot inefficiencies, compare performance, and evaluate opportunities. This enables agents, managers, investors, and executives to make decisions based on evidence rather than assumptions, whether they are setting prices, allocating budgets, or planning future growth. Executives, in particular, benefit from integrated analytics to make informed, strategic decisions that guide the direction of real estate operations and investments.
Real estate business intelligence is built on a small set of core components that work together to turn raw data into usable reporting. Each component plays a specific role, from collecting data to monitoring performance, ensuring that decision-makers always work with accurate and consistent information.
A well-structured development process, including the development of data models, data warehouses, and customized BI platforms, is essential for building effective BI systems in real estate.
Effective data integration is the foundation of real estate business intelligence. Data is pulled automatically into a Business intelligence data warehouse from multiple sources such as CRMs, listing platforms, accounting systems, and market data providers, removing silos and manual data handling.
Raw data is structured and transformed into meaningful metrics such as ROI, absorption rate, conversion rates, and profitability by property or agent. This ensures consistency and accuracy across all reporting.
Instead of long reports, users access interactive dashboards that present performance through charts, tables, and filters. These dashboards make it easier to compare trends, identify issues, and drill into details when needed.
Business intelligence enables continuous tracking of operational, financial, and market metrics. This helps real estate companies measure progress, spot inefficiencies, and evaluate opportunities as conditions change.
By combining these components, real estate business intelligence gives agents, managers, and investors a clear, up-to-date view of their operations and the market, supporting more confident and data-driven decisions.
Below are real-world examples of real estate business intelligence dashboards we’ve delivered for agencies, investors, and property managers. Each dashboard focuses on a specific area of analysis, showing how data can be used to improve financial control, sales performance, and market decision-making. By leveraging these dashboards, real estate companies can gain an edge over competitors through advanced data analytics and insights.
A common challenge in real estate business intelligence is ensuring the profitable management of every property. One of our recent residential real estate business intelligence clients managed a portfolio of 30 properties and needed clearer visibility into revenue, expenses, and cash flow trends.
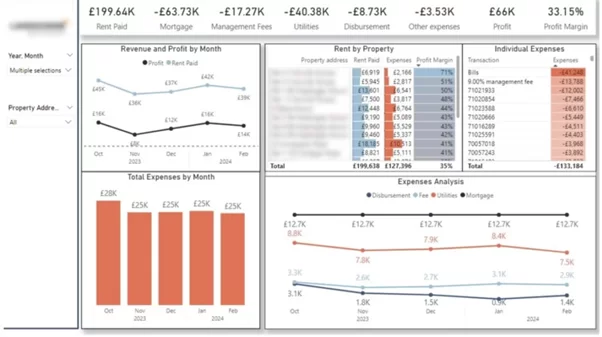
Our Power BI experts created a dashboard that presents profit margin by property, monthly rental income, and a full breakdown of operating expenses. Line charts highlight expense trends over time, while filters allow users to focus on individual properties.
This analysis made it easy to compare profitability across the portfolio and identify underperforming assets. Expense spikes can be traced back to specific cost categories, helping teams quickly understand what changed and why.
With this real estate business intelligence dashboard, investors can prioritise high-performing properties and address issues before they impact cash flow. It also supports better budgeting by revealing recurring costs, vacancies, and unexpected expenses that need future planning.
Real estate companies need a reliable way to monitor profitability over time. While profit and loss statements are essential, many teams struggle to clearly track income, expenses, and key metrics such as Net Operating Income (NOI) at a property or portfolio level.
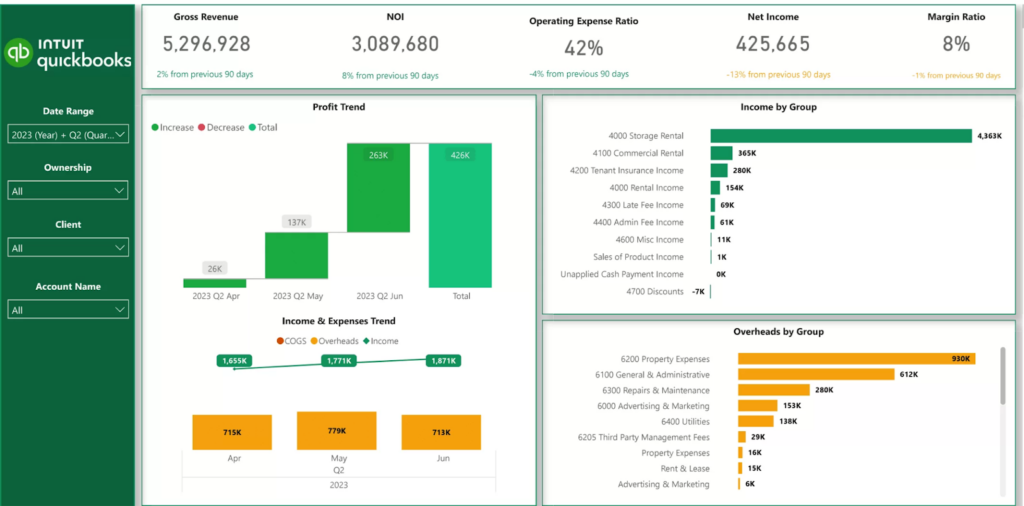
The dashboard visualises income, operating expenses, profit, and NOI trends over time. It provides a clear view of how each component contributes to overall profitability and how performance changes month to month.
This commercial real estate business intelligence dashboard helped the client identify negative trends, cost inefficiencies, and areas where expenses were growing faster than income. It also highlighted which properties and periods delivered the strongest NOI.
With this real estate business intelligence dashboard, decision-makers can optimise resource allocation, protect margins, and plan for sustainable growth. It enables more confident financial planning based on accurate, time-based profitability insights.
Debt financing is a standard part of real estate, which makes it important for companies to clearly understand how their assets and liabilities compare over time. Property values also matter, as many investors realise most of their returns when assets are sold rather than through ongoing income alone. Without a clear view of both debt levels and asset appreciation, it becomes harder to judge financial health, manage risk, and plan long-term investment decisions.
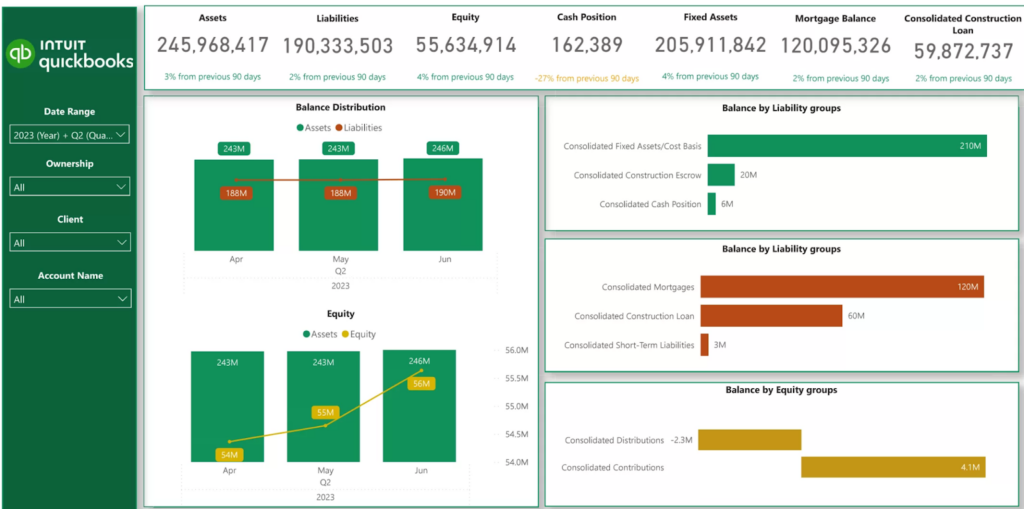
Our BI consultants created a dashboard that compares total assets against liabilities and breaks the liabilities portfolio into clear categories. This structure makes it easy to understand debt composition and overall leverage at a glance.
This analysis gave the client a detailed view of its liabilities and how they relate to available assets. It enabled accurate evaluation of repayment capacity and highlighted potential financial risk areas.
With this real estate business intelligence dashboard, companies can monitor financial stability, manage debt more confidently, and support lending or investment decisions with clear insights.
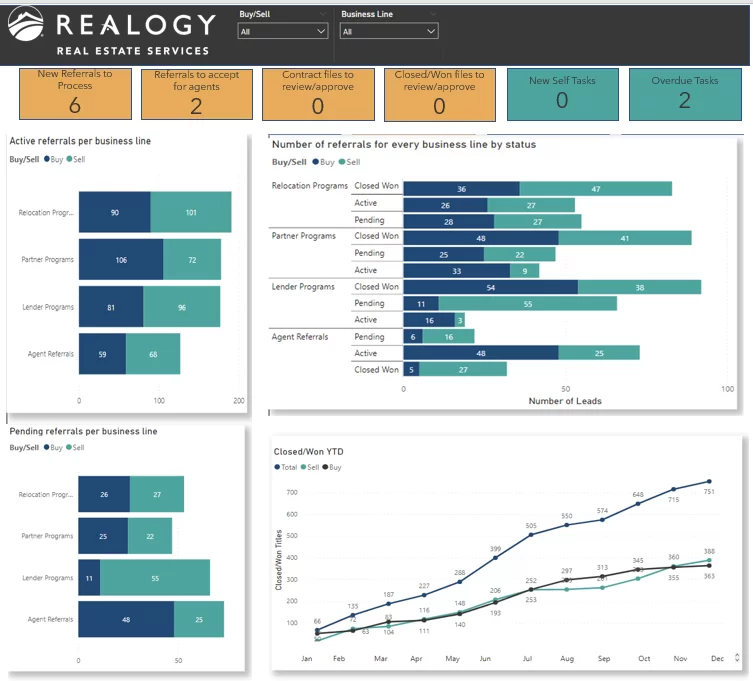
Real estate agencies often struggle to consistently measure and manage agent performance across sales, referrals, and daily activities. Realogy, a Fortune 100 real estate agency, needed better visibility into how agents were handling referrals, progressing tasks, and converting opportunities.
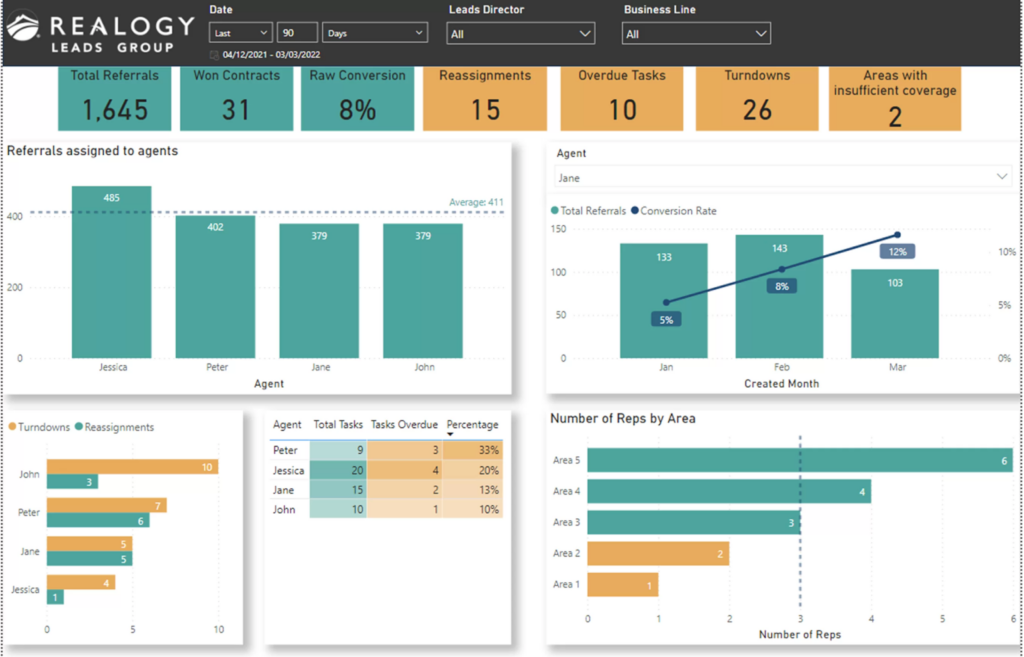
The dashboard consolidates agent activity data from Salesforce, including total received referrals, referral conversion rates, completed tasks, and overall workload. It also tracks initiatives such as refer-a-friend programmes to show how referrals move through the pipeline.
This analysis gave managers a clear, comparable view of agent performance across teams. It highlighted bottlenecks in referral assignment, gaps in follow-up, and uneven task distribution that were limiting conversion rates.
With this real estate business intelligence dashboard, managers can optimise referral allocation, improve task discipline, and coach agents based on real performance data. This leads to higher productivity, stronger conversions, and more predictable sales outcomes across the agency.
Real estate agencies often invest in multiple lead sources without clear visibility into which ones actually generate completed buy and sell deals. This makes it difficult to allocate marketing spend effectively.
The dashboard analyses lead sources and breaks down the number of active, pending, and won deals for each source. It clearly shows which channels drive volume versus which deliver closed transactions.
This analysis allowed the agency to compare lead quality across sources instead of relying on lead volume alone. It highlighted which channels consistently moved deals through the pipeline and which stalled at early stages.
With this real estate business intelligence dashboard, agencies can focus budgets on high-performing lead sources and reduce spend on low-converting channels. The result is higher ROI on marketing efforts and a more predictable deal pipeline.
Real estate decisions are highly dependent on location, but pricing and demand can vary significantly even within small areas. Without clear market-level insights, agents and investors struggle to price properties accurately and set realistic expectations for transaction timelines.
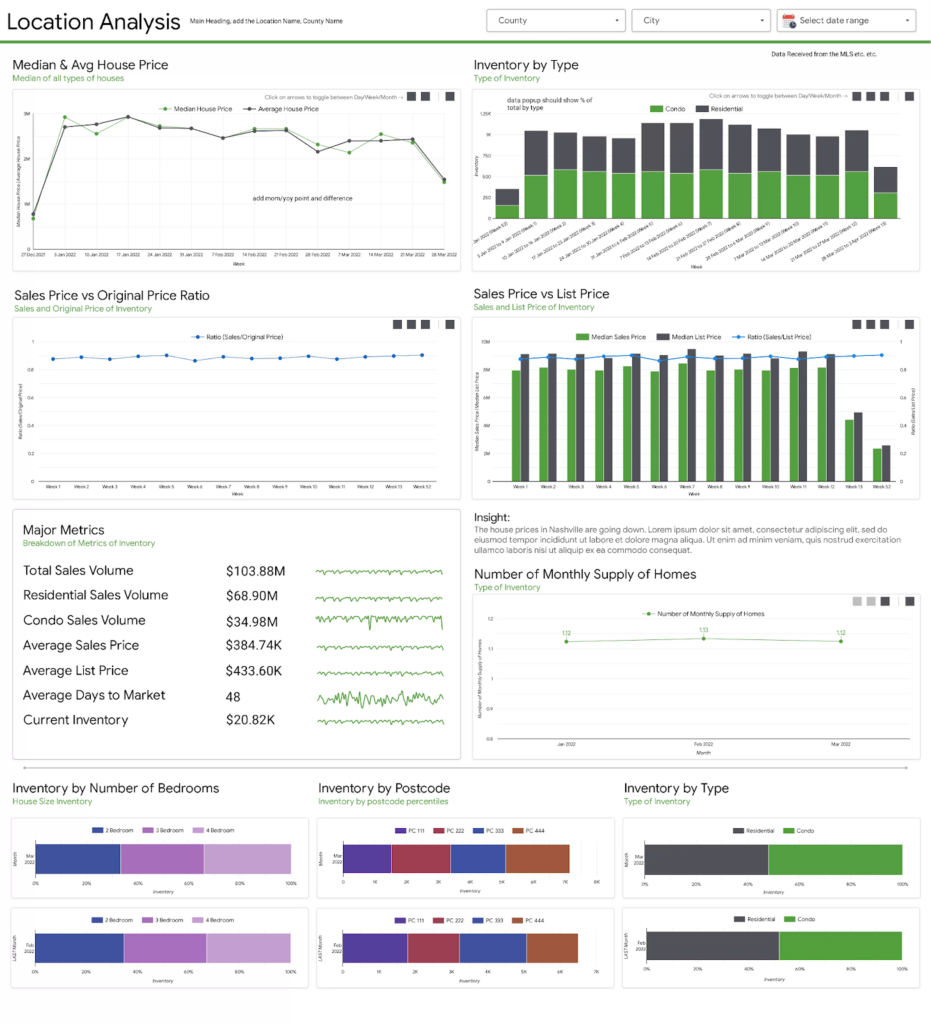
Our data visualization specialists developed this dashboard for a real estate agency to help them analyse the local Nashville market and better advise clients on buying and selling homes. It analyses average property prices by home type and location. It also provides insight into market activity, helping estimate how long it typically takes to buy or sell a property in each area.
This analysis allowed users to benchmark properties against local market averages and understand demand dynamics by location. It supported more accurate pricing decisions and better timing expectations for buyers and sellers.
With this real estate business intelligence dashboard, companies can make more informed offer decisions, improve pricing accuracy, and manage client expectations more effectively. This leads to faster transactions and stronger market positioning.
Understanding whether a market favours buyers or sellers requires more than pricing data alone. Real estate companies need a clear way to track changes in supply and demand as listings enter and exit the market.
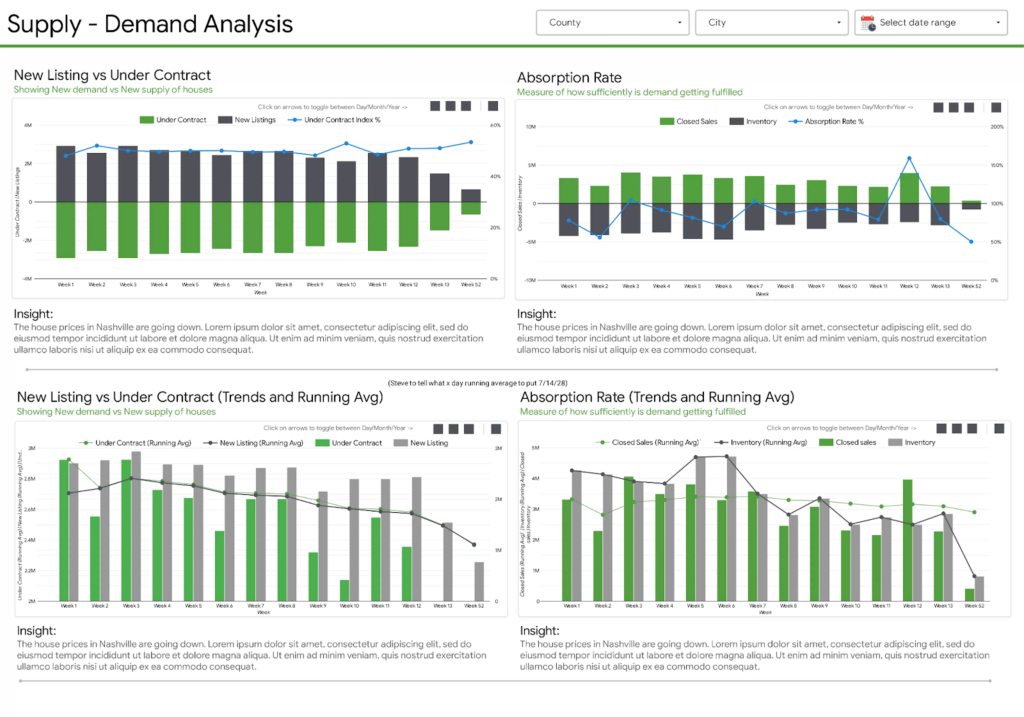
Our dashboard analyses new listings, listings under contract, and total available properties by area. It also calculates the absorption rate by comparing monthly home sales to the total number of active listings.
This analysis revealed how quickly properties move in and out of the market and how demand shifts over time. Absorption rates above 20% highlighted seller’s markets, while rates below 15% clearly indicated buyer’s markets.
With this real estate business intelligence dashboard, agents and investors can assess market conditions with confidence, adjust pricing strategies, and time listings more effectively. Understanding supply and demand dynamics is especially crucial for success in a competitive market. This leads to better negotiation outcomes and more informed market entry decisions.
Price reductions are a strong signal of buyer power and market pressure, but they are often difficult to analyse at scale. Without structured analysis, investors and agents struggle to understand when and why listings require discounts.
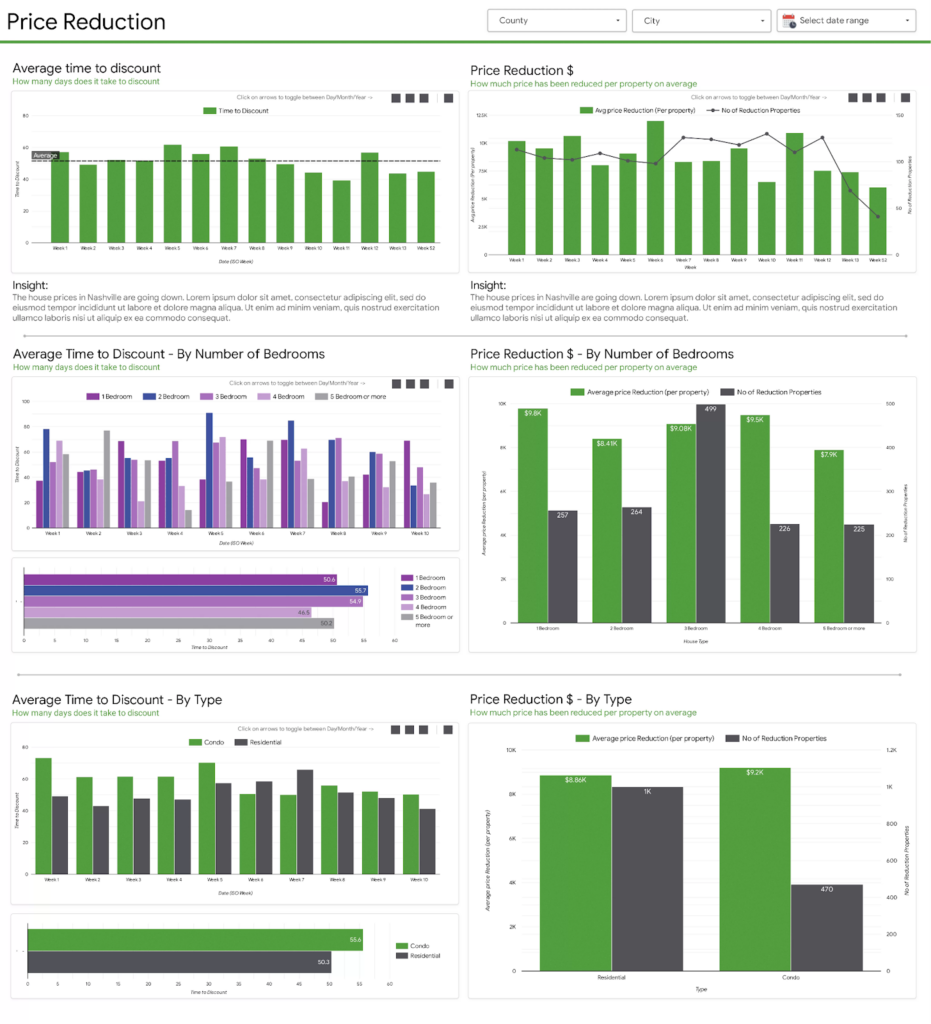
Our team developed a dashboard that analyses listing price reductions across the market, including average time to first discount, average discount size, and which property types are most frequently discounted.
This analysis helped the client identify markets and property types where buyers had stronger negotiating power. It also revealed patterns in how long properties remained listed before prices were reduced and how deep those reductions typically were.
With this real estate business intelligence dashboard, investors can adjust pricing strategies earlier, avoid prolonged listings, and enter negotiations with better market awareness. Agents benefit from setting more realistic price expectations and improving time-to-sale outcomes.
Real estate business intelligence organises property, market, and financial data into structured reporting. Instead of relying on intuition or static reports, teams can make faster and more confident decisions across sales, operations, and investment. BI tools also improve property management by streamlining routine tasks and enhancing tenant relationships.
By analysing market trends, comparable properties, and demand signals, real estate business intelligence supports more accurate pricing decisions. This helps sellers avoid overpricing, buyers make competitive offers, and agents set realistic expectations from the start.
Real estate business intelligence makes it easier to measure agent activity, referrals, and conversion rates. Managers can identify top performers, address bottlenecks, and improve productivity through data-backed coaching.
By analysing lead sources and deal outcomes, companies can focus on channels that generate closed transactions. This improves marketing ROI and ensures high-quality leads are routed to the right agents.
BI dashboards provide real-time visibility into profit and loss, cash flow, NOI, and debt metrics. This allows real estate companies to monitor financial health, manage risk, and plan growth with confidence.
Predictive and historical analysis helps investors understand demand cycles, pricing pressure, and market shifts. With better insight into supply, absorption rates, and price reductions, risk is identified earlier.
Automated reporting replaces manual spreadsheets and ad-hoc analysis. Teams spend less time compiling data and more time acting on insights, which becomes critical as portfolios and agencies grow.
Business intelligence tools help real estate companies turn data from multiple systems into structured, decision-ready reporting. These tools connect sources such as CRMs, listing platforms, accounting systems, and market data providers, allowing teams to analyse performance and market conditions in one place.
One of the most commonly used tools in real estate business intelligence is Power BI. It is widely adopted for building interactive dashboards that track profitability, pricing, agent performance, lead sources, and financial metrics such as NOI and cash flow. As part of our Power BI consulting services, we help real estate agencies and investors integrate Power BI with tools like Salesforce, Excel, SQL databases, and accounting systems to create reliable, scalable reporting.
Other popular business intelligence tools used in real estate include Tableau and Looker. Tableau is often used for advanced visual analysis and exploration of large datasets, while Looker is typically used by organisations that rely heavily on cloud data warehouses. These tools are commonly applied to market analysis, geographic pricing comparisons, and portfolio-level reporting.
By using business intelligence tools instead of manual spreadsheets, real estate companies can reduce reporting effort, improve data consistency, and react faster to market changes. The right tool depends on the size of the organisation, data complexity, and reporting needs, but the outcome is the same: clearer reporting, better decisions, and more scalable operations.
The real estate industry is evolving rapidly, with new trends and technologies reshaping the market landscape. Business intelligence plays a pivotal role in helping real estate professionals stay ahead of these changes by providing valuable insights and supporting more informed decisions. Key trends in the industry include the adoption of predictive analytics, the rise of virtual tours, and a growing emphasis on data-driven decision making.
Real estate companies are increasingly focused on optimizing operations, enhancing the customer experience, and reducing costs to remain competitive. By leveraging business intelligence tools, professionals can monitor market trends, identify challenges, and uncover new opportunities for growth. Staying informed about industry trends enables real estate businesses to navigate market shifts, make strategic decisions, and achieve long-term success. With the right tools and insights, companies can overcome challenges, capitalize on opportunities, and deliver greater value to clients in an ever-changing market.
Real estate business intelligence gives companies a clearer way to understand performance, manage risk, and respond to changing market conditions. By combining operational, financial, and market data into structured reporting, teams can move away from assumptions and make decisions with confidence.
The dashboards and case studies in this article showed how business intelligence can be applied across pricing, profitability, agent performance, marketing, and market analysis. When implemented correctly, it becomes a practical tool that supports both day-to-day decisions and long-term growth.
If you’re considering real estate business intelligence for your organisation, contact us to discuss your data, reporting needs, and use cases. Our team helps real estate companies design dashboards that reflect how their business actually operates!
![]()
![]()
![]()