Hello, dear user, team Vidi Corp is very glad that you chose our QuickBooks Online connector for your reporting needs. In this text, you will find some information on how the QuickBooks Online data model works and what else we can add to empower your vision of your organisation.
Template constructed based on QuickBooks API (API Reference) all the tables from QB documentation can be added on request.
In the standard connector template, you will find 6 tabs:
Let’s go through the tabs and logic behind the visuals.
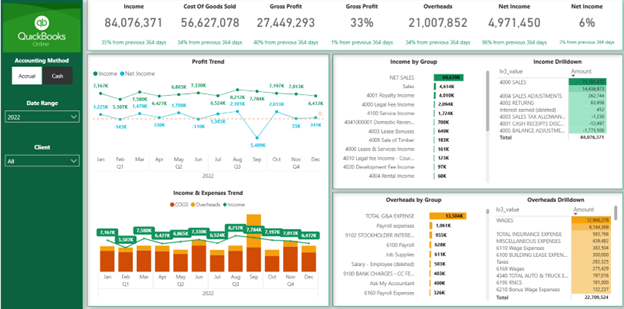
All the visuals on this tab were constructed using the table ‘ProfitAndLossDetail’ from the schema provided for you on the SQL server.
Tab in the report has always single select filter for Accounting Method (Accrual, Cash), Date range and Client.
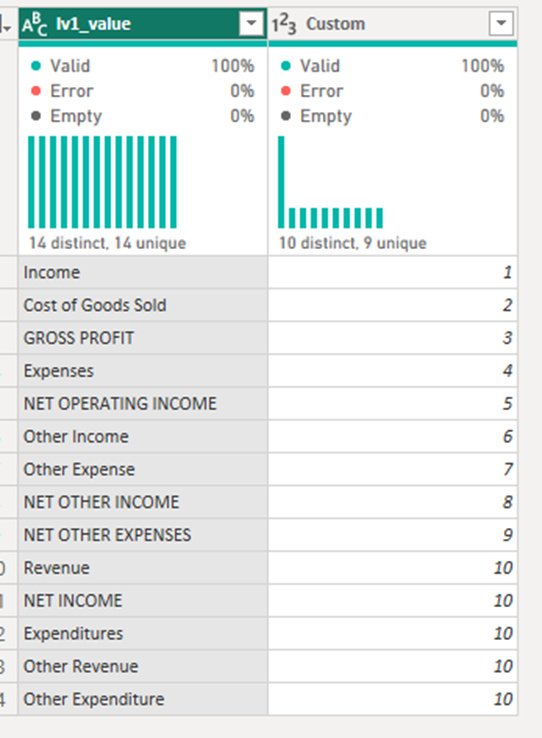
For the ‘ProfitAndLossDetail’ table we are downloading all the columns plus adding the column [Sort L1] for sorting column [lv1_value] that consists of high-level grouping values.
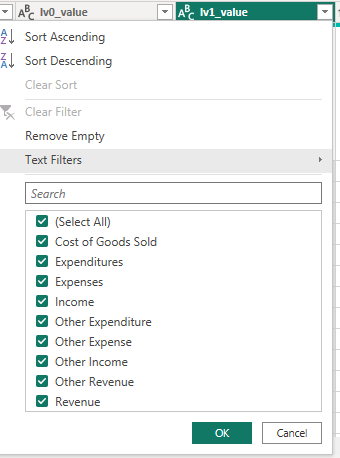
The formula for sorting is
“Table.AddColumn(#”Changed Type”, “Sort L1”, each if [lv1_value] = “Income” then 1 else if [lv1_value] = “Cost of sales” then 2 else if [lv1_value] = “Expenses” then 3 else null)”
Several formulas were done for the purpose of P&L. Main columns for formulas are [Amount_value] and [lv1_value].
CALCULATE(SUM(ProfitAndLossDetail[Amount_value]),
FILTER(ALL(ProfitAndLossDetail_Sort),1),
FILTER(ALL(ProfitAndLossDetail[lv1_value]),
ProfitAndLossDetail[lv1_value] = “Income”)) –
CALCULATE(SUM(ProfitAndLossDetail[Amount_value]),
FILTER(ALL(ProfitAndLossDetail_Sort),1),
FILTER(ALL(ProfitAndLossDetail[lv1_value]),
ProfitAndLossDetail[lv1_value] = “Cost of Goods Sold”))
[Gross Profit] –
CALCULATE(SUM(ProfitAndLossDetail[Amount_value]),
FILTER(ALL(ProfitAndLossDetail_Sort),1),
FILTER(ALL(ProfitAndLossDetail[lv1_value]),
ProfitAndLossDetail[lv1_value] = “Expenses”))
CALCULATE(SUM(ProfitAndLossDetail[Amount_value]),
FILTER(ALL(ProfitAndLossDetail_Sort),1),
FILTER(ALL(ProfitAndLossDetail[lv1_value]),
ProfitAndLossDetail[lv1_value] = “Other Income”)) –
CALCULATE(SUM(ProfitAndLossDetail[Amount_value]),
FILTER(ALL(ProfitAndLossDetail_Sort),1),
FILTER(ALL(ProfitAndLossDetail[lv1_value]),
ProfitAndLossDetail[lv1_value] = “Other Expense”))
Please be aware that if you compare information from this tab to Profit and Loss report it sometimes can be a little bit different, the same as reports ‘Profit and Loss’ and ‘Profit and Loss detail’ can be different in QuickBooks interface.
Visuals like “Income by Group”, “Income Drilldown” are constructed using ‘ProfitAndLossDetail’[Lv2_value] and ‘ProfitAndLossDetail’[lv3_value].
If this level of grouping is not enough, you can also use [lv4_value] and [lv5_value] from ‘ProfitAndLossDetail’ table.
This tab has the same logic as “P&L Visual” but in table view. Filters are the same.
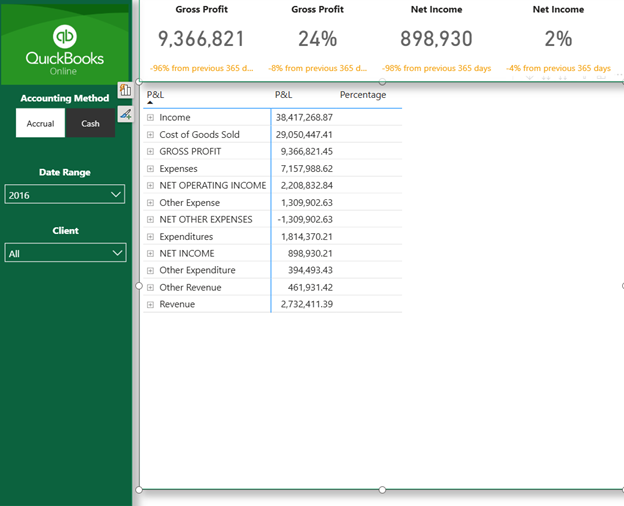
For the correct table illustration, we are using ‘ProfitAndLossDetail_Sort’ table to illustrate P&L rows in correct order.
‘ProfitAndLossDetail_Sort’ constructed using distinct values of ‘ProfitAndLossDetail’[lv1_value] plus appending manual rows.
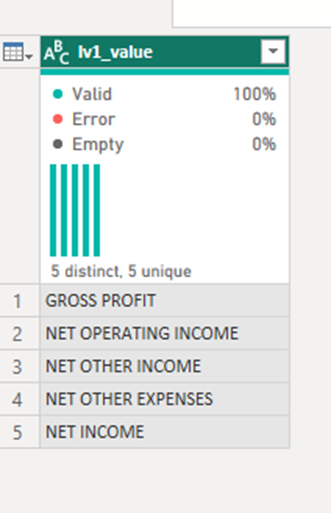
As a result you receive a list of all lv1 P&L rows that can be used for table construction with column [Custom] that is used for [lv1_value] sorting purposes.
For the table illustration, we constructed a special formula to aggregate values per specific rows. Standard logic will look like this.
P&L_Value =
IF(MIN(ProfitAndLossDetail_Sort[lv1_value]) = “GROSS PROFIT”,
IF(ISFILTERED(ProfitAndLossDetail[lv2_value]),BLANK(),
[Gross Profit]),
IF(MIN(ProfitAndLossDetail_Sort[lv1_value]) = “NET OPERATING INCOME”,
IF(ISFILTERED(ProfitAndLossDetail[lv2_value]),BLANK(),
[Net Operating Income]),
IF(MIN(ProfitAndLossDetail_Sort[lv1_value])= “NET OTHER INCOME”&&[Net Other]>0,
IF(ISFILTERED(ProfitAndLossDetail[lv2_value]),BLANK(),
[Net Other]),
IF(MIN(ProfitAndLossDetail_Sort[lv1_value])= “NET OTHER EXPENSES”&&[Net Other]<0,
IF(ISFILTERED(ProfitAndLossDetail[lv2_value]),BLANK(),
[Net Other]),
IF(MIN(ProfitAndLossDetail_Sort[lv1_value]) = “NET INCOME”,
IF(ISFILTERED(ProfitAndLossDetail[lv2_value]),BLANK(),
[Net Operating Income]+[Net Other]),
SUM(ProfitAndLossDetail[Amount_value]))))))
DAX checking here the row it’s on and use appropriate measure. If row has total value, without possibility of drill down we turn off drilling possibilities with
IF(ISFILTERED(ProfitAndLossDetail[lv2_value]),BLANK()
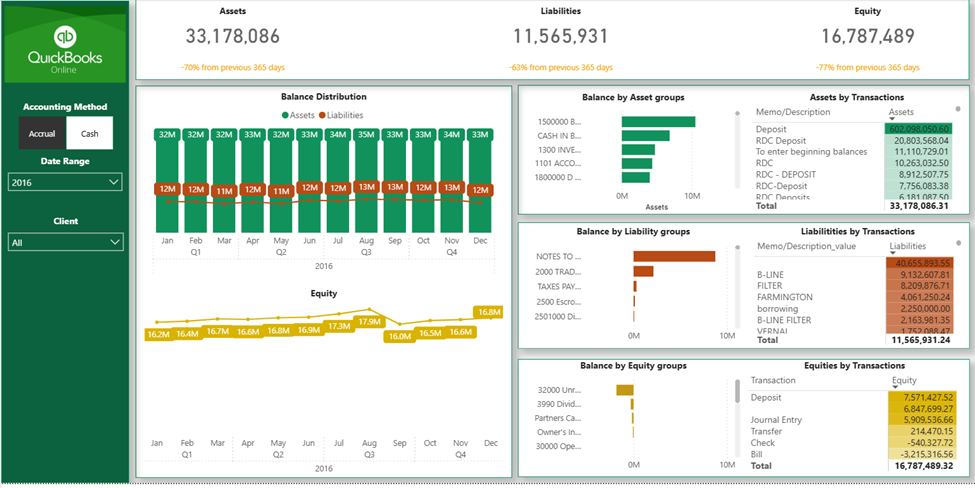
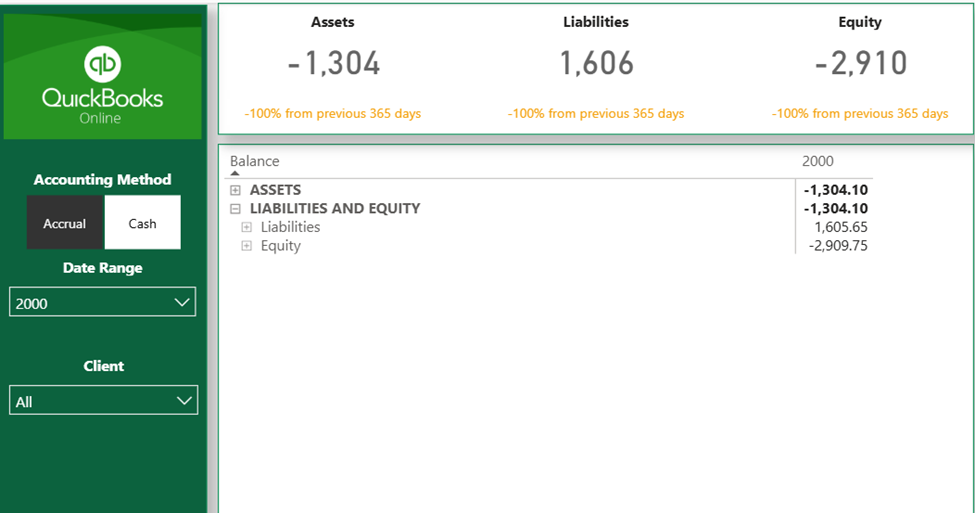
For this tab we are using similar logic as in P&L. Table ‘BalanceSheetDetail’ is used (not ‘BalanceSheet’ they have different level of data grouping) with main columns [Amount_Value] and [lv1_value]. Filters for ‘Accounting Method’ (single select), Date range and Client.
To make it work with balance sheet data, during downloading ‘BalanceSheetDetail’ in power query we are adding information on “Net Income” and “Retained Earnings” from table ‘ProfitandLoss’. Fort that we construct several tables that append to main table ‘BalanceSheetDetail’
select
lv0 as “lv2_value”
,rdate as “Date_value”
,value as “Amount_value”
,client_id
,’Equity’ as “lv1_value”
,’LIABILITIES AND EQUITY’ as “lv0_value”
,accounting_method
from [“&Schema&”].ProfitAndLoss
where lv0 = ‘Net Income’
and accounting_method = ‘Accrual’
select
lv0 as “lv2_value”
,rdate as “Date_value”
,value as “Amount_value”
,client_id
,’Equity’ as “lv1_value”
,’LIABILITIES AND EQUITY’ as “lv0_value”
,accounting_method
from [“&Schema&”].ProfitAndLoss
where lv0 = ‘Net Income’
and accounting_method = ‘Cash’
select
lv0 as “lv2_value”
,rdate as “Date_value”
,value as “Amount_value”
,client_id
,’Equity’ as “lv1_value”
,’LIABILITIES AND EQUITY’ as “lv0_value”
,accounting_method
from [“&Schema&”].ProfitAndLoss
where lv0 = ‘Net Income’
and accounting_method = ‘Accrual’
select
lv0 as “lv2_value”
,rdate as “Date_value”
,value as “Amount_value”
,client_id
,’Equity’ as “lv1_value”
,’LIABILITIES AND EQUITY’ as “lv0_value”
,accounting_method
from [“&Schema&”].ProfitAndLoss
where lv0 = ‘Net Income’
and accounting_method = ‘Cash’
All the calculations for Balance constructed around main measure [balance]. [balance] measure logic – to aggregate positive and negative changes of balance from the start of the client till today. On the way we add specific calculations for “Net Income” and “Retained Earnings”. For that we added values in power query.
“Net Income” calculating [Amount_value] from start of the year until today for [lv2_value]=”Net Income”.
“Retained Earnings” calculating [Amount_value] before this year for [lv2_value]=”Retained Earnings”.
Full formula for balance calculations
balance =
var d = MAX(dimCalendar[Date])
var y = MAX(dimCalendar[Year])
var tab =
CALCULATETABLE(SUMMARIZE(BalanceSheetDetail,
BalanceSheetDetail[lv0_value],
BalanceSheetDetail[lv1_value],
BalanceSheetDetail[lv2_value],
BalanceSheetDetail[Memo/Description_value],
dimCalendar[Date],
“balValue”, IF(MIN(BalanceSheetDetail[lv2_value]) = “Net Income”,
CALCULATE(SUM(BalanceSheetDetail[Amount_value]),
FILTER(ALL(dimCalendar),
dimCalendar[Date]<=d&&
dimCalendar[Year]>=y)),
IF(MIN(BalanceSheetDetail[lv2_value]) = “Retained Earnings”,
CALCULATE(SUM(BalanceSheetDetail[Amount_value]),
FILTER(ALL(dimCalendar),
dimCalendar[Date]<=d&&
dimCalendar[Year]<y)),
CALCULATE(SUM(BalanceSheetDetail[Amount_value]),
FILTER(ALL(dimCalendar),
dimCalendar[Date]<=d))))),
FILTER(ALL(dimCalendar),1))
var result = SUMX(tab,[balValue])
return
result
Additional formulas for balance parts constructed with [balance] measure and [lv0_value] and [lv1_value].
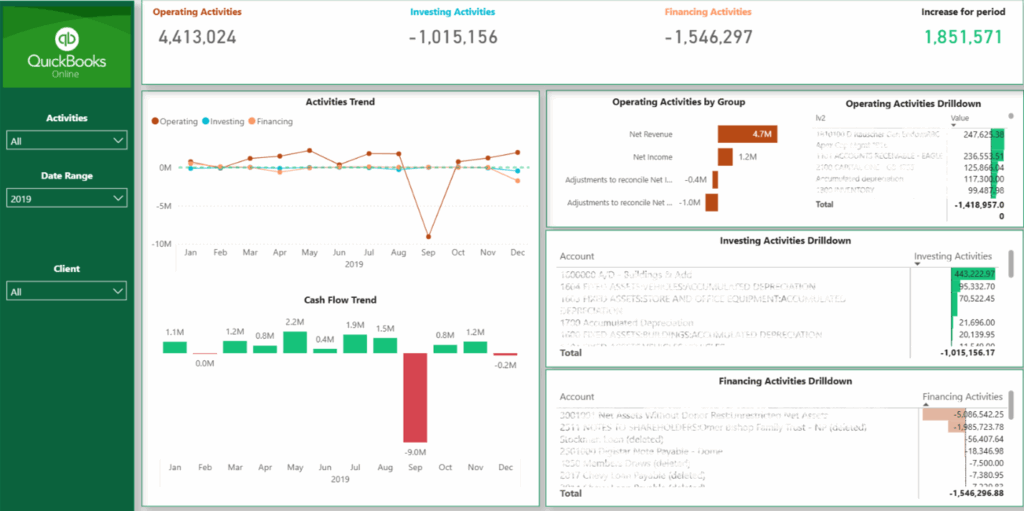
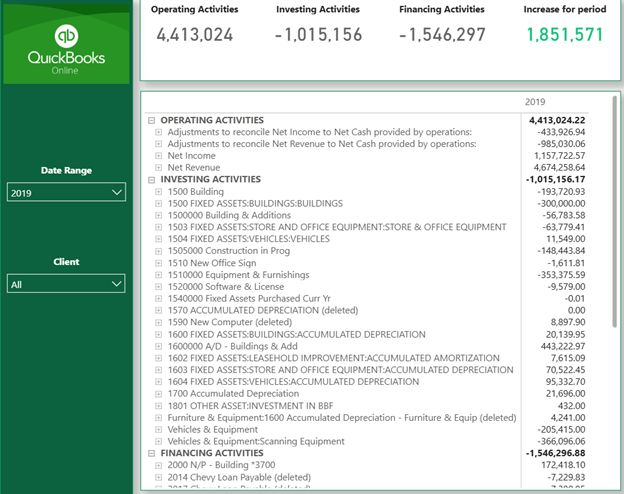
CashFlow visuals constructed using table ‘cashflow’ with the help of table ‘CashFlow_Sort’. CashFlow tabs don’t have ‘Accounting Method’ Filter.
For ‘cashflow’ we additionally append table ‘NetIncome_Cash_CashFlow’ for “Net Income” values.
SQL query for ‘NetIncome_Cash_CashFlow’
select
‘OPERATING ACTIVITIES’ as “”lv0″”,
rdate ,
value ,
client_id ,
‘Net Income’ as “”lv1″”
from [“&Schema&”].ProfitAndLoss
where lv0 = ‘Net Income’ and accounting_method = ‘Cash’ order by rdate
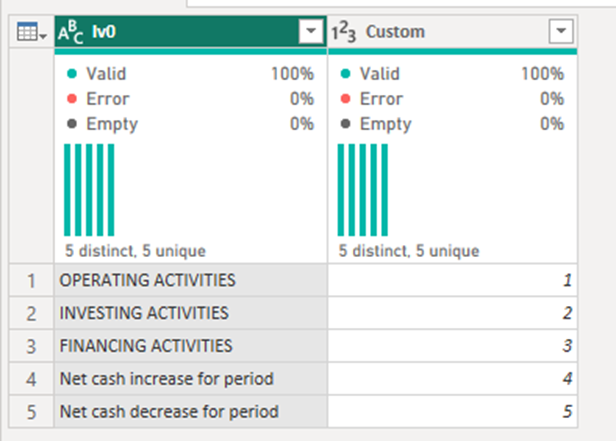
‘CashFlow_Sort’ table consists of distinct rows from ‘CashFlow’[lv0] with 2 manual rows – “Net cash increase for period” and “Net cash decrease for period”. Plus a sorting column.
Cash flow Visuals using 4 measures.
For CashFlow Table we are using measure “m_CashFlow” in combination with table ‘CashFlow_Sort’ for correct calculations.
“m_CashFlow” sum up ‘CashFlow’[value] with additional check if cash was increased or decreased during the period.
m_CashFlow =
VAR periodResult = CALCULATE([Operating Activities]+[Financing Activities]+[Investing Activities],FILTER(ALL(CashFlow_Sort),1))
RETURN
IF(MIN(CashFlow[lv1]) IN {“Net Income”, “30000 Opening Balance Equity”},
IF(ISFILTERED(CashFlow[lv2]),
BLANK(),SUM(CashFlow[value])),
IF(MIN(CashFlow_Sort[lv0]) = “Net cash increase for period”&&periodResult>0,
IF(ISFILTERED(CashFlow[lv1]),
BLANK(),
periodresult),
IF(MIN(CashFlow_Sort[lv0]) = “Net cash decrease for period”&&periodResult<0,
IF(ISFILTERED(CashFlow[lv1]),
BLANK(),
periodresult),
SUM(CashFlow[value]))))
In your Power BI template, you can see only tables that were used for illustration purposes. You also can download more and play with them if you need.
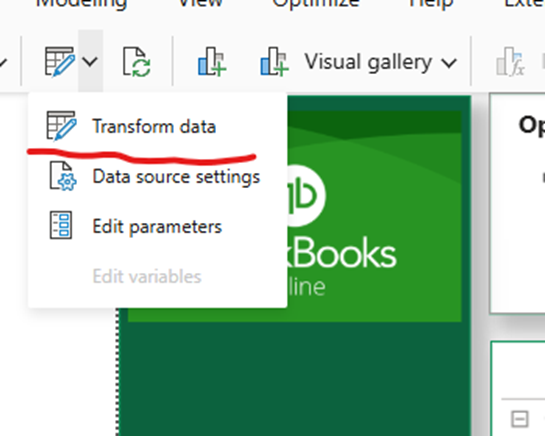
To do that, you go to transform data
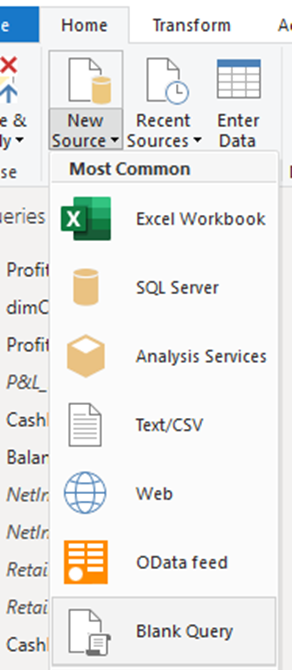
Choose “New Source” and “blank query”
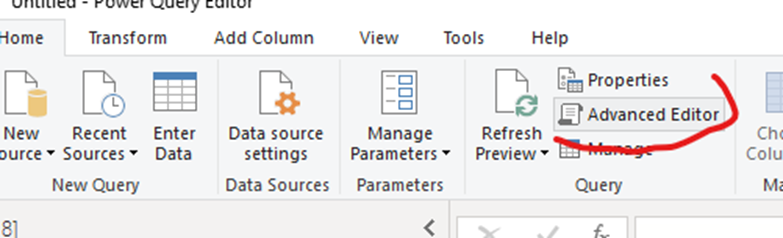
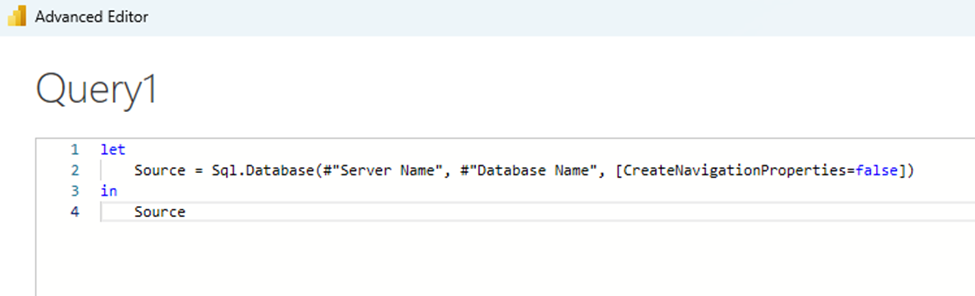
And Paste this code:
let
Source = Sql.Database(#”Server Name”, #”Database Name”, [CreateNavigationProperties=false])
in
Source
It should look like this.
Click ‘Done’ and you will see the list of the tables you can use.
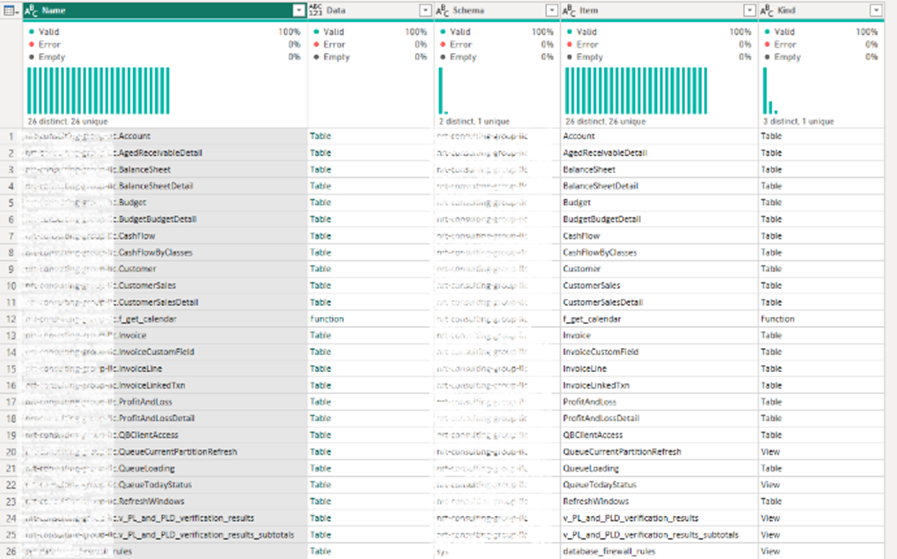
If you are using any other program, you can use the database and schema name to see all the tables you can work on.
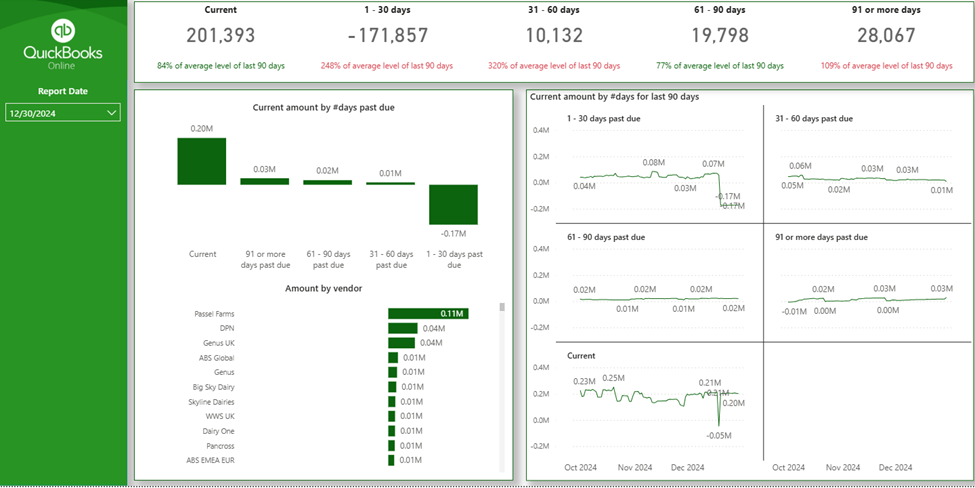
Aging Report.
Showing your Payables aging. Table used for this visuals is ‘AgedPayableDetail’. Main column to combine numbers is [subt_home_open_bal_value]. You need to sum up column [subt_home_open_bal_value] for particular [report_date].
To illustrate number of days past due, you need to filter sum of [subt_home_open_bal_value] by column [attr_value].
To show dynamic for last 90 days, you need to connect table ‘AgedPayableDetail’ to ‘dimCalendar’ table using ‘AgedPayableDetail’[report_date]. After that you need to calculate sum of [subt_home_open_bal_value] for the last 90 days before filtered [report_date]. Visual should used [date] from ‘dimCalendar’ table.
[Last 90 days] formula.
Last 90 days =
var endperiod = CALCULATE(MIN(AgedPayableDetail[report_date]),FILTER(ALL(dimCalendar),1))
var startperiod = DATE(YEAR(endperiod),MONTH(endperiod),DAY(endperiod)-90)
var result =
CALCULATE(SUM(AgedPayableDetail[subt_home_open_bal_value]),
ALL(AgedPayableDetail[report_date]),
AgedPayableDetail[report_date]>=startperiod&&
AgedPayableDetail[report_date]<=endperiod)
return
result
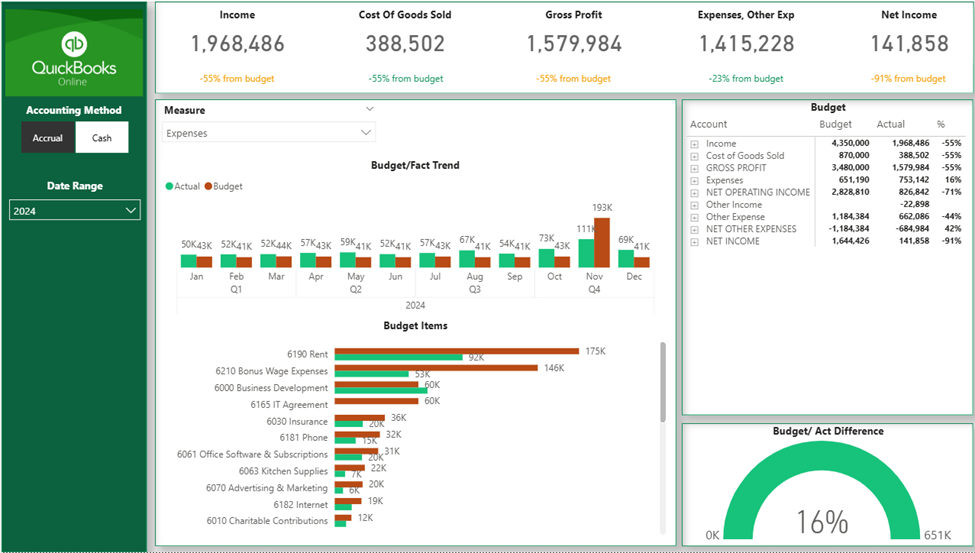
Showing a comparison of your budget to actual values.
To make this visual work you will need to download table ‘BudgetBudgetDetail’
Select
AccountRef_name,
AccountRef_value,
Amount,
BudgetDate,
client_id,
budget_id
from BudgetBudgetDetail
Create table ‘ProfitAndLossDetail_List’, it will help to combine budget rows with actual rows of P&L. Steps to create the table.
This table will be a bridge between ‘ProfitAndLossDetail’-‘Budget’-‘ProfitAndLossDetail_Sort’.
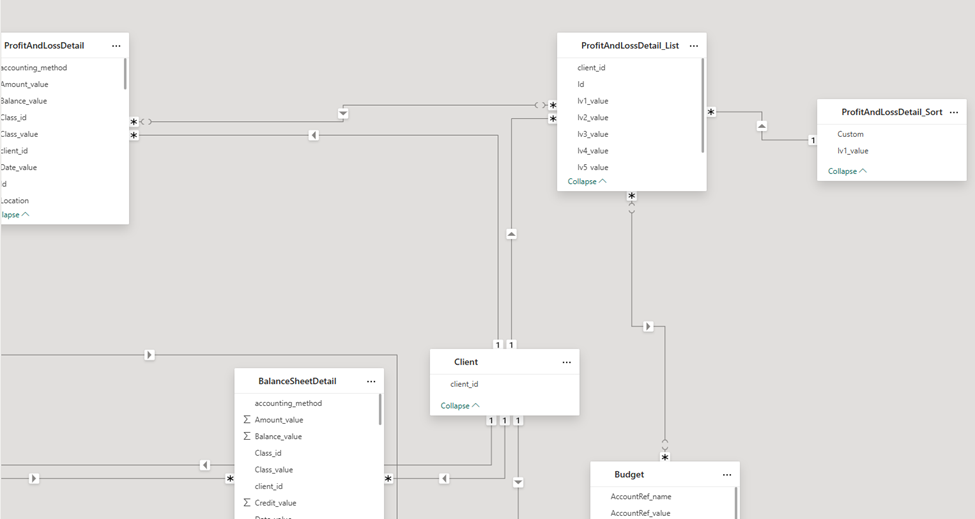
Logic for the schema:
For Budget calculations, we are using measure [m_Budget] to identify the row we are using from the table ‘ProfitAndLossDetail_Sort’ to make appropriate calculations.
m_Budget =
VAR rev = CALCULATE(SUM(Budget[Amount]),FILTER(ALL(ProfitAndLossDetail_Sort),ProfitAndLossDetail_Sort[lv1_value] IN {“Income”, “Revenue”}))
VAR cogs = CALCULATE(SUM(Budget[Amount]),FILTER(ALL(ProfitAndLossDetail_Sort),ProfitAndLossDetail_Sort[lv1_value] = “Cost of Goods Sold”))
VAR expenses = CALCULATE(SUM(Budget[Amount]),FILTER(ALL(ProfitAndLossDetail_Sort),ProfitAndLossDetail_Sort[lv1_value] IN {“Expenses”, “Expenditures”}))
VAR otherincome = CALCULATE(SUM(Budget[Amount]),FILTER(ALL(ProfitAndLossDetail_Sort),ProfitAndLossDetail_Sort[lv1_value] IN {“Other Income”}))
VAR otherexpense = CALCULATE(SUM(Budget[Amount]),FILTER(ALL(ProfitAndLossDetail_Sort),ProfitAndLossDetail_Sort[lv1_value] IN {“Other Expense”}))
VAR netotherexpense = otherincome-otherexpense
var result =
SWITCH(TRUE(),
MIN(ProfitAndLossDetail_Sort[lv1_value])=”GROSS PROFIT”, rev-cogs,
MIN(ProfitAndLossDetail_Sort[lv1_value])=”NET OPERATING INCOME”, rev-cogs-expenses,
MIN(ProfitAndLossDetail_Sort[lv1_value])=”NET OTHER EXPENSES”, netotherexpense,
MIN(ProfitAndLossDetail_Sort[lv1_value])=”NET INCOME”, rev-cogs-expenses-otherexpense+otherincome,
SUM(Budget[Amount]))
RETURN
result
![]()
![]()
![]()