We provide this Zoho Books Power BI dashboard as a free template for clients who use our Zoho Books Power BI connector. It gives finance teams and business owners instant visibility into their financial performance without building reports from scratch.
The dashboard includes dedicated pages for Profit & Loss, Balance Sheet, Cash Flow, Accounts Receivable, and Outstanding Invoices. It also allows you to consolidate data from multiple Zoho Books companies into one centralised report. You can switch between a single entity view or analyse performance across all companies in one place.
We spent over 50 hours refining the formulas, validating calculations, and optimising the layout to ensure the numbers are accurate and easy to interpret. Instead of investing that time yourself, you can install the template, connect your data, and customise the visuals and metrics to match your reporting needs
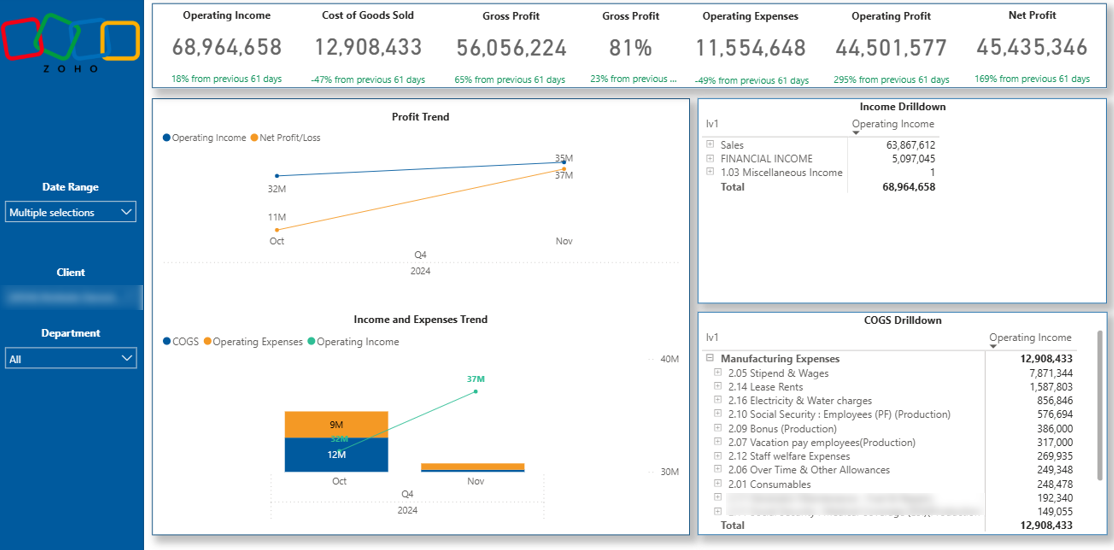
Our Zoho Books Profit & Loss dashboard is powered by our dedicated Zoho Books Power BI connector. It automatically extracts financial data and visualises core P&L metrics, including Income, Cost of Goods Sold (COGS), Gross Profit, Operating Expenses, and Net Profit.
Users can filter results by client, date range, and department. This makes it easy to analyse profitability across different business units, customer segments, or reporting periods without rebuilding reports or exporting data into Excel.
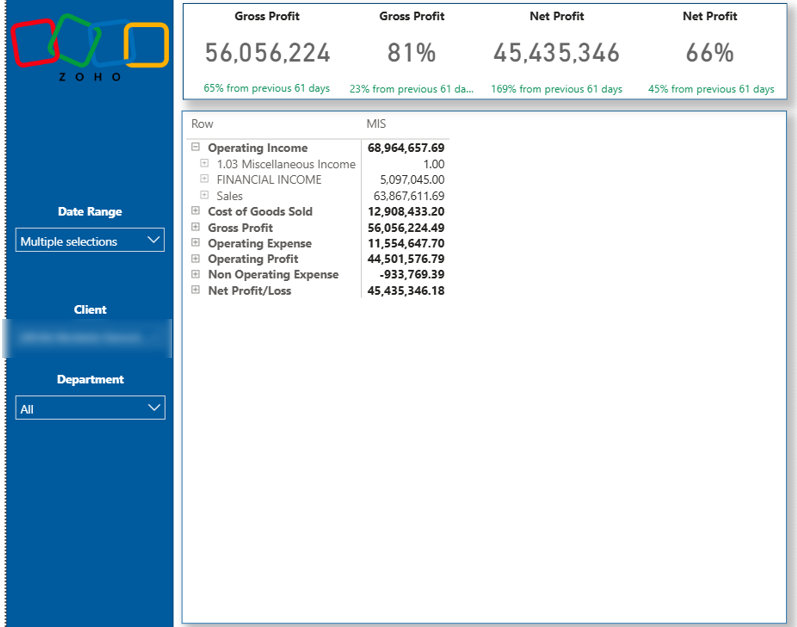
Zoho Books uses a unique data structure built around two primary tables: the Chart of Accounts and the Account Transactions table. We model and combine these tables inside Power BI to accurately reconstruct the full P&L statement and ensure consistent, reliable calculations.
The dashboard also supports drill-down to entry ID level, which corresponds to the original transaction ID in Zoho Books. This allows finance teams to move from high-level financial summaries directly to individual transactions for validation and audit purposes.
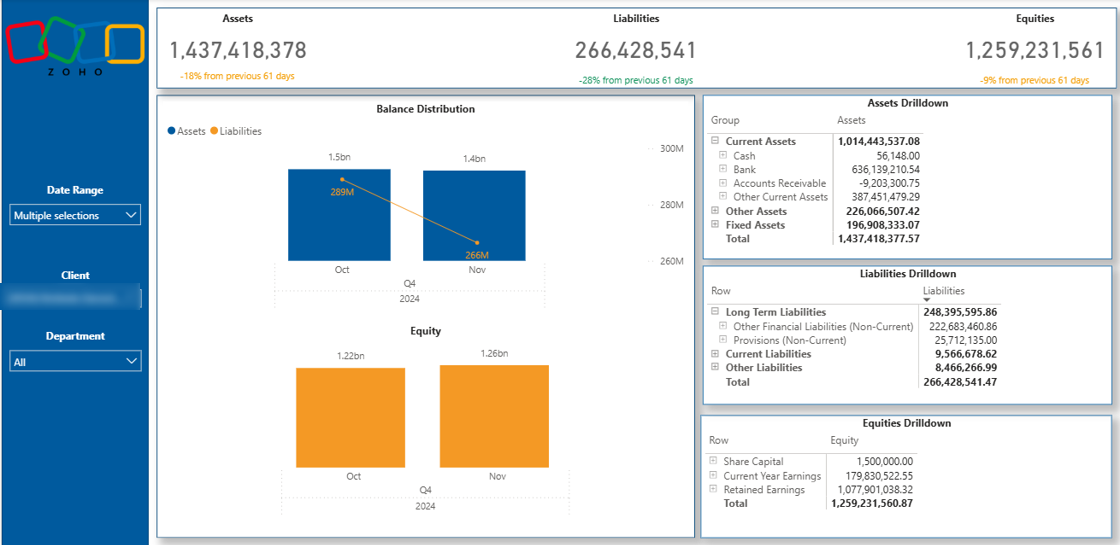
The Balance Sheet dashboard provides a structured overview of your company’s financial position over time. It visualises monthly trends for Assets, Liabilities, and Equity, helping you monitor how your balance sheet evolves and where structural changes occur.
This dashboard is particularly valuable for capital-intensive industries such as real estate, where liabilities are often significant due to mortgages and commercial loans. At the same time, it helps management track asset growth, debt levels, and retained earnings to ensure the business maintains a healthy financial structure.
We also offer the balance sheet view in a tabular format. You can expand and collapse the categories and drill down into the transaction level if needed.
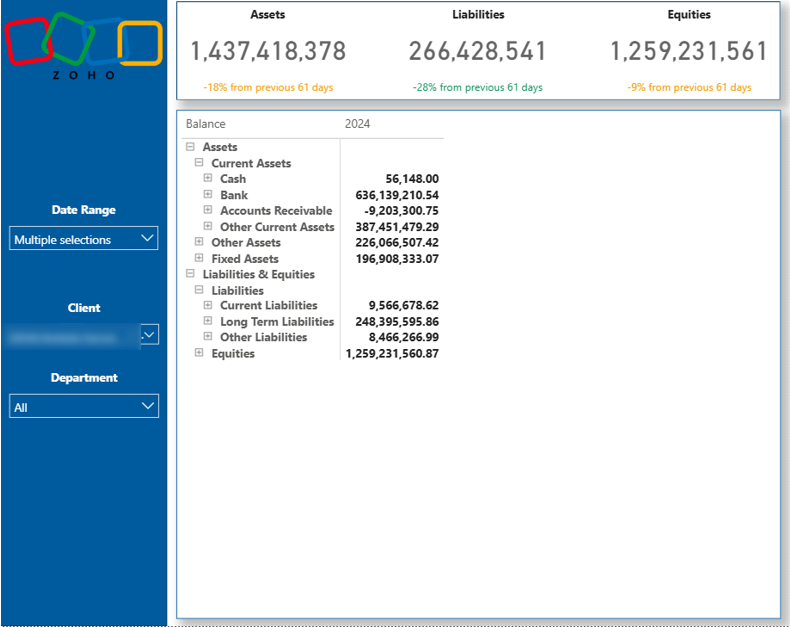
Each main category is broken down into detailed account groups that make up the total balances. You can analyse movements in current assets, fixed assets, payables, loans, or equity accounts and quickly identify what is driving changes in your financial position.
Like the P&L dashboard, this report is powered by our Zoho Books Power BI connector. We model the Chart of Accounts and Account Transactions tables inside Power BI to accurately reconstruct balance sheet logic and ensure consistent, audit-ready calculations across reporting periods.
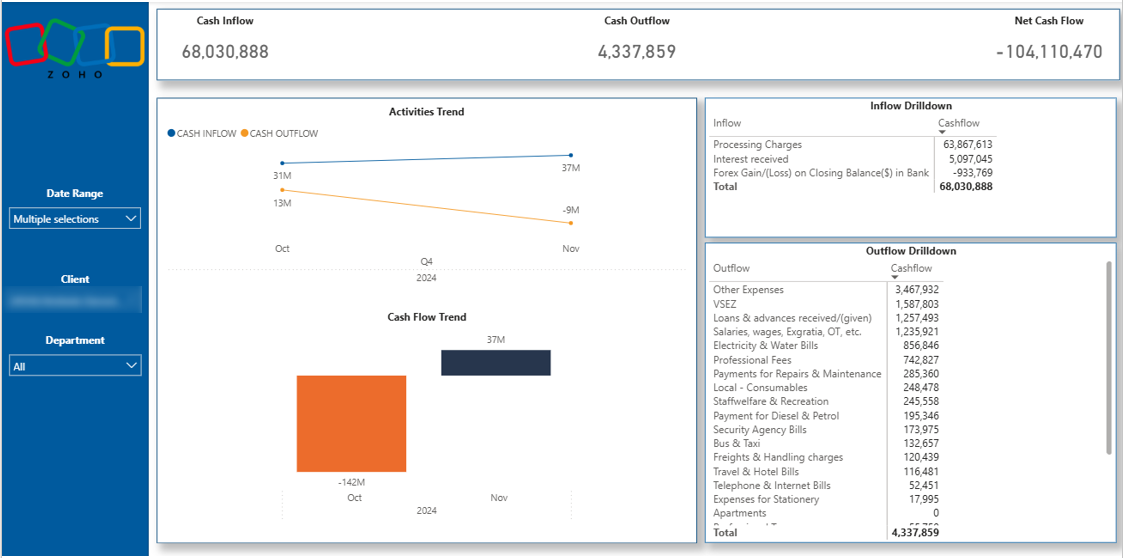
The Cash Flow dashboard shows the total increase or decrease in cash reserves for the selected period and month over month. It helps finance teams clearly understand how cash is moving through the business and whether operations are generating or consuming liquidity.
The dashboard shows the total cash inflow and outflow. Each activity category is further split into underlying accounts, allowing you to see exactly which transactions are driving cash inflows and outflows.
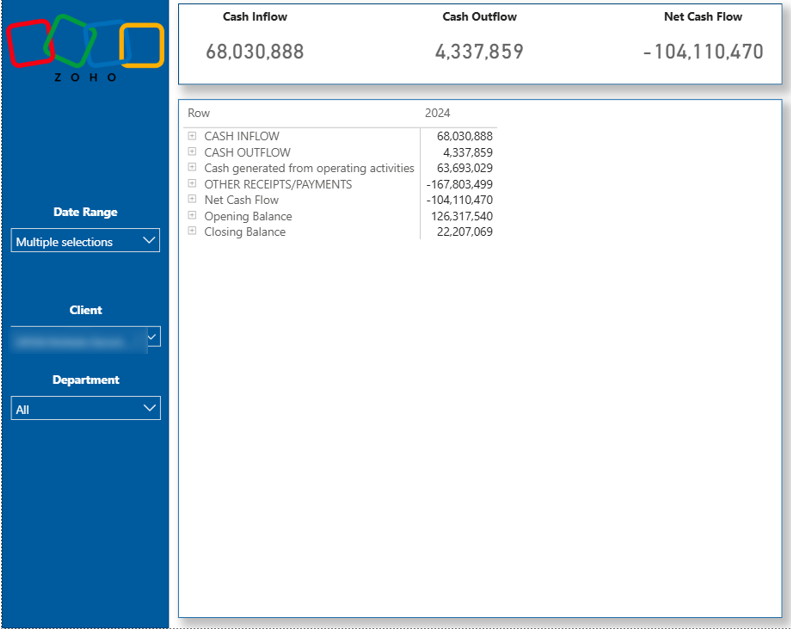
The Cash Flow table report mirrors the traditional cash flow statement format in Zoho Books. You can expand and collapse categories using plus and minus icons to move from a high-level overview down to detailed account-level movements, making it easy to review specific drivers of cash changes.
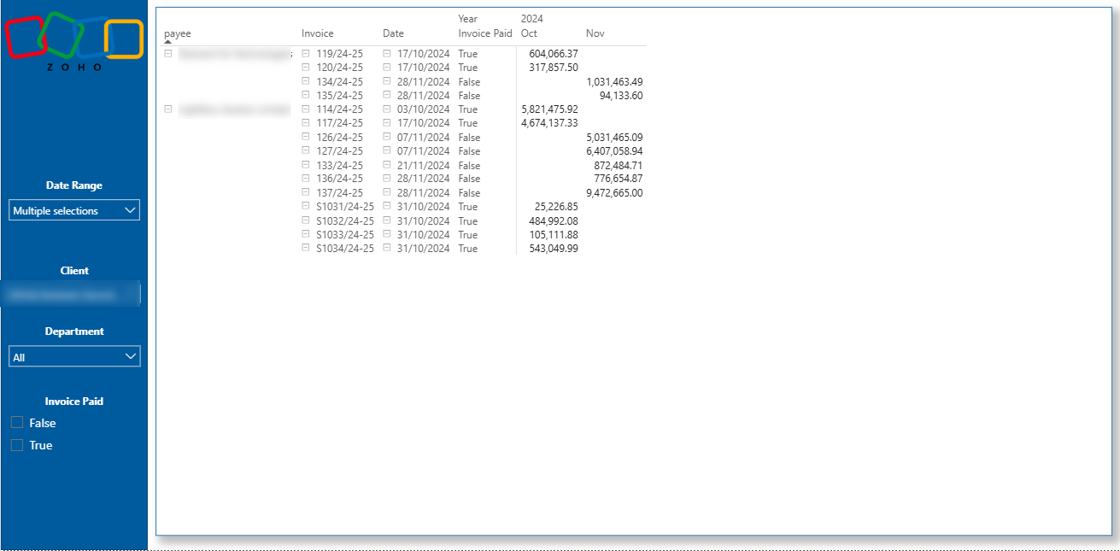
The Accounts Receivable dashboard provides a clear overview of all issued invoices by customer. It displays each invoice number, invoiced amount, issue date, and payment date, giving finance teams full visibility into outstanding and settled balances.
You can use the filter at the bottom of the report to switch between paid and unpaid invoices. This makes it easy to focus specifically on overdue amounts without manually reviewing each document.
With this structure, you can quickly identify which invoices remain outstanding and contact clients directly, referencing the exact invoice number and invoice date. This improves collection efficiency and helps maintain healthy cash flow without exporting data into separate spreadsheets.
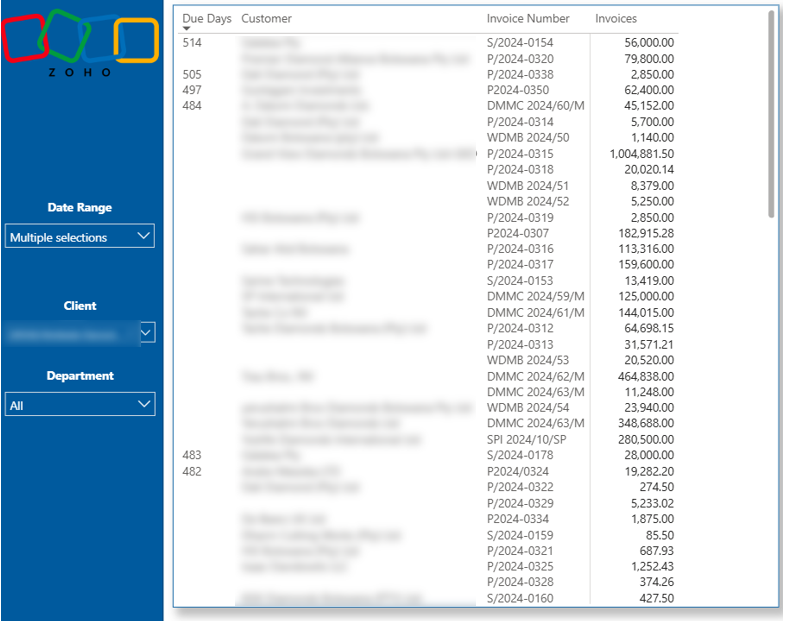
The Overdue Invoices dashboard focuses specifically on invoices that have been outstanding for more than 30 days. It gives finance teams an immediate view of delayed payments and highlights where follow-up action is required.
If your standard billing terms differ, you can adjust the overdue threshold using the dashboard filters. This allows you to redefine what qualifies as overdue based on your payment terms, such as 14 or 60 days
The central table displays the invoice number, customer name, and invoiced amount. The left-most column shows the exact number of days each invoice has been outstanding, making it easy to prioritise collection efforts based on how long payments have been delayed.
Our Power BI consultants have developed 1,000+ dashboards for over 600 clients across finance, retail, manufacturing, professional services, and other industries. Every dashboard is built around a clear reporting structure, accurate data modelling, and decision-focused KPIs.
If you need a tailored Zoho Books dashboard designed around your specific chart of accounts, entities, and management reporting requirements, we can help. Contact us to request a custom-built dashboard aligned with your business goals.
![]()
![]()
![]()