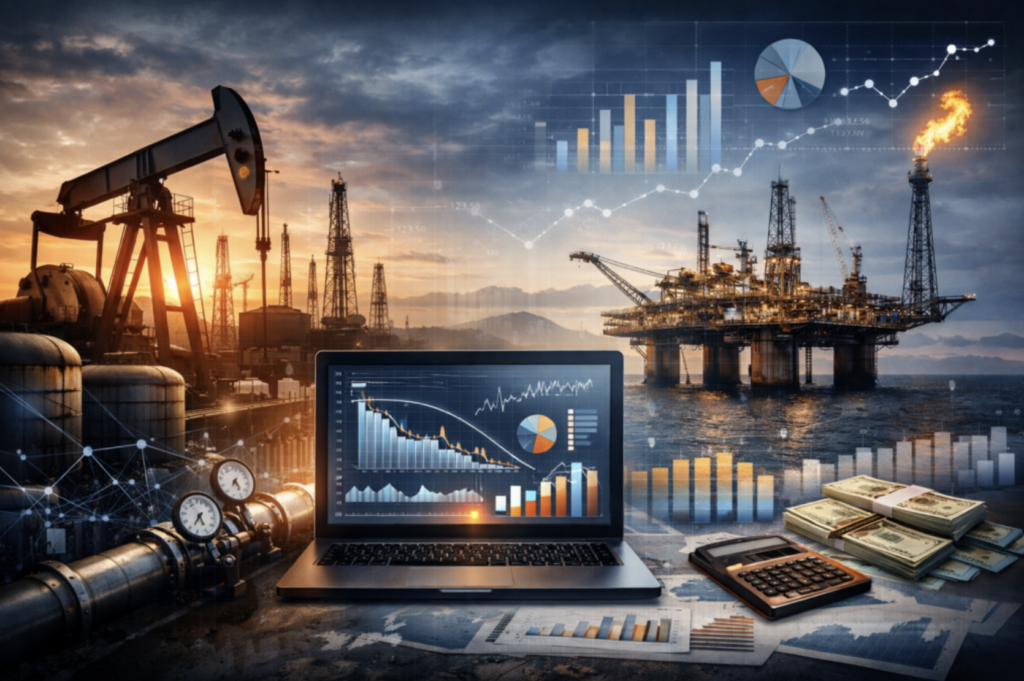
Oil and gas analytics is the practice of using operational and financial data to improve decisions across exploration, production, assets, and projects. By bringing production data, equipment records, project hours, and cost information into one structured reporting environment, oil and gas analytics turns fragmented data into practical dashboards and forecasts that support better asset management, tighter project control, and more confident investment decisions.
As an oil and gas data analytics company, we build 1,000+ custom data visualization solutions for oilfield developers like Schlumberger, inspectors and acquisition advisors.That includes consolidating data from multiple sources, designing the data model, and delivering dashboards that match how operations teams and leadership actually work. The focus is always on clarity, consistency, and making sure the numbers can be trusted.
This article explains what oil and gas analytics is, the benefits it delivers, and the most common real-world dashboard use cases. It also outlines a simple implementation roadmap and the main software options companies use to build modern oil and gas analytics platforms.
Oil and gas analytics refers to the use of data to improve decision-making across exploration, production, asset management, and project delivery. It involves collecting operational and financial data, structuring it properly, and turning it into reports, dashboards, and forecasts that support practical business decisions.
In upstream operations, this can include analysing well performance, decline curves, reservoir behaviour, and production forecasts. In oilfield services and consultancies, it often focuses on project hours, utilisation, cost recovery, and margin protection. For asset-heavy businesses, it includes monitoring equipment status, maintenance schedules, and compliance risk.
At its core, oil and gas analytics connects technical activity with operational and financial outcomes. It gives leaders a clear view of performance, risk, and profitability so decisions are based on measurable evidence rather than assumptions.
Oil and gas companies generate different types of data across exploration, production, projects, and commercial operations. Understanding these data categories is the first step toward building an effective analytics framework.
This data is typically captured through field sensors, SCADA systems, and production databases. It supports forecasting, decline curve modelling, reserve estimation, and performance benchmarking across wells and fields.
Geological data helps teams understand field structure, hydrocarbon potential, and recovery strategies. When analysed properly, it supports acquisition decisions, field development planning, and long-term production optimisation.
This data is critical for compliance, safety, and operational continuity. Analytics built on this data improves asset utilisation, reduces downtime, and prevents non-compliant equipment from being deployed.
This is especially important for oilfield services and consulting firms delivering multidisciplinary projects. Analysing this data protects margins, improves forecasting accuracy, and highlights where effort exceeds plan.
Commercial analytics connects operational performance to profitability. When integrated with operational metrics, this data provides leadership with a complete view of margin performance and investment returns.
Oil and gas companies operate with tight margins, high capital exposure, and complex project environments. Small gaps in reporting, utilisation, or forecasting can reduce profitability without being immediately visible. Structured data analytics reduces this risk by turning operational and financial data into clear, consistent insight that supports timely decisions.
Below are some of the most practical benefits oil and gas organisations achieve when we implement structured analytics solutions.
1. Faster Decision-Making
Oil and gas data analytics improves decision-making by connecting operational and financial data into real-time dashboards. When production, utilisation, and cost data update automatically, leadership can identify issues early and act before margins are impacted.
In one of our implementations, we reduced executive review cycles by two business days per week and improved strategic decision turnaround time by 40%. We also automated reporting processes, cutting report preparation time from 48 hours to under five minutes.
2. Increased Revenue
Analytics helps oil and gas companies identify underperformance in assets, projects, or customer engagement. By analysing utilisation trends and operational logs, businesses can detect declining usage early and intervene before revenue drops.
In one engagement, our reporting solution contributed to a 20% increase in service revenue after management gained clearer insight into utilisation patterns and acted proactively.
3. Reduced Manual Work And Reporting Time
Automated data pipelines and dashboards remove the need for manual consolidation and spreadsheet reporting. This improves efficiency and allows technical teams to focus on operations instead of administration.
In a recent project, we implemented automated reporting that saved 50 hours per week and improved reporting accuracy by 40%.
4. Improved Data Accuracy And Operational Control
Structured analytics reduces manual data entry and integrates systems through APIs and automation. Predictive maintenance, enabled by oil and gas analytics, helps foresee equipment failures and enables proactive maintenance, reducing costly downtime. This increases reporting reliability and strengthens compliance across departments.
In one of our implementations, we achieved a 95% reduction in manual data consolidation and reduced data-entry errors by 80% after centralising reporting into a single dashboard environment. Improved accuracy strengthened compliance and operational control.
Oil and gas analytics is applied across operations, assets, finance, and technical delivery. From equipment compliance and utilisation to production forecasting and margin control, structured data helps companies manage risk and protect profitability.
Below are practical examples of how our Business Intelligence consultants delivered oil and gas dashboards that are used in real-world scenarios to improve visibility, strengthen operational control, and support better decision-making.
We worked with an oil and gas inspection services company operating across multiple countries and managing over 500 pieces of high-value equipment, some worth £80k+. If a defect or expired calibration is discovered, inspections may be deemed invalid, forcing costly reinspection and risking client trust.
To address this, our data visualization experts built a centralised Power BI dashboard that consolidated calibration records, maintenance logs, equipment status information, and location data, creating an oil and gas analytics solution that can do the following:
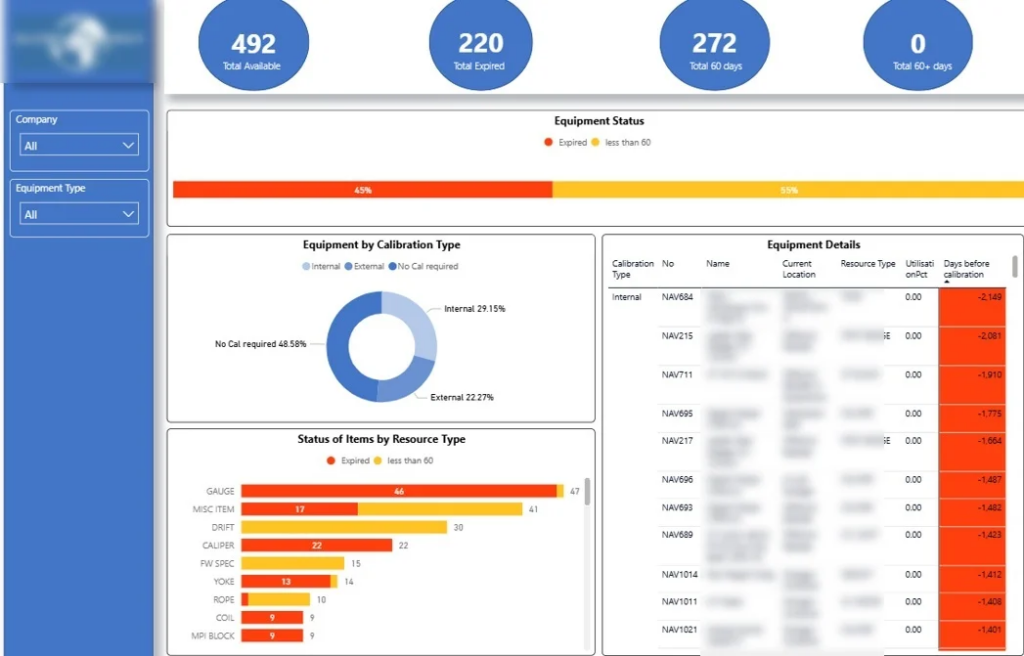
This dashboard allowed management to immediately see which assets pose compliance risk before they are assigned to jobs. Equipment-level segmentation allowed operations teams to focus on high-usage or safety-critical categories first, turning maintenance planning into a structured process rather than reacting to failures.
The dashboard also showed how many assets require calibration and whether capacity existed internally to complete the work. This supported better cost control and turnaround planning. A detailed ranking table lists equipment starting with expired items, enabling teams to act quickly on the most critical assets and ensure inspections are completed with reliable tools.
Our team worked with an oil and gas services company that needed clearer visibility into how equipment was being used across projects and locations. Limited oversight of status categories made it difficult to understand how much of the fleet was actively supporting jobs versus sitting idle.
To solve this, our BI specialists built a structured utilisation monitoring solution that can do the following:
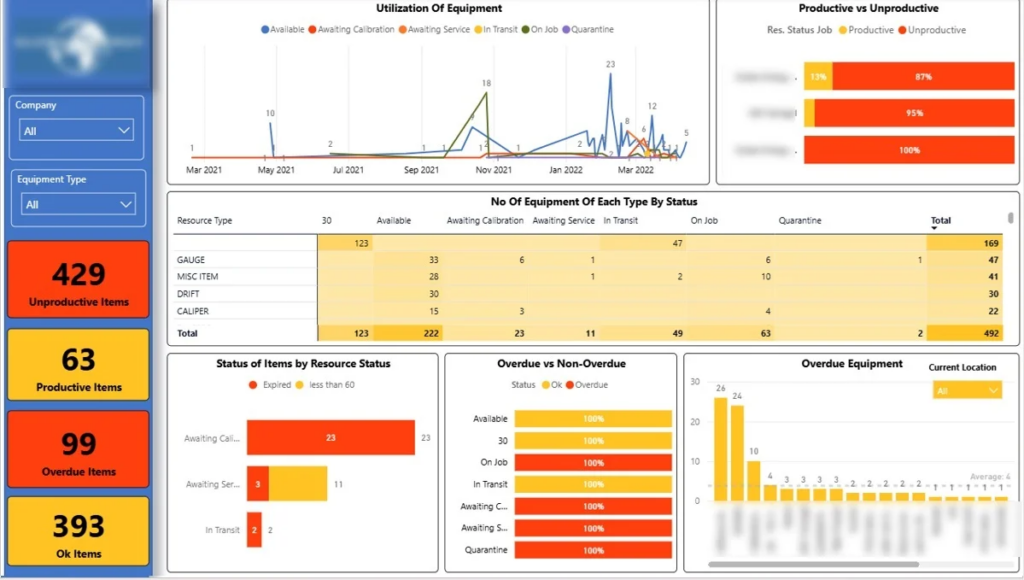
Reviewing equipment status over time shows exactly how much of the fleet is working on jobs and how much is sitting unused. With that breakdown, operations managers can move idle tools to busier locations instead of approving new equipment purchases.
The dashboard also pinpoints where overdue calibration items are located. In one instance, it exposed two overdue tools that were still being used on an active project. The team swapped them out straight away, avoiding compliance issues, project disruption, and unnecessary rework. This level of visibility keeps high-value assets in use, compliant, and focused on revenue-generating activity.
Our Tableau consultants worked with an oil and gas consultancy advising oilfield developers on asset acquisitions. Their services included asset assessment, valuation support, negotiation guidance, and technical due diligence, all of which relied on accurate production forecasting.
To support this, our team built a predictive analytics solution that can do the following:
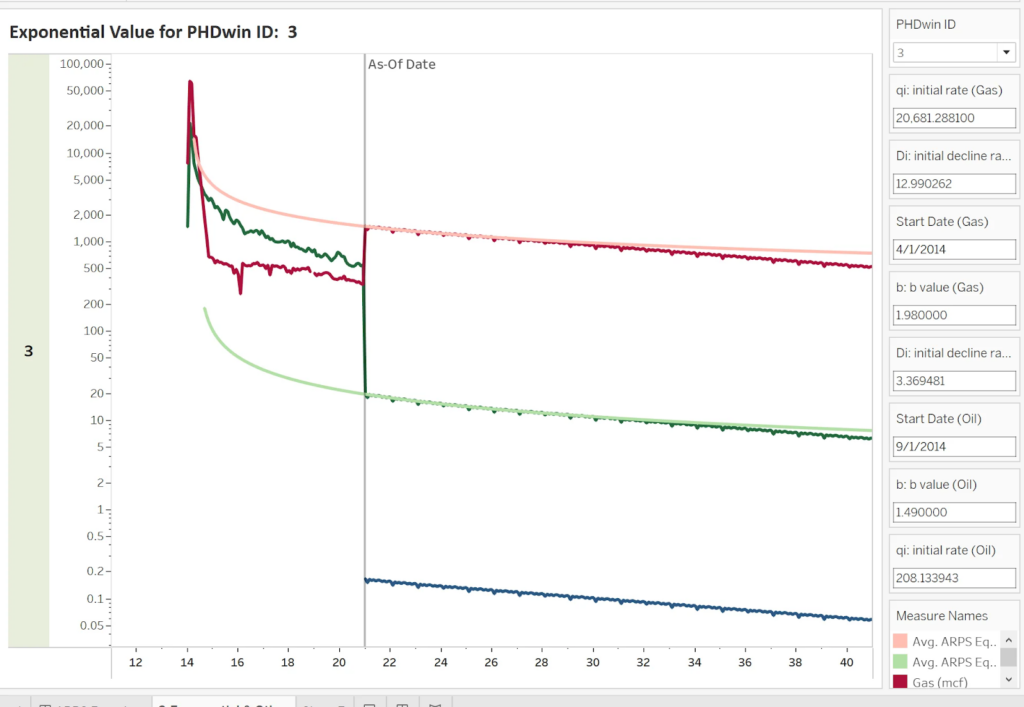
By visualising these forecasts interactively, decision-makers can compare assets on a like-for-like basis and adjust assumptions such as decline rates or pricing scenarios. This structured analysis provides a clearer view of remaining productive life and financial upside.
The result is stronger acquisition decision-making. Leaders can better assess downside risk, avoid overpaying for declining fields, and negotiate from a position grounded in transparent, data-driven production forecasts.
Upstream oil and gas analytics is the use of data to monitor and optimise exploration, drilling, reservoir performance, and field development activities. It focuses on analysing geological data, well performance, drilling progress, production rates, decline trends, and technical project hours to improve operational and financial control. This type of analytics connects subsurface data with cost and production outcomes.
Within this upstream environment, we worked with a multinational upstream oil and gas development company delivering multidisciplinary projects across several countries. Leadership lacked clear visibility into how technical hours were tracking against budget, which made it difficult to control costs and protect margins.
To address this, we built an executive-level dashboard comparing forecasted versus actual hours across projects, creating an upstream oil and gas analytics solution that can do the following:
By visualising planned versus actual hours side by side, management can quickly detect which disciplines are consuming more effort than estimated. This domain-level analysis highlights where margins are being eroded and where future project estimates need refinement.
Country-level views provide leadership with a clear picture of global workload concentration. This insight enabled oil and gas companies to rebalance teams across regions, improve forecasting accuracy, and intervene before cost overruns become irreversible and impact overall project profitability.
We collaborated with an oil and gas consultancy that required stronger oversight of revenue, billable utilisation, and cost recovery across its teams.
To improve financial control, our Power BI specialists built a financial performance monitoring solution that can do the following:
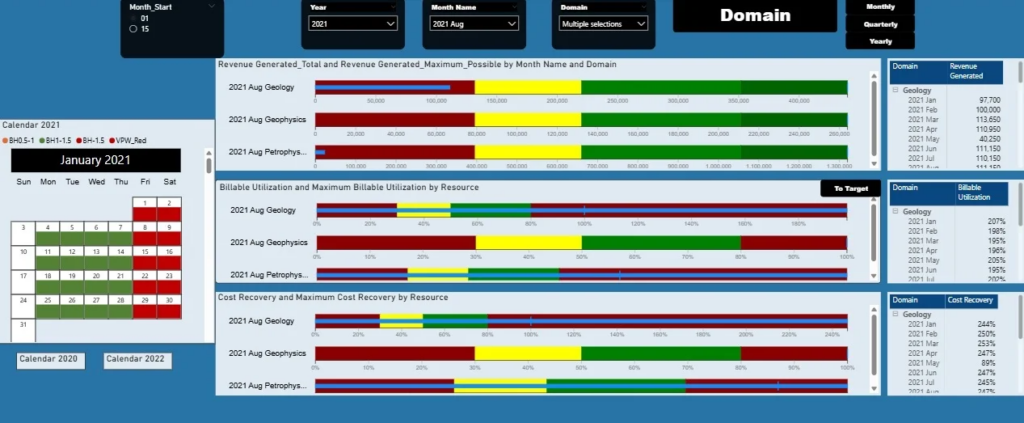
By visualising these metrics together, management can quickly see whether teams are recovering their full cost and converting planned hours into billable revenue. Central bullet charts compare actual performance against best-case targets, making underperformance immediately visible and enabling early intervention through staffing, pricing, or scope adjustments.
Our client lacked a clear way to see how project complexity was affecting delivery hours. Some projects were running over on time, but leadership had no consistent method to compare complexity drivers against the actual effort being recorded.
To provide clarity, our business intelligence experts built a benchmarking solution that can do the following:
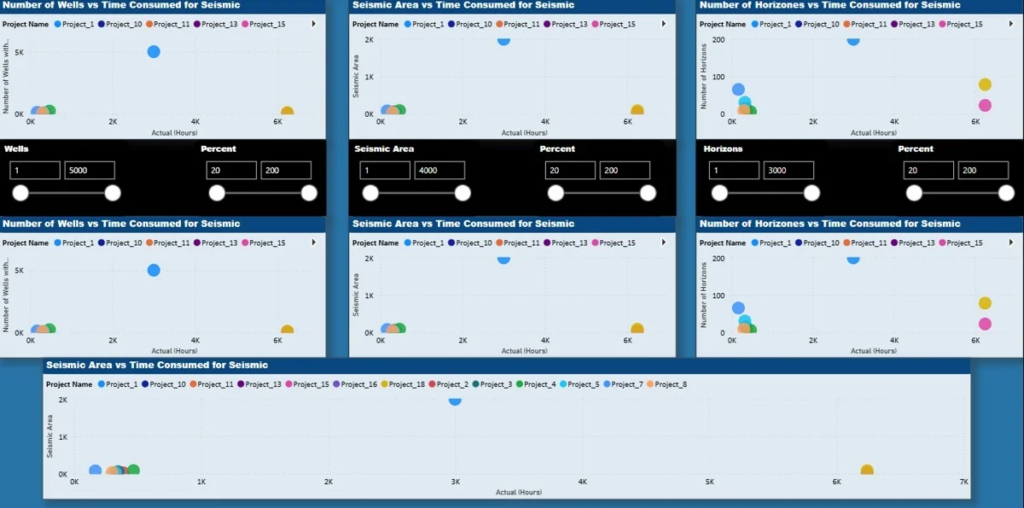
By visualising these relationships side by side, management can quickly identify outliers where hours significantly exceed what complexity indicators would suggest. This structured comparison helps leaders question estimation assumptions, correct underpriced or underestimated work, and prevent inefficient projects from quietly eroding profitability.
Midstream oil and gas represents the central link between upstream production and downstream refining and distribution. It covers the transportation, storage, processing, and handling of oil, gas, and refined products through infrastructure such as pipelines or terminals.
Midstream oil and gas analytics focuses on monitoring and optimising this infrastructure by analysing throughput, capacity utilisation, equipment performance, energy consumption, and product losses, ensuring hydrocarbons move efficiently across the value chain.
We worked with a midstream operator managing multiple pipeline segments and storage facilities across regions. Despite moving large volumes daily, leadership lacked a clear, structured view of infrastructure performance, cost efficiency, and recurring operational issues. Reporting existed, but it was fragmented and not decision-ready.
To bring structure to their reporting, our data analytics specialists built a KPI-based dashboard that tracks:
Once the KPIs were standardised and brought into one dashboard, management began reviewing them weekly. Throughput versus capacity tracking revealed underutilised pipeline segments, enabling flow rebalancing, while downtime analysis highlighted recurring pump station issues and improved maintenance planning.
Cost-per-barrel and energy metrics gave leadership clearer cost visibility at route and facility level. Product loss tracking increased accountability across the network. With structured KPIs in place, the company improved reliability, utilisation, and overall infrastructure profitability.
Downstream oil and gas analytics refers to the structured analysis of data across refining, processing, distribution, and sales operations. It concentrates on evaluating refinery efficiency, product yield by stream, equipment performance, energy intensity, and margin per barrel. By connecting plant performance with operating costs and commercial outcomes, downstream oil and gas analytics helps maximise the value extracted from crude feedstock while maintaining safety standards, controlling energy consumption, and protecting refining margins.
We worked with a downstream operator managing refining and distribution assets across multiple facilities. Although production volumes were high, leadership lacked a consolidated view of refining efficiency, operating costs, and equipment performance. Reports were generated across departments, but they were not aligned into measurable performance indicators.
To bring structure to performance management, our data visualisation experts a dashboard that tracks:
This dashboard allowed refinery leadership to identify which units were underperforming and where costs were rising. Operations managers could immediately see which processing units were consuming excess energy and adjust settings to improve efficiency.
By connecting operating cost and margin per barrel directly to plant performance, finance and plant managers were able to act quickly on underperforming units. This gave both operational and commercial teams tighter control over refinery efficiency and downstream profitability.
Start by defining clear objectives. Decide what you want to improve, such as asset utilisation, project margins, production forecasting, or compliance control. Clear goals ensure analytics supports measurable business outcomes.
Next, assess your current data landscape. Identify where relevant data sits, whether in ERP systems, production databases, maintenance logs, or spreadsheets. Clean and structure this data into a centralised model so reporting is consistent and reliable.
Choose scalable analytics tools and build dashboards aligned with real business decisions. Focus on automation to reduce manual reporting and ensure data stays current.
Finally, roll out analytics in phases. Start with a high-impact area, measure results, and refine based on feedback. Continuous improvement ensures the system remains relevant as operations evolve.
Building effective oil and gas analytics requires a combination of technologies. Most organisations use database infrastructure, ERP systems, data transformation tools, advanced modelling languages, and visualisation platforms together. The right stack depends on operational complexity, data volume, security requirements, and reporting needs.
Below is a structured overview of commonly used software grouped by function.
These systems store structured operational and financial data and form the foundation of modern oil and gas analytics. For a closer look at how robust reporting architectures are designed and delivered, see our Business Intelligence Data Warehouse services where we outline how scalable analytics environments are built.
Widely used in oil and gas environments for structured data storage, especially in on-premise or hybrid setups.
Key Capabilities:
Deployment: On-premise and Azure Cloud
A scalable cloud data warehouse designed for large, complex datasets across distributed organisations.
Key Capabilities:
Deployment: AWS, Azure, Google Cloud
A serverless cloud data warehouse suited for analysing high-volume production and operational datasets.
Key Capabilities:
Deployment: Google Cloud Platform
A properly structured data warehouse brings together production data, project hours, maintenance logs, and financial metrics into one reliable reporting layer. For organisations modernising their reporting environment, our data warehouse consulting supports the design and implementation of secure platforms aligned with operational needs.
These platforms generate and manage financial, operational, and asset-related data.
Commonly used for finance, procurement, supply chain, and asset lifecycle management.
Key Capabilities:
Deployment: On-premise and cloud
A cloud-based ERP system used for financial management and project accounting.
Key Capabilities:
Deployment: Cloud
Combines ERP and CRM functionality and integrates directly with Microsoft analytics tools.
Key Capabilities:
Deployment: Cloud
These tools prepare, clean, and structure data before it is used in dashboards or models.
Used to transform and standardise data from multiple sources.
Key Capabilities:
Deployment: Desktop and cloud (Microsoft ecosystem)
These tools present operational and financial data in interactive dashboards.
Widely used for executive dashboards, asset monitoring, production tracking, and financial analysis.
Key Capabilities:
Deployment: Web, Desktop (Windows), Mobile
Suited for advanced visual analytics and scenario-based reporting.
Key Capabilities:
Deployment: Web, Desktop (Windows and Mac), Mobile
For a deeper understanding of flexible reporting, check our guide on ad hoc reporting tools to learn how to design interactive dashboards, enable custom data exploration, and improve operational reporting efficiency across your organisation.
These tools support forecasting, statistical modelling, and predictive analytics.
Commonly used for production forecasting, decline curve modelling, and predictive maintenance.
Key Capabilities:
Deployment: Cross-platform
Used for statistical analysis and reservoir modelling.
Key Capabilities:
Deployment: Cross-platform
Oil and gas analytics requires more than technical tools. It depends on clear governance, consistent KPI logic, and alignment with operational priorities. Applying the right principles from the start ensures analytics supports performance, accountability, and long-term profitability.
Align Analytics With Measurable Business Outcomes
Analytics should support clear operational and financial priorities. Whether the focus is increasing production efficiency, reducing downtime, improving utilisation, or protecting project margins, dashboards must be built around outcomes that matter to the business. When reporting is tied directly to profitability, reliability, or cost control, it becomes a decision tool rather than a passive display of data.
Establish Clear Data Ownership And Responsibility
Every KPI should have a defined owner who understands how it is calculated and what actions it drives. Production metrics, cost indicators, utilisation rates, and safety figures must not sit without accountability. Clear ownership ensures issues are addressed quickly and prevents dashboards from becoming informational rather than operational.
Standardise KPI Definitions Across Teams
Inconsistent definitions create confusion and weaken confidence in reporting. Metrics such as operating cost per barrel, throughput, utilisation, or margin should be calculated the same way across regions and departments. A shared KPI framework ensures leadership reviews one consistent version of performance and avoids internal disputes over numbers.
Build On A Structured And Reliable Data Foundation
Strong visualisation cannot compensate for poor data structure. Oil and gas analytics should be built on a centralised data model with automated integrations and validation rules. When operational systems, financial data, and technical inputs are structured properly, reporting becomes faster, more accurate, and easier to scale.
Integrate Analytics Into Everyday Decision-Making
Dashboards deliver real value when they are used consistently in management routines. KPIs should be reviewed in operational meetings, project reviews, and financial discussions. When analytics is embedded into standard workflows, it strengthens discipline, improves response time, and supports sustained performance improvement across the organisation.
Oil and gas companies often struggle with fragmented data spread across ERP systems, production databases, maintenance tools, and spreadsheets. When systems are not integrated, reporting becomes manual, slow, and inconsistent.
Big data analytics introduces additional complexity. Modern oilfields generate massive volumes of sensor data, seismic files, drilling logs, and historical production records. Without scalable infrastructure and proper data architecture, organisations face challenges storing, processing, and analysing this information efficiently. Large datasets can overwhelm legacy systems and delay insight generation.
Data quality is another common issue. Different teams may define KPIs in different ways, which leads to conflicting numbers and reduced trust in dashboards. Without standardised definitions and validation rules, analytics cannot reliably support decision-making.
Manual reporting processes and unclear data ownership further limit effectiveness. Successful oil and gas analytics requires structured data architecture, automation, and clear governance to ensure reporting is accurate, timely, and widely adopted across the organisation.
Oil and gas analytics is moving from retrospective reporting to real-time optimisation and predictive control. As data volumes grow across upstream, midstream, and downstream operations, companies are shifting toward continuous monitoring and faster operational response.
Digital twins are enabling virtual models of wells, pipelines, and refineries that mirror live conditions. This allows teams to test scenarios, evaluate risks, and optimise performance without disrupting physical operations.
Edge computing is also increasing responsiveness by processing data closer to the source. Field sites and processing units can detect anomalies instantly and adjust operations in real time, improving safety and efficiency.
At the same time, AI-driven predictive analytics is strengthening maintenance planning, production forecasting, and energy optimisation. Combined with growing ESG and emissions reporting requirements, analytics is becoming central to operational control and long-term competitiveness in the oil and gas industry.
Oil and gas analytics is no longer optional. Whether you are managing high-value equipment, forecasting production, controlling project margins, or evaluating acquisitions, structured data gives you the visibility needed to act early and protect profitability.
When operational, technical, and financial data are connected properly, leadership gains a clear view of performance across assets, projects, and regions. Decisions become faster, risks are easier to detect, and margins are easier to protect.
If you want to build a custom oil and gas analytics dashboard tailored to your operations, contact us. Our team will help you consolidate your data, design the right metrics, and deliver reporting systems that support real business decisions!
![]()
![]()
![]()