
The month-end reporting involves checking that your financial data is correct, then summarising it into a management report for high-stakes decisions, planning, and audits.
When I first joined Autodesk as a financial analyst, month-end reporting was the most demanding part of my role. During the month-end close, sales teams were pushing hard to hit their quotas and needed near real-time visibility into their performance. As a result, I found myself refreshing reports up to six times a day, rather than just once.
While it’s possible to handle month-end reporting manually in Excel, the process is extremely time-consuming, prone to errors, and takes valuable time away from more strategic and innovative analysis.
Our business intelligence consulting services have helped 600+ companies automate their month-end close financial reporting. In this article, we will explain how you can do the same, with 6 fully automated templates that you can start using right away.
The purpose of month-end financial reporting is to review the financial performance of your business during the month. As a financial analyst, you check that all income, expenses, payments, and balances have been recorded correctly, then you extract all the data into Excel reports. These reports are typically used to calculate the commission for the sales team, measure actual performance vs budget, and adjust the forecast for the end of the year.
Companies we’ve helped automate month-end reporting use it in a variety of ways that could be just as valuable for your business:
Month-end reporting gives you a clear view of whether sales are tracking against targets or starting to fall behind. This visibility allows finance teams to flag issues early, support sales leadership with accurate data, and help course-correct before small gaps turn into missed targets. For finance, it means more accurate revenue forecasting and more efficient financial planning.
Accurate month-end reporting ensures sales commissions are calculated correctly and paid on time. For finance teams, automation reduces manual calculations, eliminates disputes over numbers, and creates a clear audit trail. This not only saves time but also builds trust between finance and sales by ensuring everyone is working from the same data.
End-of-month reporting helps monitor whether teams are spending within approved budgets and highlights any overspending early. Finance teams benefit by being able to address cost issues proactively, rather than chasing explanations weeks or months later. Early visibility makes it much easier to manage cash flow and enforce budget discipline across the organization.
Consistent, high-quality monthly reporting lays the groundwork for a much faster quarter-end and year-end close. For finance teams, this means fewer late nights, less stress, and fewer adjustments during critical reporting periods. When month-end processes are automated and reliable, closing the books becomes a predictable routine instead of a fire drill.
From our experience, businesses like yours can cut down month-end reporting time and errors by automating these three things:
This involves connecting tools like your payment platforms, ecommerce system directly to your financial software, such as QuickBooks. When this link is in place, every sale, refund, or invoice shows up correctly and consistently.
You can achieve this automation using ready-made integrations if the tools you use already support them. If they do not, you can develop a custom integration by creating it yourself or by hiring a data integration consultancy.
The next step is to automate the data flow from your financial system to your reports. This is usually achieved by integrating your reporting tool, say Power BI, to your financial software and scheduling automatic data refresh. When the data is refreshed, you can automate the data transformation steps in SQL or Power Query.
At Vidi Corp, we have built several ready-made data connectors, including QuickBooks, Xero, and Zoho Books. These integrations automatically extract the data into an Azure SQL Server database multiple times a day. You can then connect the database to Excel, Tableau, Power BI, or a different reporting tool of your choice.
This part brings everything together and is the biggest timesaver for your team. Here, you design your month-end reports once in reporting tools like Power BI or Tableau, then set them to refresh automatically during the day. Your reports update themselves as new data comes in, without any manual work. We have written another article about automated financial Power BI reports where you can see what these reports look like.
Setting up your report involves connecting your data, writing formulas for automatic transformations and metrics to be displayed, designing the UI/UX of the report, and extras like filters, access control, etc. It’s a one-time effort that will make your month-end reporting become a review task, rather than a rush-hour build task.
Our BI consultants have designed 2 reports that already have all these formulas in place. You can simply connect your QuickBooks Online data to them and schedule automatic data refresh:
QuickBooks report template for Power BI
QuickBooks report template for Tableau
The first 5-month end reports that we are showing below are our free templates that automatically connect to QuickBooks Online. You can download them to automate your month-end reporting.
The last 2-month-end reports in this section are examples of our work for other clients. We included them in this article to demonstrate that this reporting can be automated. If you need to create similar month-end reports, please contact us now to start your reporting automation project.
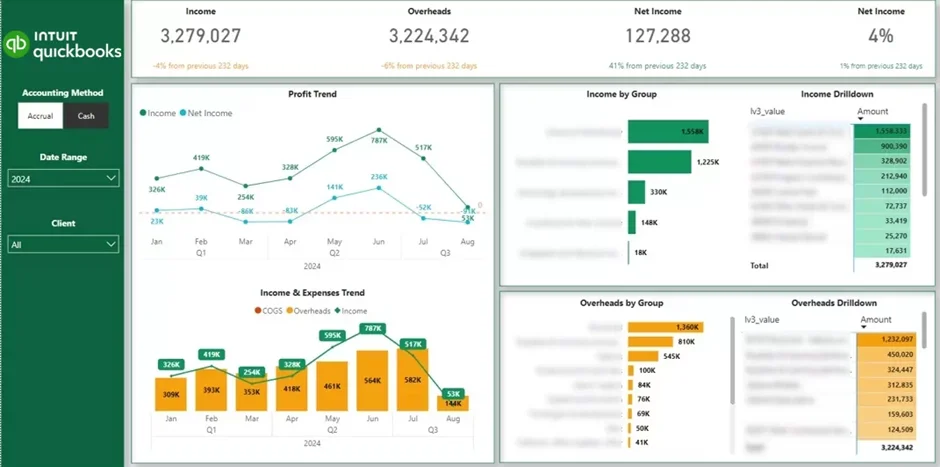
The P&L report is relevant to businesses in all industries and all sizes. It is typically used by business owners to understand their financial performance without going into much detail.
The P&L month-end report makes it easy by visualizing income and expense trends from month to month. It also highlights profitability trends through gross and net profit margins. In addition, it helps identify the largest revenue and overhead transactions, making it clear what is driving overall performance.
Our Power BI profit and loss (P&L) report template visually summarises income, overheads, net income, and profit margin. It shows the trends of the listed metrics over time, breaks them down by category, and lets you drill down into the exact transactions in the tables on the right.
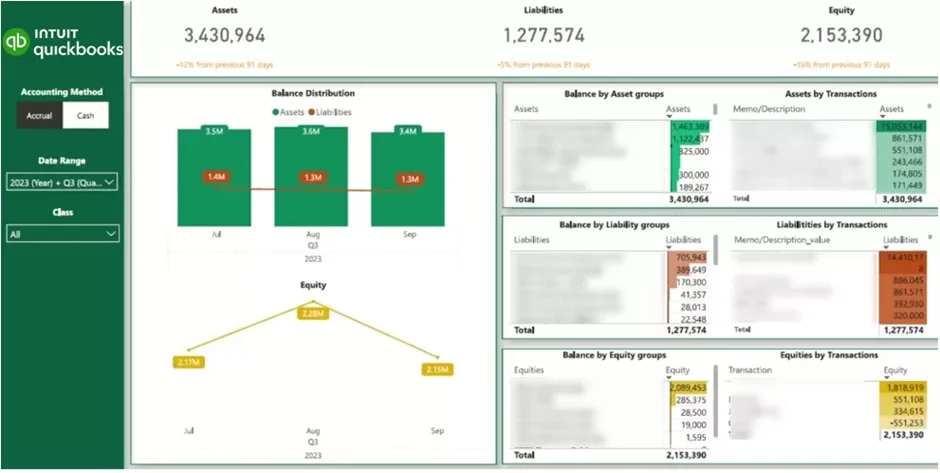
The balance sheet report is most relevant to businesses in industries like construction and real estate. These companies manage big loans, long-term mortgages, and assets that appreciate over time — so understanding their Balance Sheet metrics isn’t optional.
Our free balance sheet report template presents a view of your assets, liabilities, and equity on one page. It helps companies track their current cash position and estimate how many months of coverage they have. The balance sheet month-end report also helps to track borrowing levels and major creditors to manage debt with confidence.
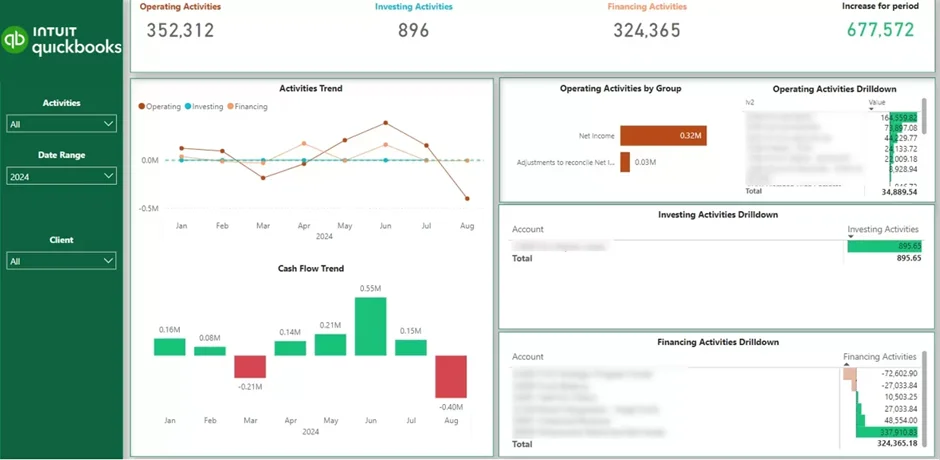
The next thing companies usually worry about after their P&L is their cash flow. It is well known that many companies go out of business because of a lack of cash, not a lack of profit.
With the cash flow report template above, you can see where cash is coming from and where it is going each month. The report breaks this down into day-to-day operations, investments, and financing, so you understand what activities are affecting your cash position.
This report allows businesses to review their month-end cash position, assess whether their financial position is improving over time, and ensure they have sufficient cash on hand to support ongoing operations.
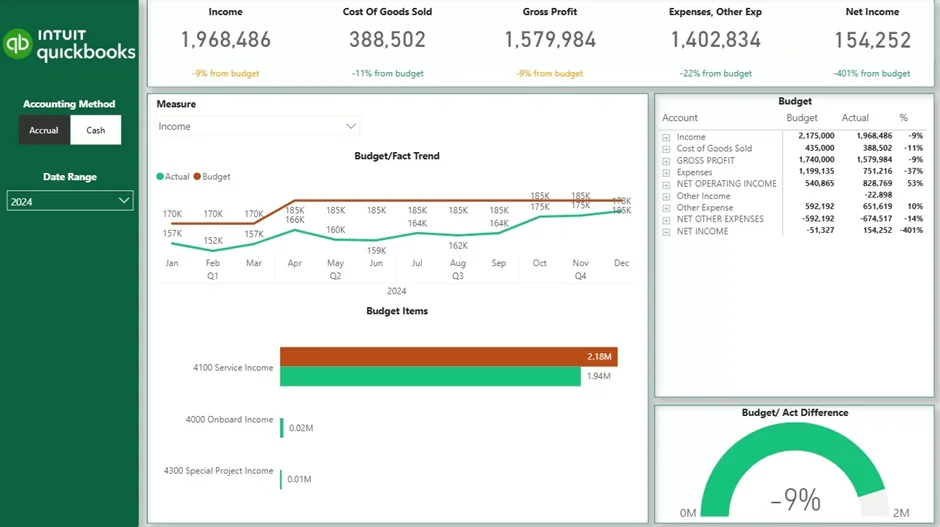
Finance teams typically set monthly budgets at the start of the year and then need a reliable way to track actual results against those plans.
Using our actuals vs. budget month-end report makes it easy to compare real performance against budget for every line of your P&L. It helps you see whether revenue is meeting target or falling short, track monthly trends, identify gaps, and pinpoint which P&L categories are driving the variances.
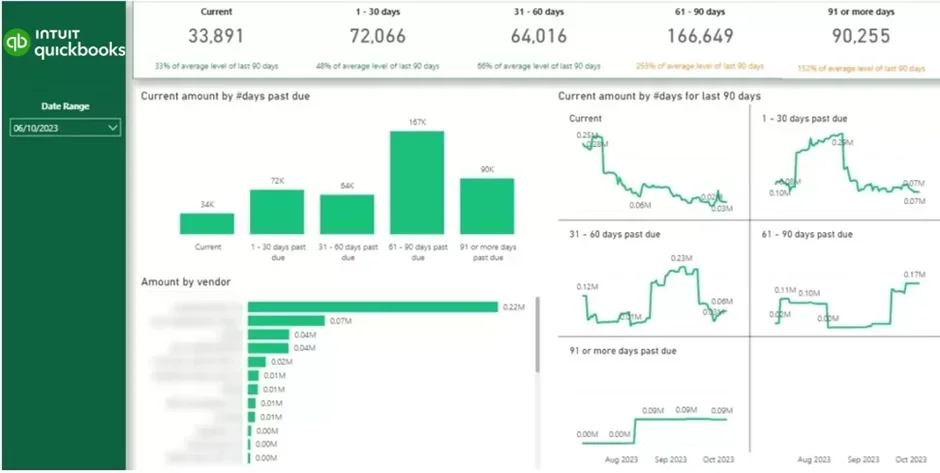
The accounts receivable month-end report above shows you which client owes you money and how long their invoices have been outstanding.
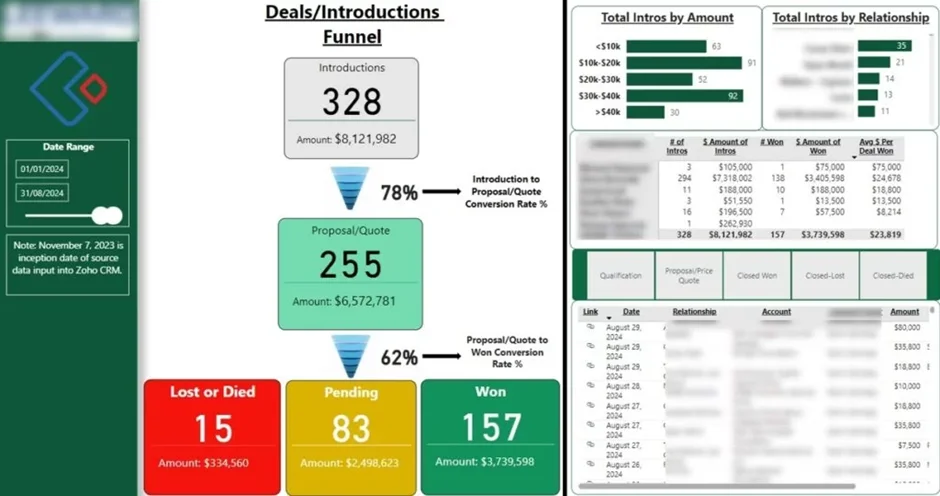
Our Power BI consultants created the month-end sales report above to track how deals progress through the sales funnel. It provides insights into conversion rates at each stage, total deal value, and revenue that is won, pending, or lost. This allows you and your team to see what’s working well in your sales process and identify where deals may be stalling.
Sales teams can use our report during month-end reviews to evaluate individual performance, see which reps are handling the most leads, and identify who is converting deals most effectively.
The report also provides a clear view of which deals are currently at each stage of the sales funnel, making it easier to forecast revenue for the upcoming month.
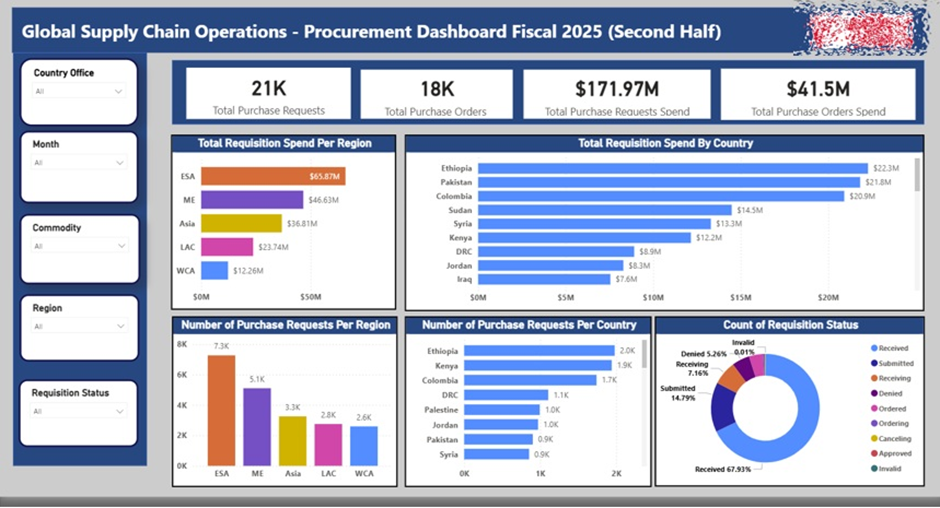
The expenses month-end report is mainly used by the procurement team to ensure that expenditure is staying under control. The data usually comes from procurement systems like SAP Ariba that contain the data on every purchase order.
Our business intelligence consultants created the expenses month-end report above for a global charity using the data from SAP.
The expenses report compares the approved purchase amounts to the actual spending. This analysis is broken down by country, region, and team to catch overspending early and take action.
These challenges are exactly what automation helps you avoid:
Manually preparing your reports in spreadsheets causes little mistakes to slip through the cracks, i.e., a wrong formula or copy/paste error can cancel the whole report.
Without a standard template or a unified process, everyone’s off doing their own thing. This makes it hard to get a vivid picture of what’s going on in your business financially, or trust the numbers right off the bat.
If the month-end reporting work is piled up and done manually, your team might have limited time to produce trustworthy reports before the month ends.
The data for preparing your month-end reports may be in one, two, or more systems and sources. Manually downloading data from one place, copying and pasting more from another, and piecing it all together could lead to inconsistencies and slow down your month-end close.
Month-end reporting does not have to be stressful, slow, or error-prone. When your data flows automatically, your reports stay accurate, and your close process becomes predictable and calm. You spend less time fixing numbers and more time helping your team optimise performance based on data.
If you want a head start, reach out to Vidi Corp for the templates above or a consultation. We can help you design and implement an automated month-end close that fits your systems, your team, and your goals.
![]()
![]()
![]()