Did you know it’s possible to use a free QuickBooks Power BI template to visualise your data in just 5-10 minutes? This template connects to one or multiple accounts automatically and visualises the P&L, Balance Sheet and Cash Flow Statements.
Why reinvent the wheel when you can use our professionally designed QuickBooks Power BI template? We used to charge $3000 for this template and now we offer it for free! The setup requires no coding knowledge – simply connect your QuickBooks Online data to a ready-made Power BI template.
Before you begin the installation process make sure that you have all the right tools in place. You will need:
1. A windows computer
2. Power BI Desktop (which you can download for free from the Microsoft website)
3. Access to our Power BI QuickBooks Online Connector
Our template is specifically designed to work with our Power BI QuickBooks Online connector. You use this connector for free for 14 days without leaving your payment details.
Please note that our template will not work with the native QuickBooks Online Power BI connector due to the differences in the data structure.
Please follow this technical guide for installing our Power BI QuickBooks Online connector
Once your QuickBooks Online account is connected through our portal you will need to press the “send database connection string” button.
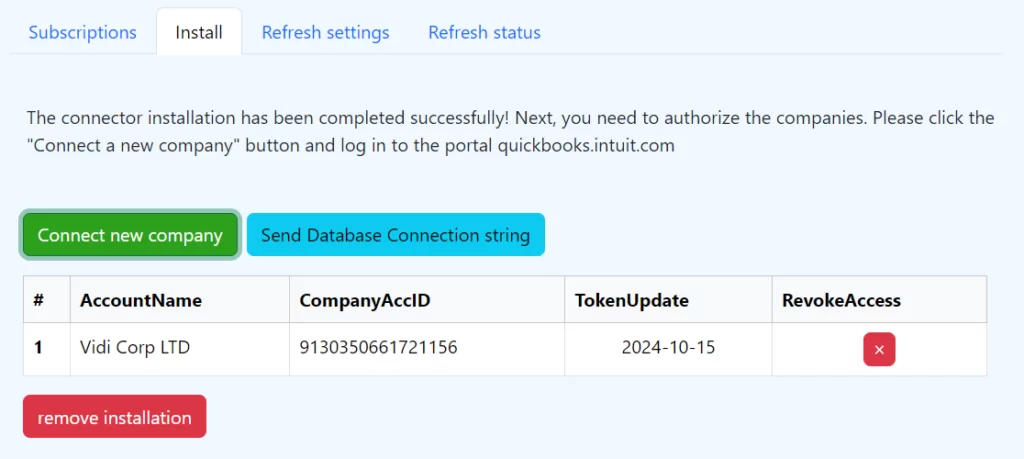
You will get an email to your registered address with the details you need to connect to the Azure SQL Server database. You will also find our free QuickBooks Power BI template in the attachment. Simply download it to your computer.

Note: please make sure that you are using a Windows computer with Power BI Desktop installed. Please refer to this guide to install the Power BI Desktop if you need to.
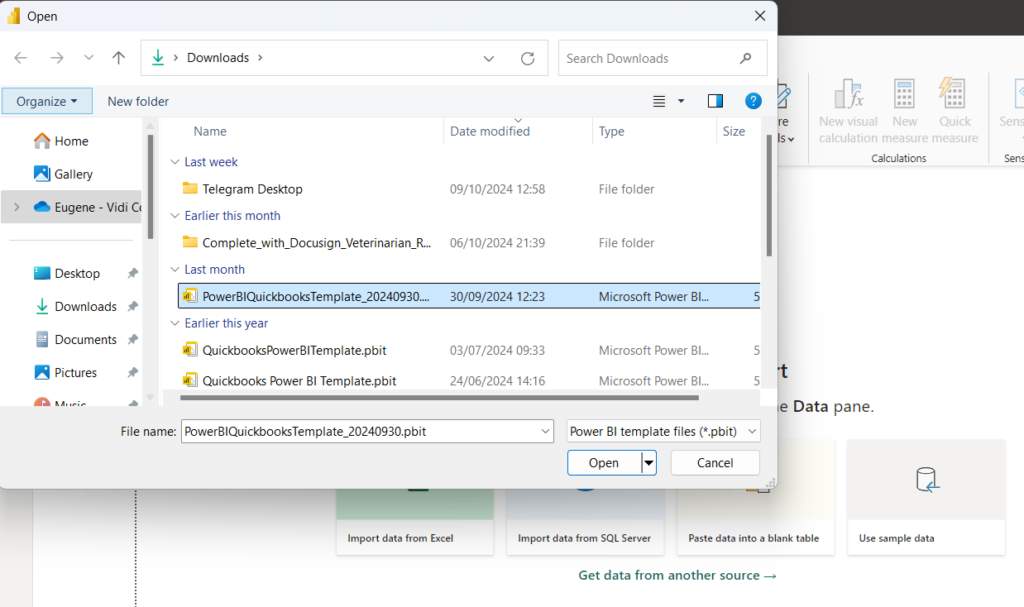
Open Power BI Desktop, click file, import and “Power BI Template”

You will then be able to see all the Power BI templates that you have
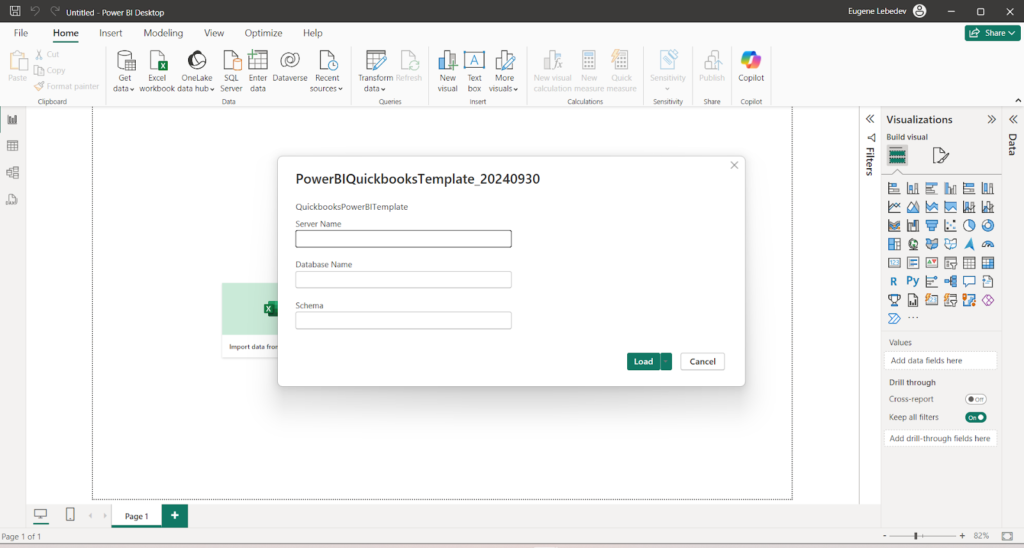
Your Power BI template will then be loaded to Power BI. All that is left to do is enter your server name, database name and schema. You will be able to take this from the same email where you found our QuickBooks Power BI template.Enter those details into the relevant fields and click Load.
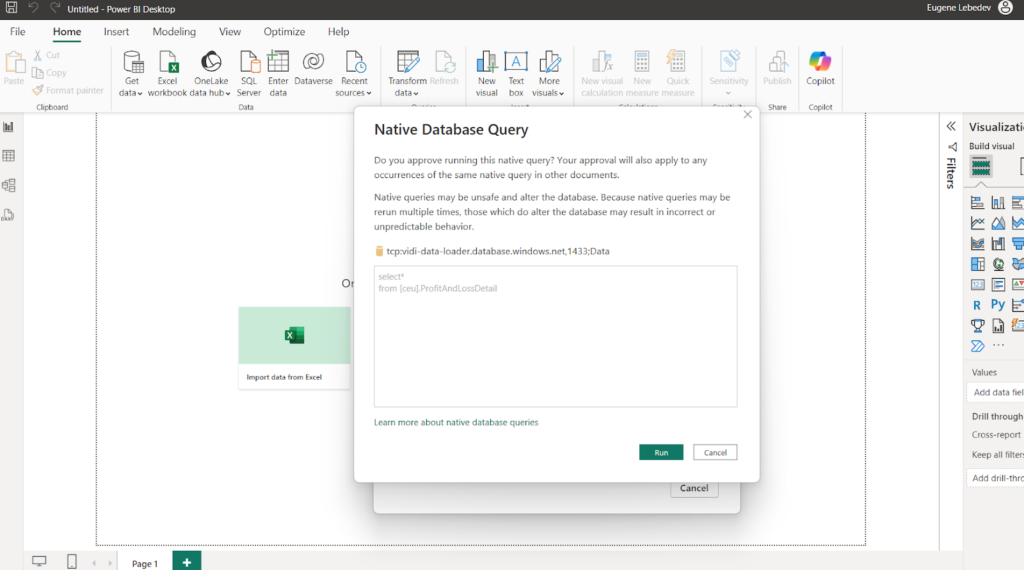
A new window will pop up several times asking you to confirm that you want to run the database queries that extract the data. Press “Run” for all of them.
Once the queries finish running, you will be able to view your data visualised in Power BI.
You can read more about the pages inside of our QuickBooks Power BI template.
Our free QuickBooks Power BI template includes 3 sections:
Each section delivers key analytics while maintaining accounting structure and logic. Let’s explore it in detail.

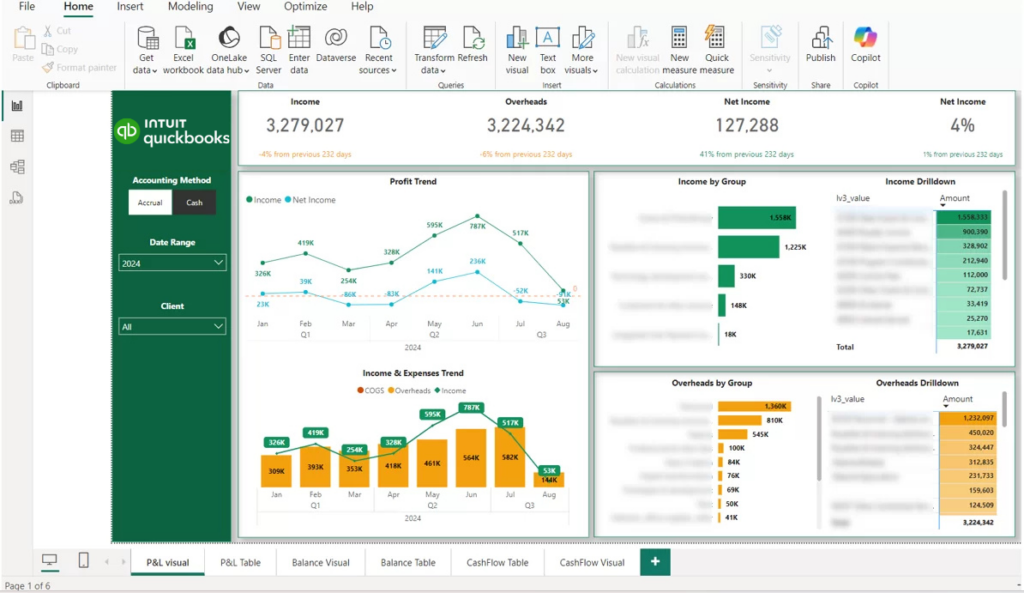
The customizable P&L tab displays trends for income, net income, COGS, overheads and more. You can break down income and overheads by group and click to drill down into subgroup trends. This granularity helps pinpoint performance drivers and problem areas.
Filters allow you to analyze by cash or accrual method, year, quarter or month. You can compare across date ranges and accounting methods to reveal insights. If you connect multiple QuickBooks Online companies, choose which companies to display individually or consolidated.
Cards summarize totals and percentage changes between periods for key metrics like net income. Visualize margins, cost management and more overtime.
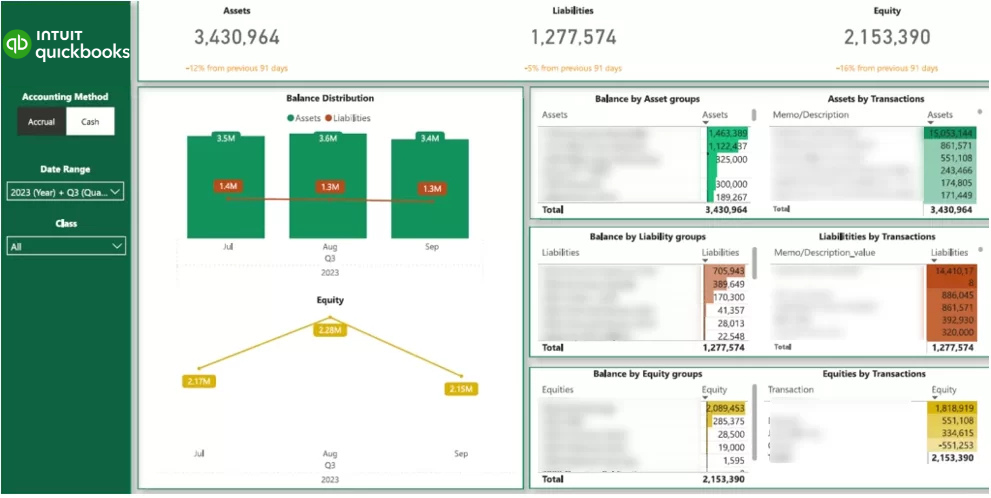
The balance sheet tab visually tracks assets, liability and equity balances. See which transactions and activities drive changes to your financial position. Customize views by showing or hiding transaction line item details.
The tabular layout balances assets and liabilities with equity as required by accounting standards. This integrity check helps identify data issues before they affect reporting.
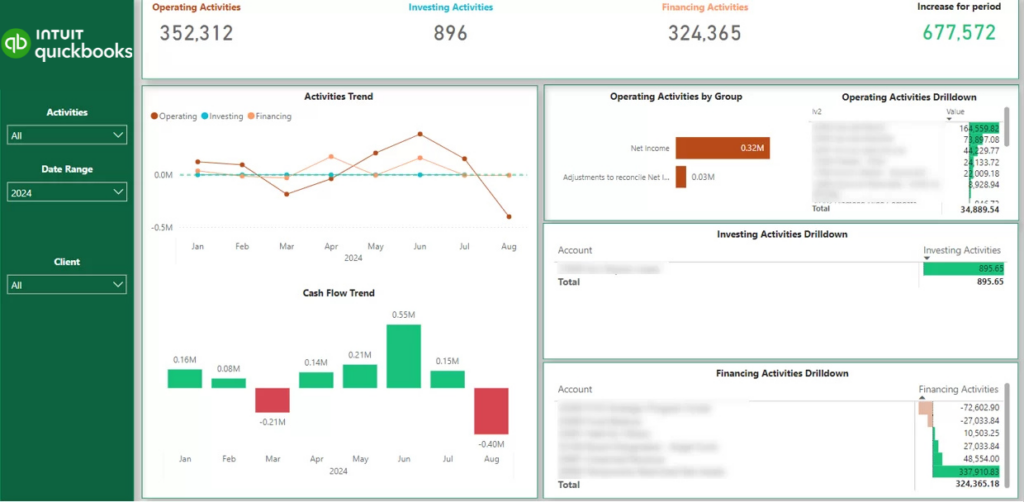
Cash flow visualization tab illustrates total increases and decreases by month. View operating, investing and financing activities to pinpoint positive and negative periods.
The ability to quickly see monthly cash timing enables better short term decisions. Identify seasonal dips to plan credit line needs, or peaks to optimize cash investing for growth.
With your QuickBooks data now in Power BI, what insights can you unlock?
The main functional benefits are:
Now that you have you template you can analyse the data inside of it to answer questions like:
You can also analyse the expense ratios across departments to identify waste. Which divisions generate the strongest returns on spending? Are certain accounts more efficient seasonally?
Finally you can evaluate the cash conversion cycles by revenue source. How long does it take to collect invoices? How might this fluctuation affect borrowing needs?
Segment customers, products and campaigns by profitability. Identify high margin drivers to double down on and loss leaders to eliminate. Perfect pricing and promotional strategies.
Fine tune inventory, purchasing and fulfillment to balance costs and revenue. Benchmark department spending for clearer budgeting. Enhance productivity.
Executives Spot high level trends plus drill down to transaction details. Flexibly filter for any business question with unified data. Assess performance daily instead of waiting for month end reports.
Using the right QuickBooks Power BI template eliminates the headache of mapping QuickBooks data to produce analytical reports. Instead of wrestling with data structures, calculations and visual design, simply connect your books for professional Power BI dashboards in minutes.