The client is an investment company that invest in bonds. They needed a Tableau dashboard to monitor some key financial metrics to monitor the market.
Data Source
Excel
Analysis Tool
![]() Tableau
Tableau
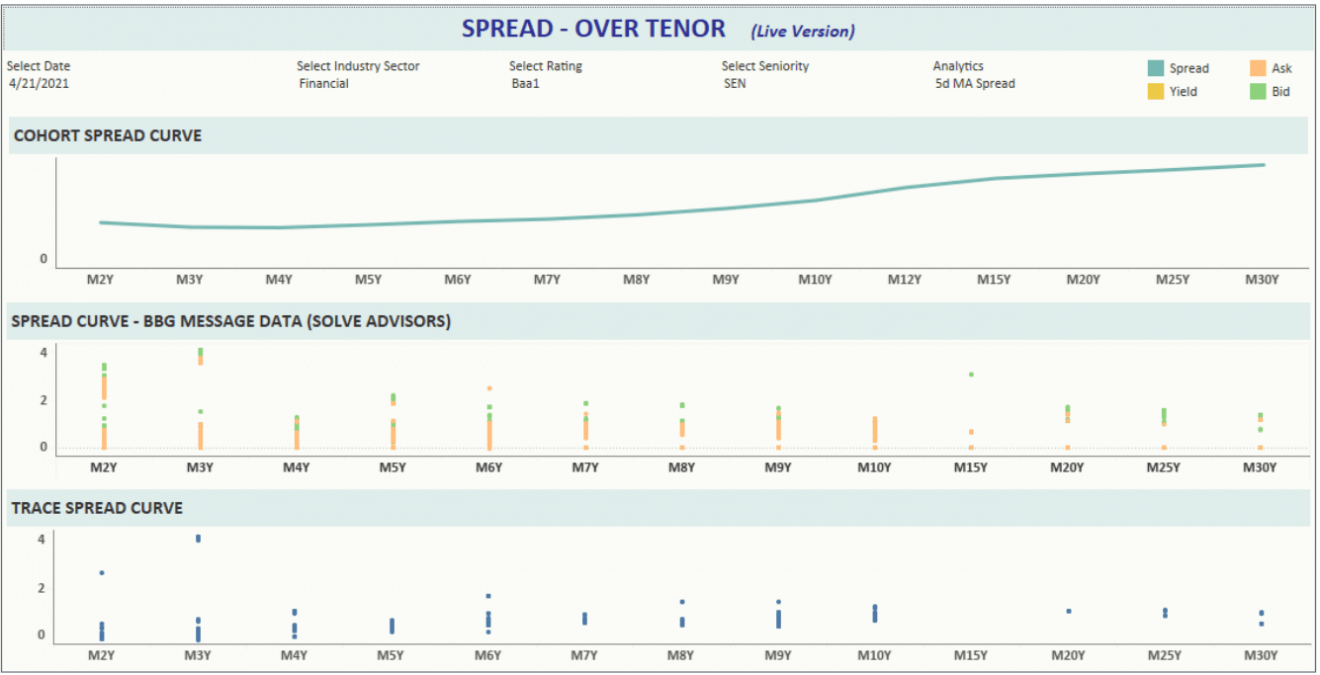
Daily trends for spread, yield, ask and bid prices are visualised.
Filters on top enable user to select tenor, sector, bond rating and seniority.
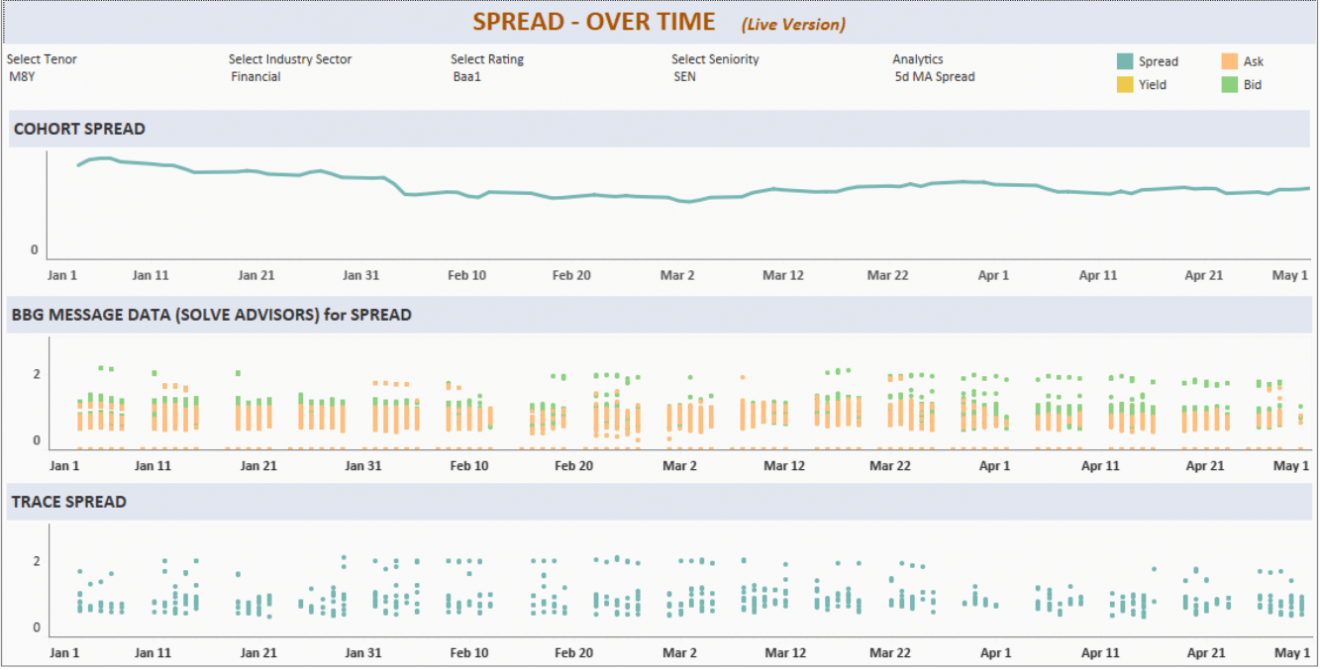
Cohort-level analysis is performed on this page where spread, ask and bid prices are visualised by cohort

Support
All the support you need – when you need it. From 1-hour quick fix support to longer-term partnership that drives your business forward.

Consultancy
Advanced data thinking, creative ideas and the best Power Platform practices to unlock the true potential of your business data.

Training
Succeess shouldn’t be a one-off. When we train you teams user adoption surges and your Power Platform results radically improve.
![]()
![]()
![]()