The financial organisation of a service company wanted to better visualise their financial results.
Data Source
Google Sheets
Analysis Tool
![]() Tableau
Tableau
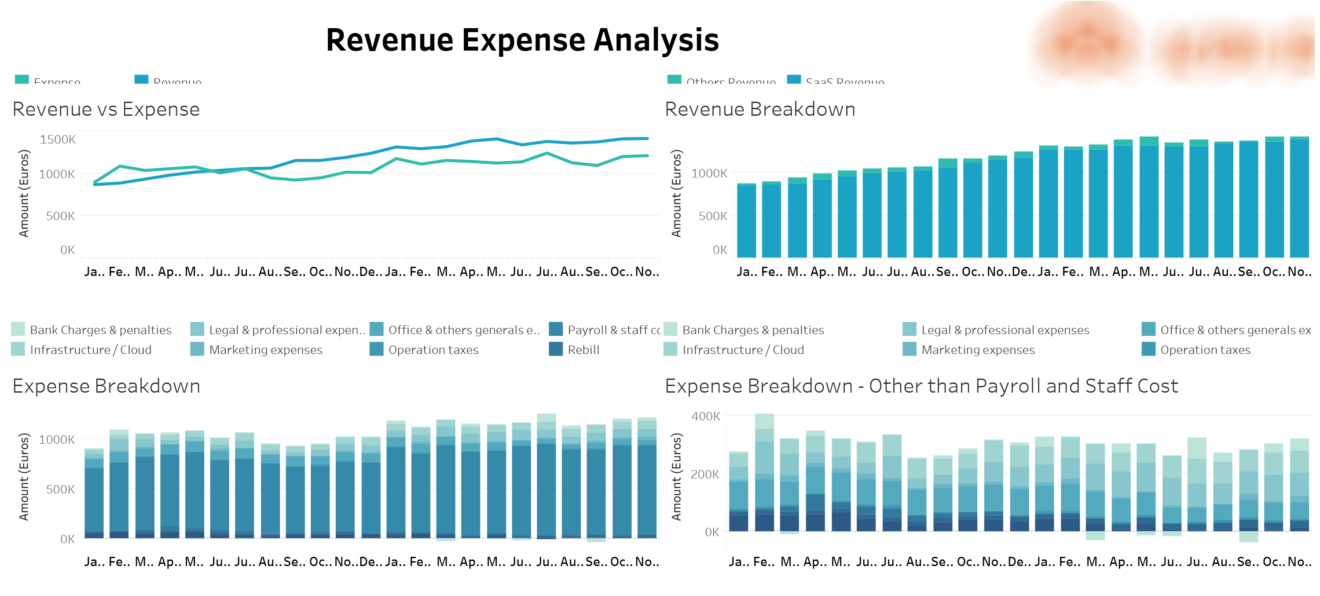
The monthly trends for revenue and expenses are shown. Those are also broken down by category.
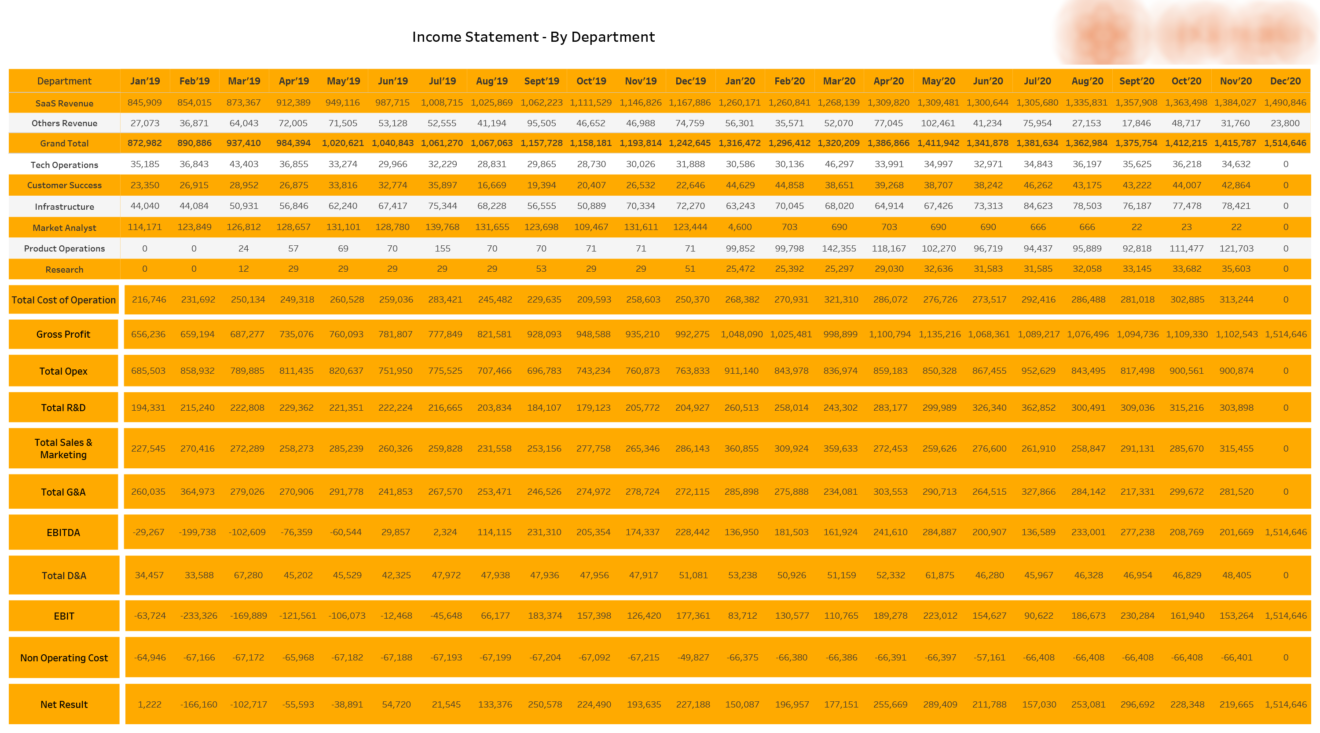
Monthly income statement is created to show breakdown of each line of P&L by month.
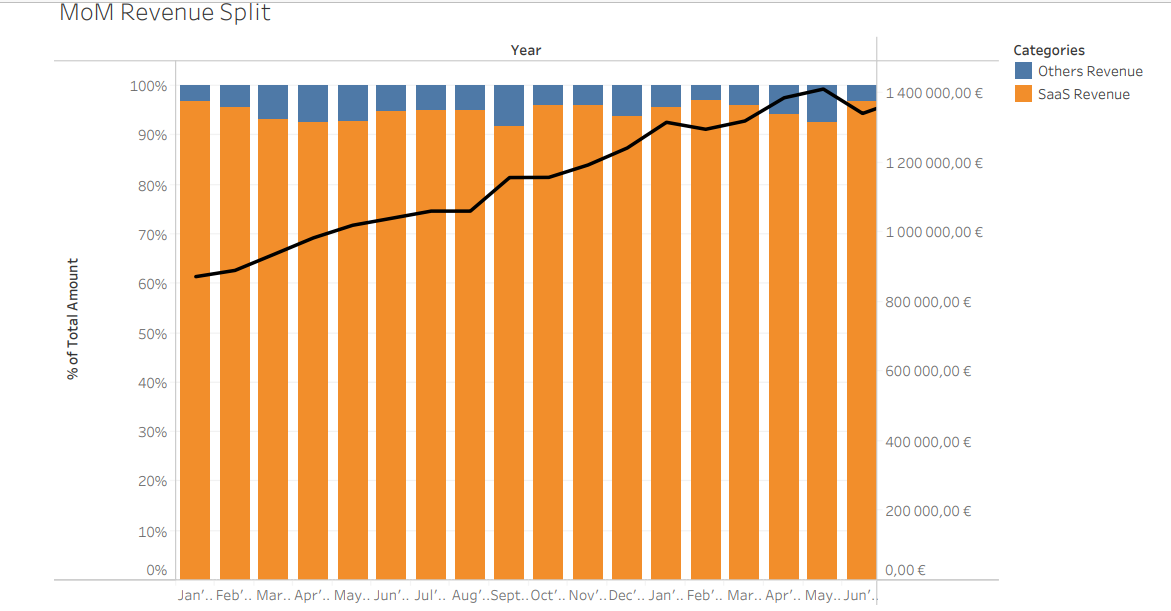
Month-over-month revenue analysis was created to analyse 2 revenue components and revenue growth.

Support
All the support you need – when you need it. From 1-hour quick fix support to longer-term partnership that drives your business forward.

Consultancy
Advanced data thinking, creative ideas and the best Power Platform practices to unlock the true potential of your business data.

Training
Succeess shouldn’t be a one-off. When we train you teams user adoption surges and your Power Platform results radically improve.
![]()
![]()
![]()