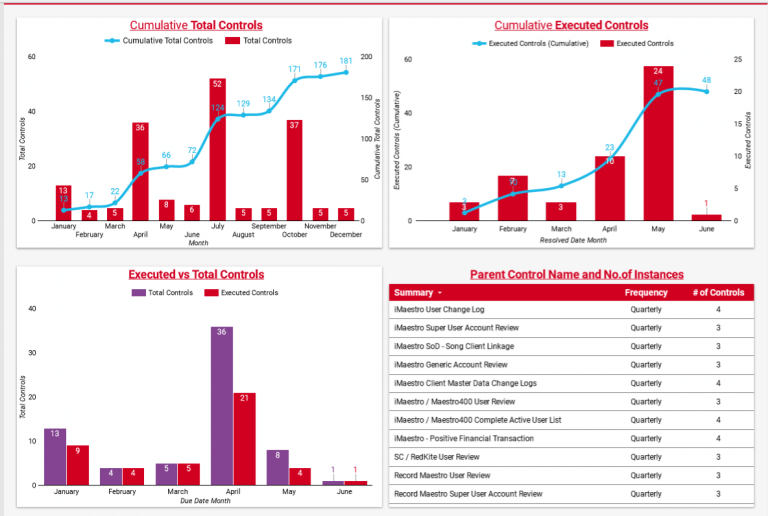
The VP of IT needed to track the number of issues when an information security team had to intervene (controls). The report was used for presentation to Board of Directors.
Data Source
Google Sheets
Analysis Tool
![]() Google Data Studio
Google Data Studio
Total and executed controls are broken down by month and shown as a running total.
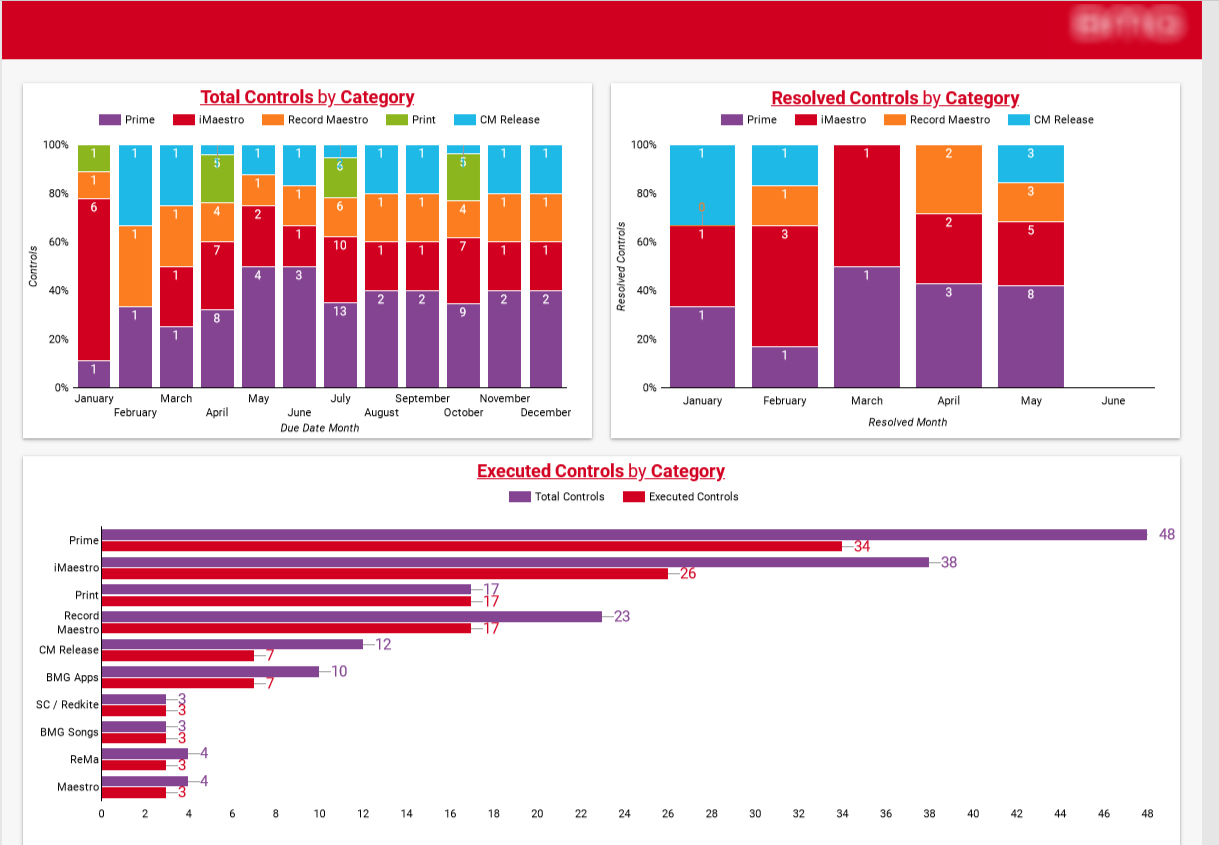
Controls are broken down by category of issue that was raised. The graphs demonstrate proportion of a category as a total and comparing executed controls to total controls by category.
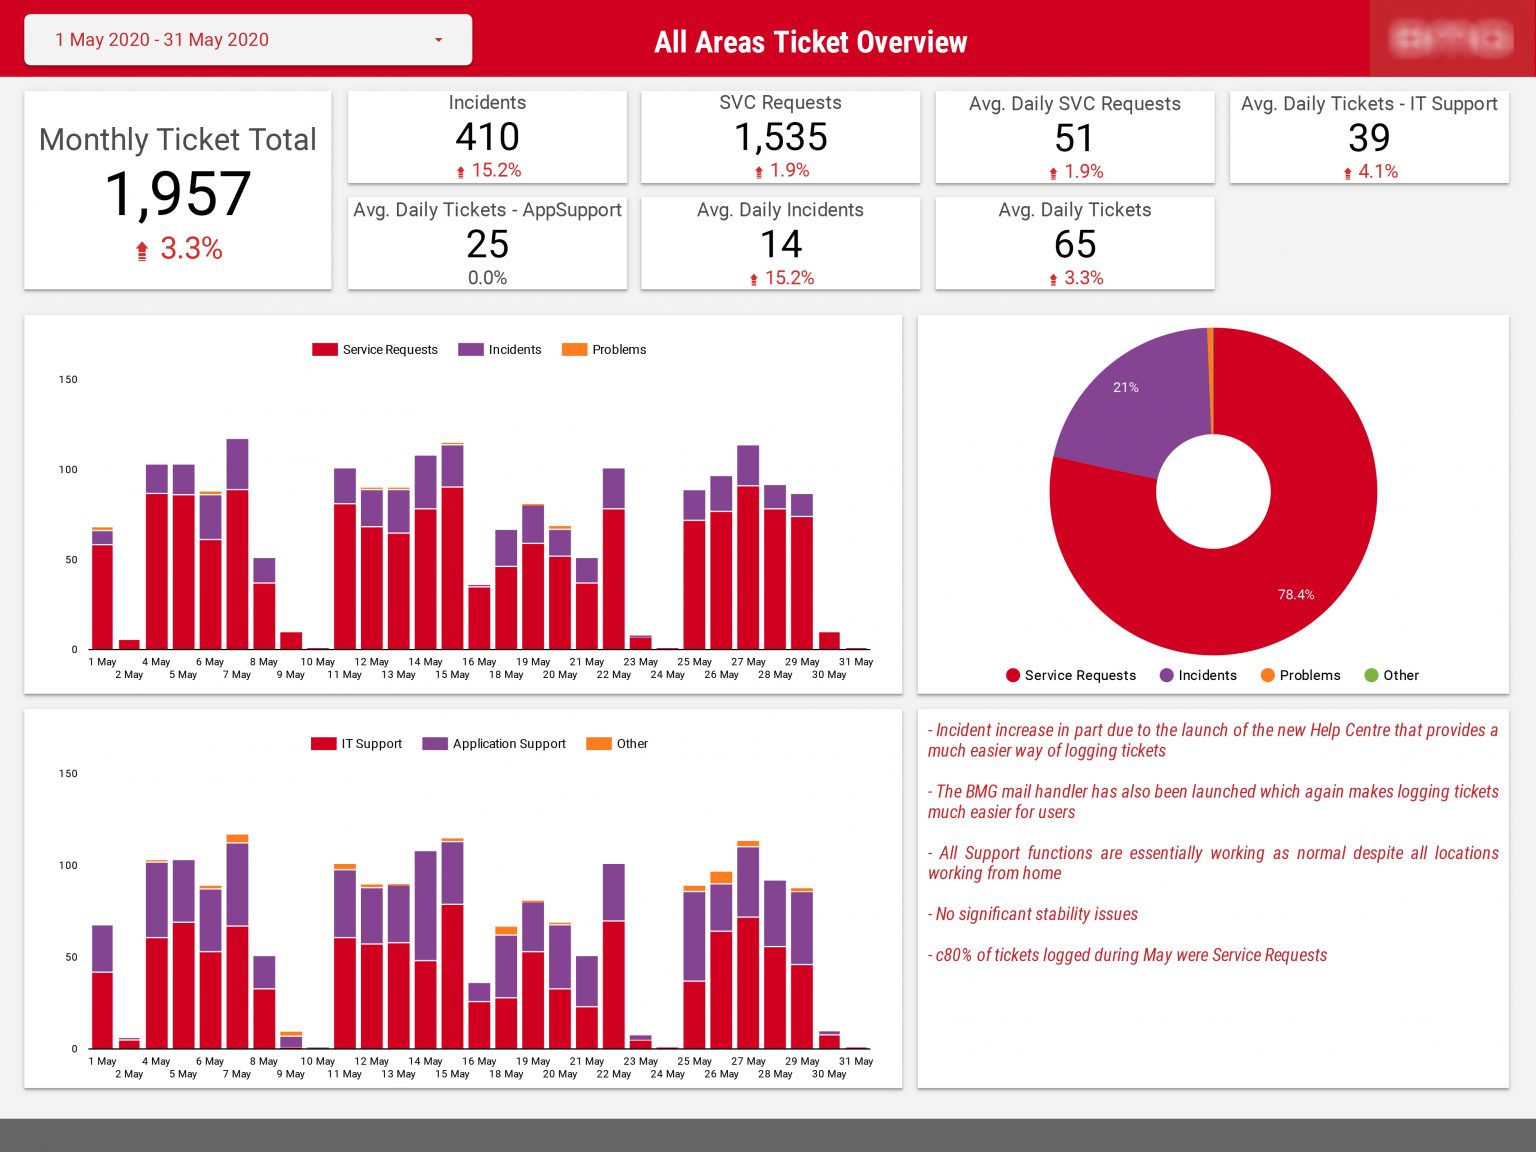
This page analyses the activity of IT organisation and it’s output in terms of solving incidents and support tickets.
The number of tickets is broken down by ticket type. All key metrics are shown at the top and they compare current month to last month.
There is also an option to filter all metrics by month.
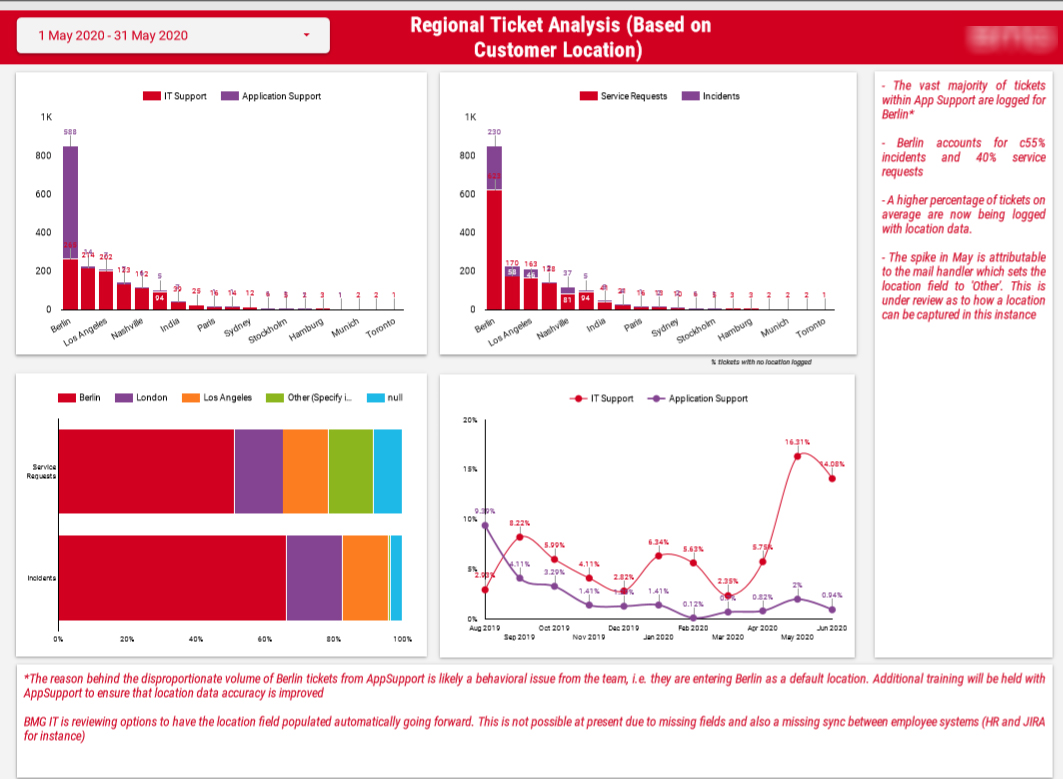
The number of support tickets raised is analysed by location and ticket type. The month over month trend is also shown and there is an option to filter by month.
Number of incidents is broken down by application component. The biggest chunk of incidents is broken down further by a specific incident category.

Support
All the support you need – when you need it. From 1-hour quick fix support to longer-term partnership that drives your business forward.

Consultancy
Advanced data thinking, creative ideas and the best Power Platform practices to unlock the true potential of your business data.

Training
Succeess shouldn’t be a one-off. When we train you teams user adoption surges and your Power Platform results radically improve.
![]()
![]()
![]()