
Manufacturing business intelligence brings together ERP systems, data warehouses, BI tools, and alerts to turn operational data into actionable insight. By connecting production, inventory, sales, and financial data in one analytics layer, manufacturers gain the visibility needed to run operations efficiently and respond quickly to issues on the shop floor and across the supply chain.
As a Power BI consultancy, we have worked with manufacturing companies across industries, from industrial goods and chemicals to biotechnology and medical devices. Our experience spans production analytics, supply chain visibility, financial control, and real-time operational reporting, all delivered through practical Power BI solutions used daily by management and operational teams.
In this article, we explain the key components of business intelligence in manufacturing, why Power BI is particularly well-suited for this industry, and share real-world Power BI manufacturing dashboard examples. These dashboards cover quality control, backlog management, machinery monitoring, sales analysis, inventory, demand planning, CapEx, and OpEx—showing how manufacturers can use data to make faster, more confident decisions.
Business intelligence in manufacturing relies on a clear architecture that connects operational systems with analytics and decision-making. Each component plays a specific role in turning raw production data into insights that can be acted on quickly and confidently.
In our experience, Power BI is the most suitable business intelligence tool for manufacturing organisations. It combines strong data integration, real-time analytics capabilities, and native alerting, making it well suited for production, operations, and supply chain use cases.
Power BI natively connects to many widely used ERP systems in manufacturing, including SAP HANA and Dynamics NAV. It can also be connected to NetSuite, although this typically requires additional configuration or third-party connectors. These integrations make it possible to analyse production, inventory, and sales data in a single reporting layer.
Power BI is also well positioned for analysing sensor and machine data in near real time. Streaming datasets allow manufacturers to monitor live data from equipment, while Microsoft Fabric enables more advanced real-time datasets using Apache Spark for high-volume or complex scenarios.
Finally, Power BI supports alerts natively, allowing teams to react quickly when key thresholds are breached. These alerting capabilities can be extended further in Microsoft Fabric using Activator, enabling more advanced, event-driven notifications for scenarios such as machine downtime, production delays, or inventory shortages.
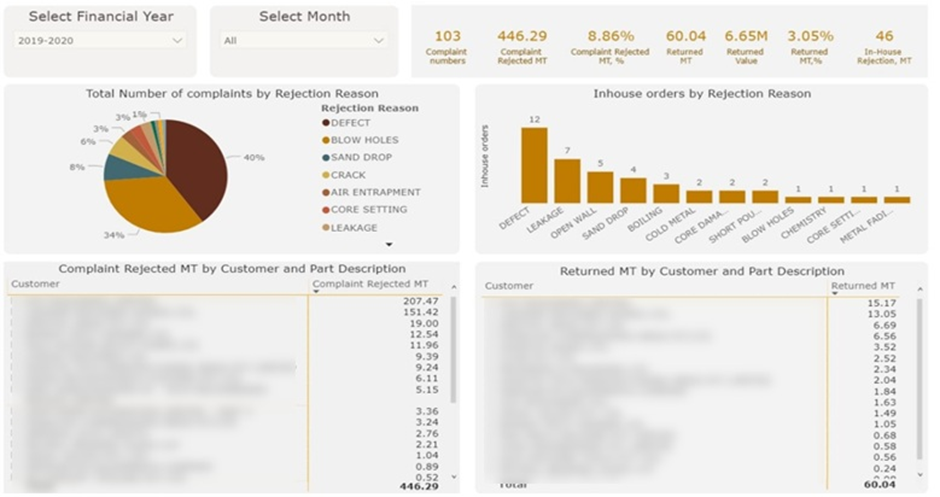
The Power BI Quality Control dashboard tracks production quality by analysing defects and rejections over time. It is used by manufacturing managers and quality teams to monitor quality performance and identify recurring issues.
Our Power BI developers built a quality control dashboard for a steel manufacturer to analyse defects such as blow holes, sand drops, cracks, and other rejection reasons. The dashboard shows rejection volumes and values by month or financial year, including the financial impact of returned items, and breaks down complaints and rejections by customer and by part.
The analysis helps the factory see where quality problems occur most often and which issues are the most costly. This allows teams to prioritise corrective actions, reduce waste and rework, and protect customer relationships. Over time, the dashboard gives the business stronger control over product quality and measurable performance improvements.
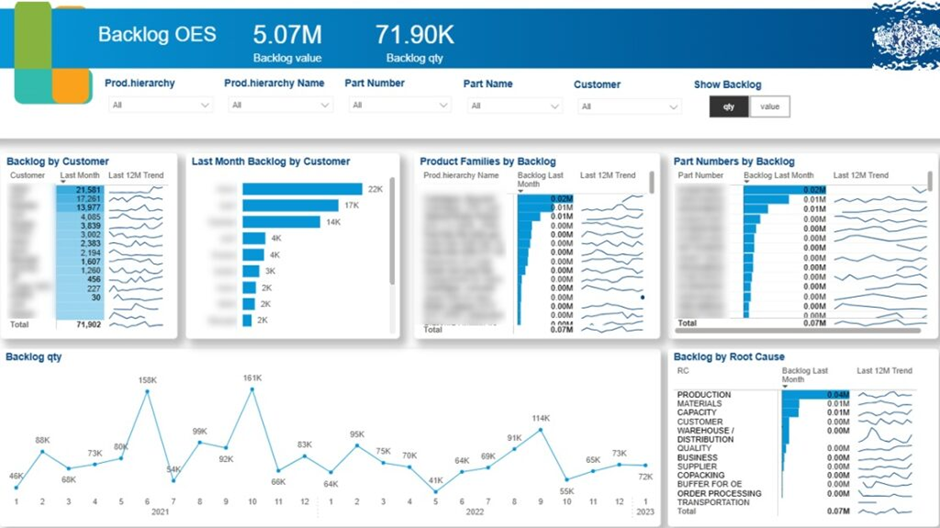
The Power BI backlog dashboard tracks sales demand and order backlog over time. It is used by sales leaders, operations managers, and supply chain teams to understand delivery pressure and customer impact.
Because of several industry trends like the global shortage of semiconductors, manufacturers now experience a large backlog of orders. This happens when products are sold to customers, but they still need to be manufactured.
Our BI consultants built this dashboard for a manufacturer producing parts for trains and commercial vehicles. Our consultants analysed backlog trends by month, customer, and product, compared backlog against average monthly sales, and identified root causes driving delays.
The analysis helps the business prioritise backlog reduction where it matters most. Customer-level backlog analysis highlights which strategic accounts need immediate attention, while product-level backlog supports clearer delivery commitments from sales teams. Root cause and backlog-versus-sales analysis guide management decisions, ensuring backlog is reduced faster than it is created.
A Power BI machinery dashboard connects directly to the shop floor equipment to monitor usage, performance, and wear in near real time. Its main purpose is to ensure consistent production while enabling proactive, data-driven maintenance decisions. Instead of relying on fixed schedules, maintenance teams can act based on how machines and parts are actually used.
In one of our projects with a medical device company, we analysed detailed machinery data to understand how equipment behaves over its full lifecycle. Although this was not a traditional manufacturing case, the same principles apply to any environment where machines run repetitive cycles, and component wear directly affects reliability and output.
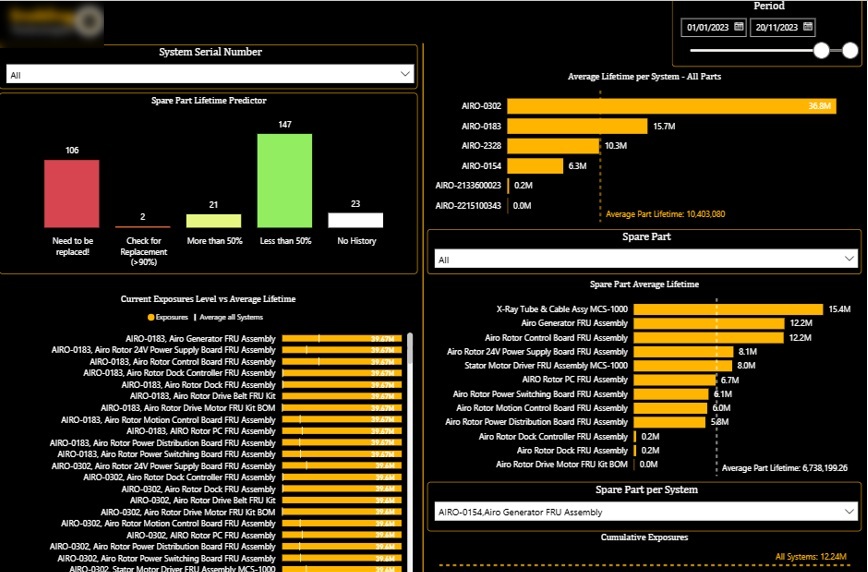
The first dashboard focuses on analysing the lifetime of individual machine parts based on the number of cycles, or exposures, they have completed. Each device is broken down into its individual components, and for every part, we calculated the average expected lifetime in cycles, combined with data on when the part was last replaced.
The histogram in the top-left corner highlights parts that have exceeded their expected lifetime. The red bar immediately shows how many components are operating beyond safe thresholds, and users can click into it to see exactly which parts are at risk. In addition, we classified parts by how close they are to replacement, grouping them into more than 90%, more than 50%, and less than 50% of their expected lifetime. This allows maintenance teams to plan replacements, reduce emergency downtime, and align spare-part ordering with real usage instead of assumptions.
The line chart in the bottom-right provides a detailed view of cycle accumulation for a selected part. In the screenshot, you can see a part reaching around 3.3 million cycles before being replaced, after which the counter resets and shows the new part at 1.1 million cycles. This makes replacement history transparent and helps validate whether parts are being changed too early or too late.
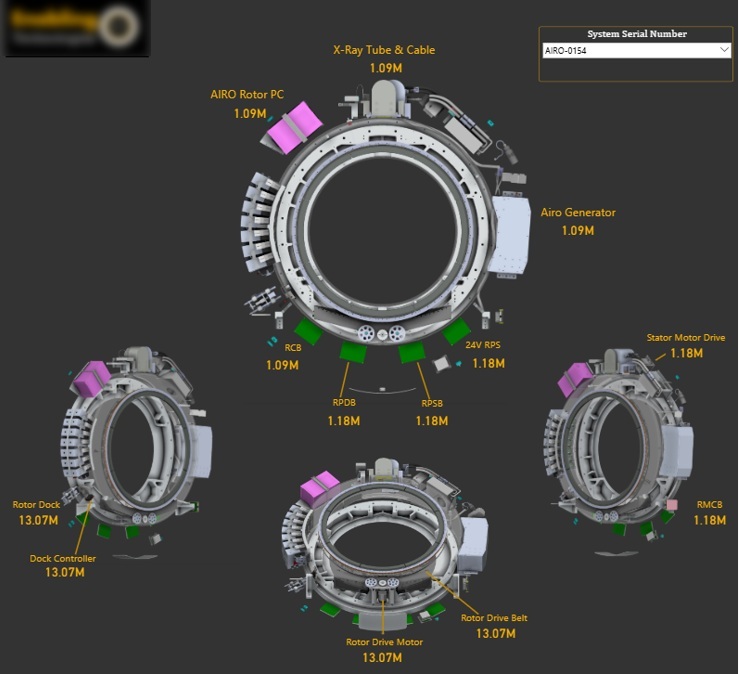
The second screenshot shifts the focus from individual trends to a full machine overview. Here, users select a specific system or machine and immediately see how many cycles each part within that machine has accumulated.
This view is especially valuable for maintenance planning and inspections. Engineers can quickly compare parts within the same machine, identify uneven wear, and decide whether a targeted replacement is sufficient or if a broader service intervention is needed.
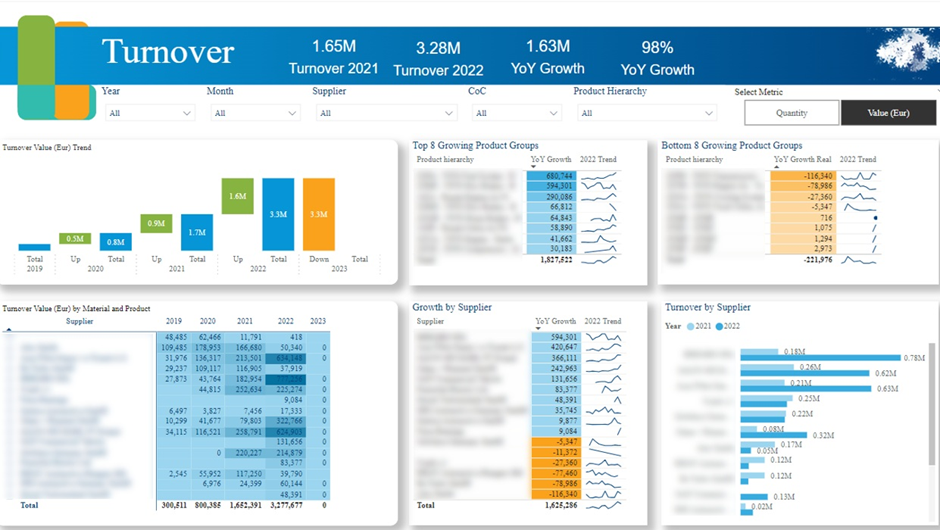
A Power BI manufacturing sales dashboard helps manufacturers understand where sales growth is coming from and how it evolves. For large organisations, this visibility is essential to move beyond topline revenue and focus on the real drivers of performance. The dashboard brings structure to complex sales data and makes growth patterns easy to interpret.
We worked with the Head of Strategy of a German manufacturing company generating over €8 billion in annual revenue. Their main requirement was a clear, year-over-year view of sales growth, analysed by supplier, product, and product group. This allowed leadership to connect strategic decisions directly to measurable sales outcomes.
By identifying high-growth products and product groups, the dashboard revealed emerging market trends and helped anticipate future demand. At the same time, it highlighted suppliers and products with declining sales, enabling proactive supply chain and procurement decisions. As a result, the sales dashboard became a practical tool for guiding both growth strategy and supplier management.
A Power BI inventory dashboard helps manufacturers clearly understand how much finished and in-process product is already stored in the warehouse and available to fulfil new customer orders. This visibility is critical for balancing demand, warehouse capacity, and production planning. Without it, manufacturers risk producing more goods than can be stored, tying up working capital and creating operational bottlenecks across the supply chain.
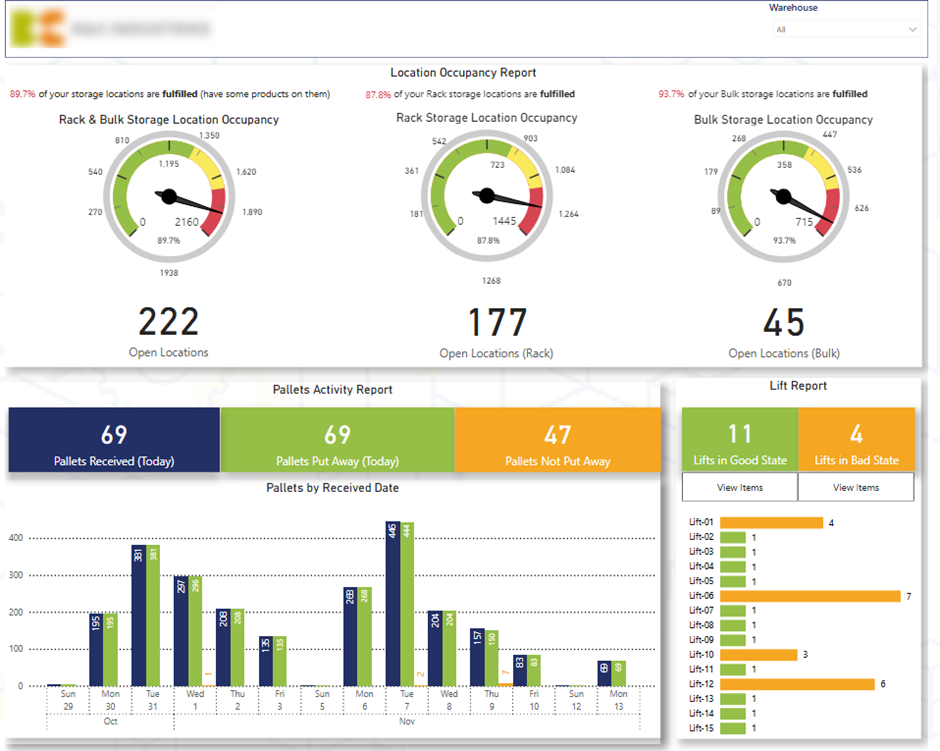
On the first page of our dashboard, which we created for a manufacturing client, we provided a quick health check of inbound warehouse operations. The dashboard shows how much inventory is currently stored and how much additional capacity is available, split by rack and bulk storage. By comparing open versus occupied locations, warehouse managers can immediately identify capacity constraints and plan incoming deliveries accordingly.
Daily pallet intake is visualised in a vertical bar chart, showing which pallets have already been put away versus those still waiting. This makes it easy to prioritise pallets that are blocking inbound flow. We also analysed the number of items per forklift, allowing managers to see which forklifts still carry items, drill into the exact SKUs, and instruct teams to put them away without delay.
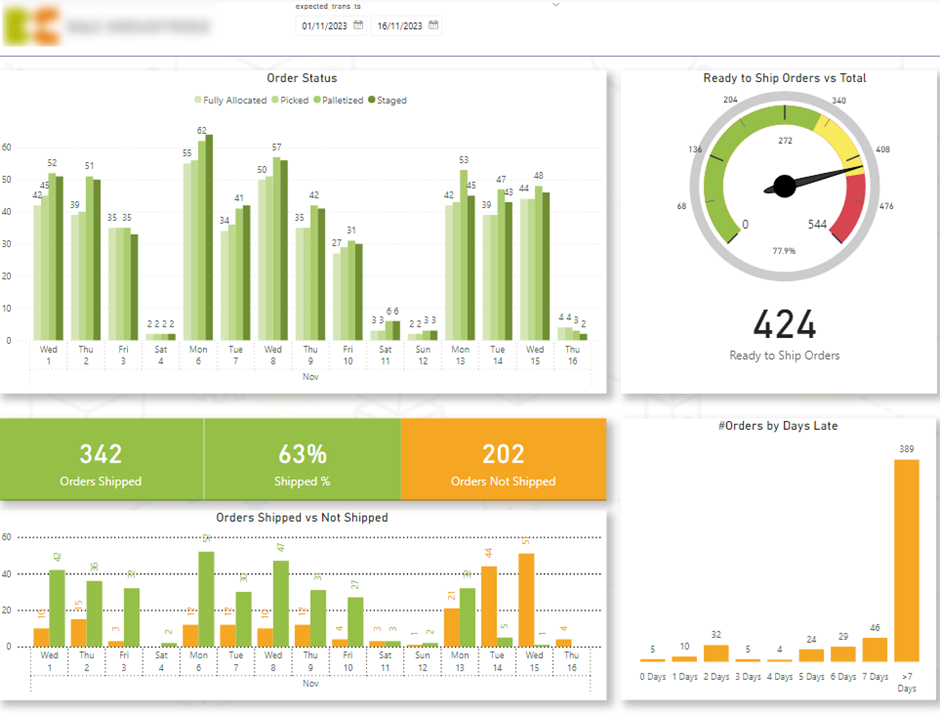
The second page of the dashboard focuses on outbound customer deliveries and fulfilment performance. A gauge shows the percentage and volume of items Ready to Ship, a key metric for maintaining consistent throughput. Order flow is broken down by status—Allocated, Picked, Packed, and Staged—to highlight bottlenecks in the fulfilment process.
The dashboard also compares Shipped versus Not Shipped orders by expected ship date and includes a histogram of orders by days late. This enables warehouse teams to drill into delayed orders, proactively prioritise them, and protect service levels. Together, this page improves on-time delivery, customer satisfaction, and overall warehouse efficiency in a manufacturing environment.
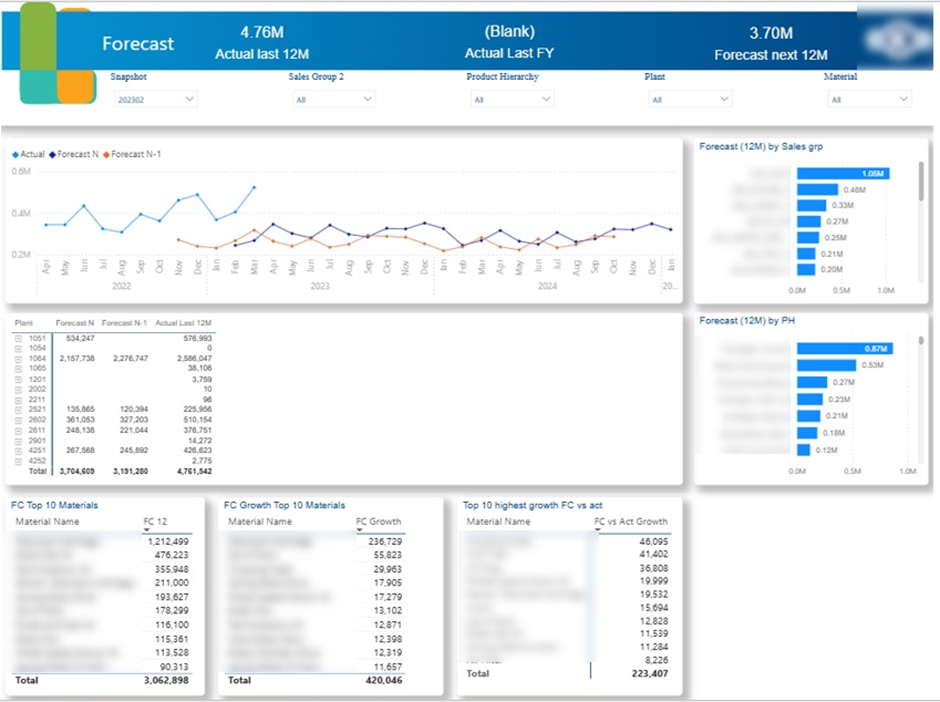
A Power BI demand planning dashboard visualises sales forecasts to help manufacturers align production with expected demand. It plays a key role in reducing product backlog over time by ensuring that production capacity is directed toward the parts that are actually needed. For manufacturing teams, this visibility supports better inventory control, smoother production schedules, and more reliable customer fulfilment.
There are two common approaches to building demand planning dashboards in Power BI. In many organisations, financial or planning teams create forecasts outside of Power BI, often in Excel, and then use Power BI to visualise and distribute those forecasts across the business. In other cases, forecasting is done directly in Power BI using built-in capabilities such as AutoML or statistical models built with functions like LINEST in DAX.
For a manufacturing client, we built a Power BI demand planning dashboard that visualises forecasted demand at the individual part level. This allowed planners to clearly see which parts were driving backlog and which required increased or reduced production. As a result, the dashboard became a practical tool for prioritising production, tackling existing backlog, and making more informed planning decisions across manufacturing operations.
A Power BI CapEx dashboard helps manufacturers track how capital is invested across the business and ensure spending stays aligned with long-term plans. This is especially important in manufacturing, where operations are capital-intensive and require significant upfront investment in plants, equipment, and infrastructure, as well as ongoing asset replacement over time.
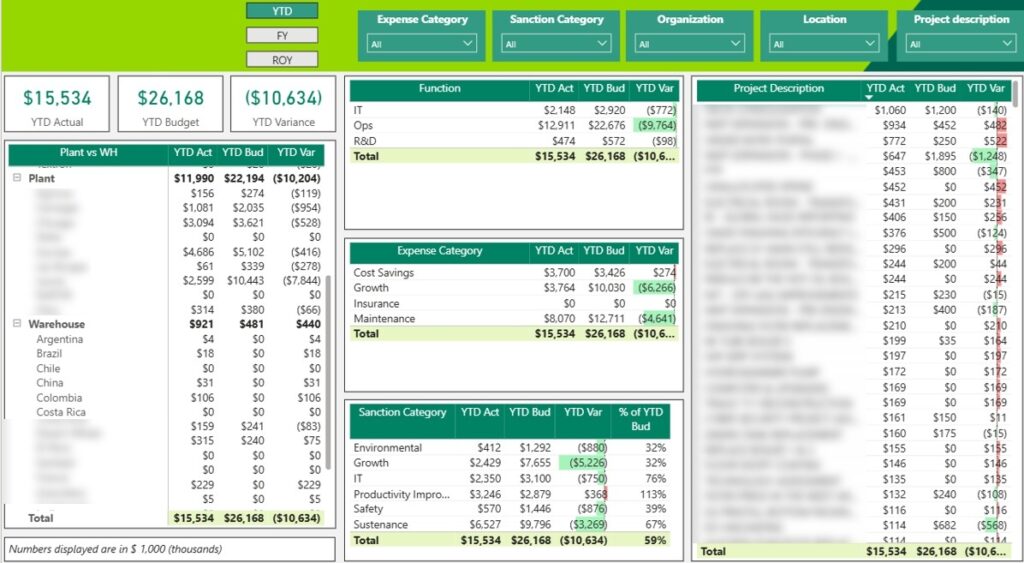
We helped a chemical manufacturing company build a Power BI CapEx dashboard that compares actual versus budgeted capital expenditure. The dashboard analyses investment across key areas such as production plants, warehouses, and corporate offices. In the centre of the dashboard, tables break spending down by category, including maintenance, growth initiatives that add capacity, and cost-saving projects.
By clicking into any category, management can immediately see actual spend versus budget at the individual project level. This allows leadership to monitor whether investment commitments remain within the annual capex budget and take action when projects run over. If overspend occurs, the dashboard supports informed discussions on whether to pause other investments, reallocate funds, or adjust priorities to stay financially controlled.
A Power BI OpEx dashboard helps manufacturers monitor operational expenses tied directly to producing goods. This visibility is essential for controlling the cost of production and protecting profit margins, especially in industries where materials, laboratory work, and outsourced processes represent a significant share of total costs.
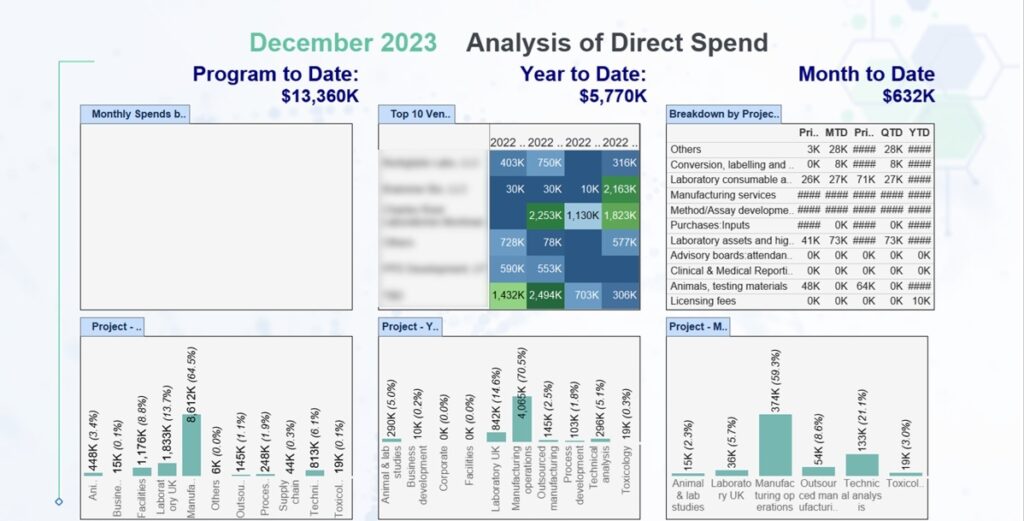
We built the Power BI OpEx dashboard for a biotechnology company manufacturing drugs. The dashboard tracks operational expenses across multiple time perspectives, including prior month to date, month to date, prior quarter to date, quarter to date, and year to date. This allows finance and operations teams to quickly understand both short-term fluctuations and longer-term cost trends.
Expenses are broken down by laboratory, project, and cost category, giving a clear view of where money is being spent. The client can analyse categories such as in-house manufacturing, outsourced production, technical analysis, and laboratory studies, as well as compare expenses by quarter for each laboratory. As a result, the dashboard supports tighter cost control, early identification of overspending, and more informed decisions to maintain healthy margins.
Business Intelligence for Manufacturing enables companies to connect operations, finance, and planning into a single, reliable decision-making layer. When ERP data, real-time signals, and financial controls are brought together in Power BI dashboards, manufacturers gain the clarity needed to reduce downtime, control costs, plan production accurately, and scale with confidence.
If you’re looking to implement or improve business intelligence in your manufacturing organisation, contact us. At Vidi Corp, we design and deliver Power BI solutions tailored to manufacturing processes, data volumes, and decision-makers—helping you turn data into measurable results.
![]()
![]()
![]()