Last year our Power BI consultancy worked on a Power BI warehouse dashboard. Our client owned 3 warehouses and they needed to analyse how effectively the team on site managed the inventory flow.
Our client wanted to ensure that their warehouse teams are following several good practices. The KPIs in our Power BI warehouse dashboard helped to ensure that those practices are followed.
Some of the KPIs that we analysed were:
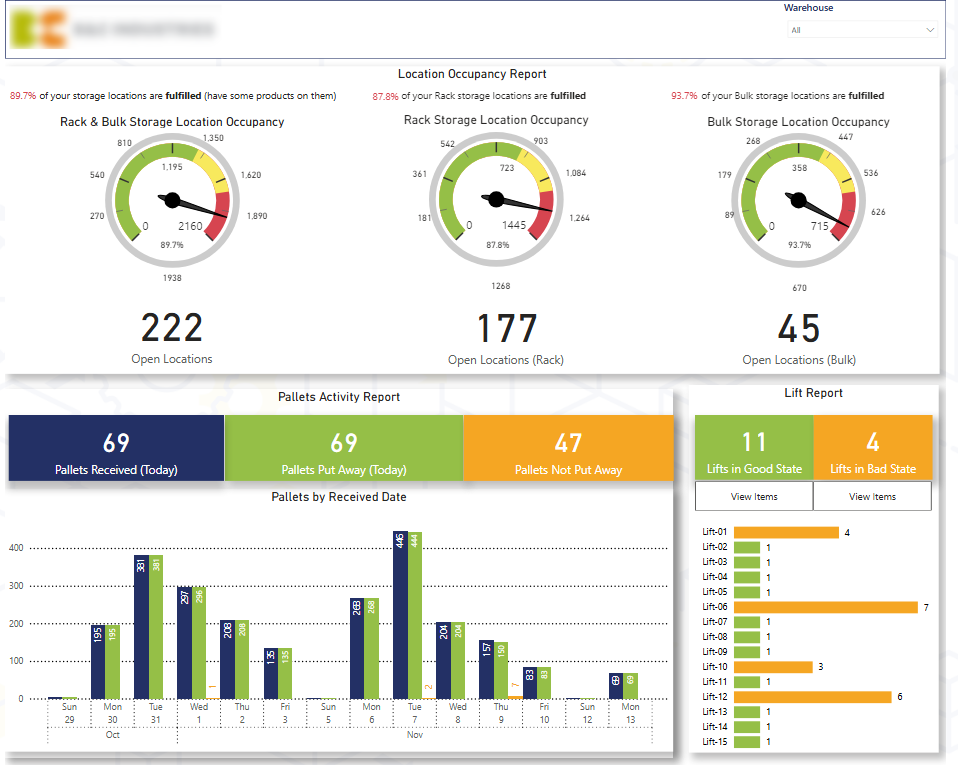
1. Storage Location Occupancy % – this KPI measures how many storage locations already have products on them. It was important to ensure that some buffer is left for newly arriving items.
2. Pallets received, put away and not put away – once there is a delivery of items to the warehouse, the pallets need to be stored away on the same day. We built alerts to the warehouse managers from the Power BI dashboard in case they were not.
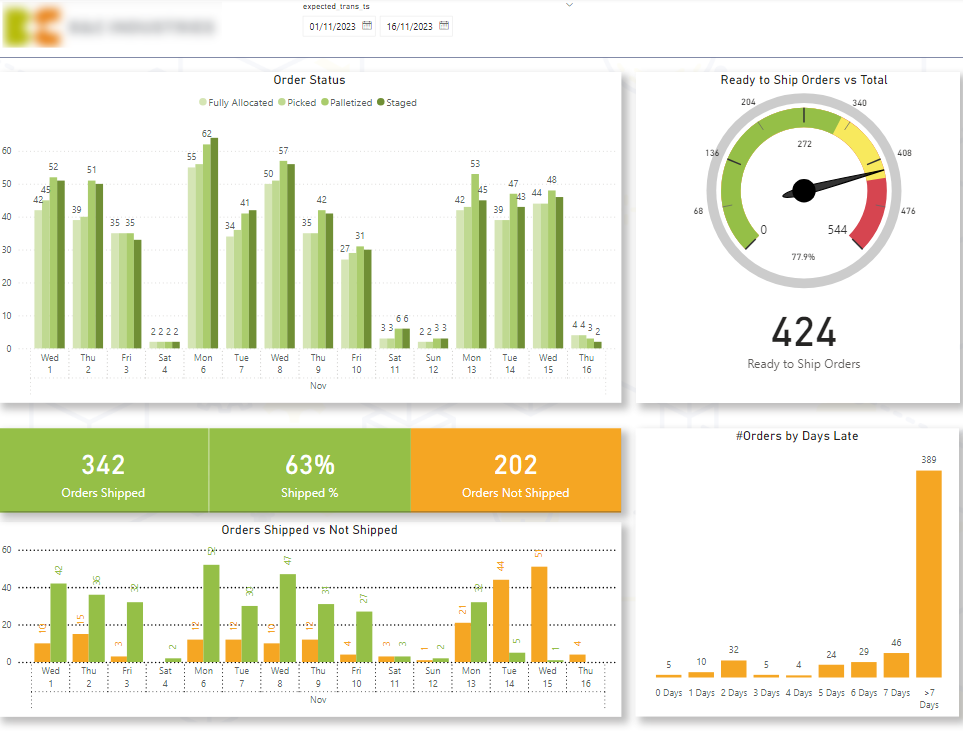
3. Order Status Analysis – Status of items that were about to be sent out of the warehouse (allocated, picked, palletised, staged). This is important to ensure that items do not get stuck on a certain status.
4. Number of days that orders are late – This is important to know which orders should be prioritised.
5. Number of items on lifts – the client wanted to ensure that the warehouse teams don’t leave any items on forklifts overnight. If the forklifts were free, it meant that they could be used to pick the deliveries up in the morning. On the other hand, if the forklifts had items on them overnight, this meant potential delays in accepting deliveries the next day.

The landing page aimed to provide a quick health check for how the warehouses accepted deliveries. There were 2 storage methods in those warehouses: rack and bulk. We analysed how many of those locations were still open vs occupied (fulfilled).
The client also received products packed into pallets every day as can be seen on the vertical bar chart below. We analysed how many of those pallets were put away to storage locations vs not put away. The goal was to identify the pallets that are still not put away to the storage locations and prioritise them.
Finally, we also analysed the number of items per forklift. The warehouse managers could identify which forklift still had items on them, click the “view items” button to view the specific items on them and ask their team to put those items away.

This page in our Power BI warehouse dashboard focused on analysing the customer delivery metrics. We analysed how effectively the items were flowing out of the warehouse.
The gauge chart measures what percentage/number of items were ready to be shipped. The goal was to keep this percentage as high as possible throughout the week.
The bar bar chart at the top analysed how the deliveries were moving between the different statuses. All the deliveries needed to be fully allocated, then picked by the team, packed on pallets and then staged (meaning they were placed into a location from which the delivery team could pick them up).
The bar chart at the bottom left analysed the number of shipped vs not shipped orders by expected date of shipping. As expected the number of not shipped orders was higher for the more recent dates.
Finally the histogram on the bottom right analysed the number of orders by days that they are late. The team could drill down to the specific orders that were late from this chart and prioritise them accordingly.
Our general advice would be to find ways to log your warehouse management data and track your progress towards targets. Power BI can massively help to build automated reporting systems that help warehouse management experts track their performance based on KPIs and targets.
We would then recommend making the Power BI reports a part of weekly meetings. The team needs to be sure that you are using the management reports and that their performance will be analysed based on the KPIs in the report.
Feel free to read our guide to effective Power BI implementation for more good practices.
We would love to help you build your Power BI warehouse dashboard! Our Power BI consultants have built 1000+ dashboards for 600+ international clients. Having so many success stories we bring unmatched business and technical expertise into our client projects.
Support
All the support you need – when you need it. From 1-hour quick fix support to longer-term partnership that drives your business forward.
Consultancy
Advanced data thinking, creative ideas and the best Power Platform practices to unlock the true potential of your business data.
Training
Succeess shouldn’t be a one-off. When we train you teams user adoption surges and your Power Platform results radically improve.