Power BI healthcare dashboards are data visualisation tools that consolidate clinical, operational, financial, and marketing data into a structured view. Every team usually has their own dedicated dashboards that turn complex healthcare data into clear, decision-ready insights.
As a data analytics agency, we have built healthcare dashboards for pharmaceutical companies, hospitals, care homes, home health agencies, medical device manufacturers, and healthcare marketing teams. Different dedicated dashboards support executive reporting, operational control, referral tracking, reimbursement protection, service profitability analysis, and patient-level clinical monitoring.
In this article, we showcase 12 real healthcare dashboard examples built in Power BI, Looker Studio, and custom-coded solutions. Each example demonstrates how structured analytics can improve financial visibility, strengthen operational processes, and support better patient outcomes across the healthcare ecosystem.
Healthcare dashboards are not just reporting tools. When designed correctly, they become decision-support systems that connect finance, operations, clinical care, and marketing into one structured view. Below are the key benefits we consistently see across pharmaceutical companies, hospitals, care homes, and medical device manufacturers.
Most of the healthcare dashboards we build are developed in Power BI. It is the best choice for internal data analysis where insights need to be shared with finance teams, operations managers, or C-level executives. The platform is designed for structured, secure reporting within organisations.
In several projects, we have also delivered Power BI dashboards optimised for mobile use, allowing doctors to access quick patient insights directly from their phones. This makes it easier to review high-level metrics without being tied to a desktop environment. Power BI supports automated data refresh, ensuring stakeholders always see up-to-date information.
Power BI is also highly affordable, starting at $14 per user per month, which makes it accessible for healthcare organisations of different sizes. However, it is important to note that Power BI is purely a data visualisation tool. It does not support writeback, meaning clinicians cannot record or edit patient data directly within the dashboard.
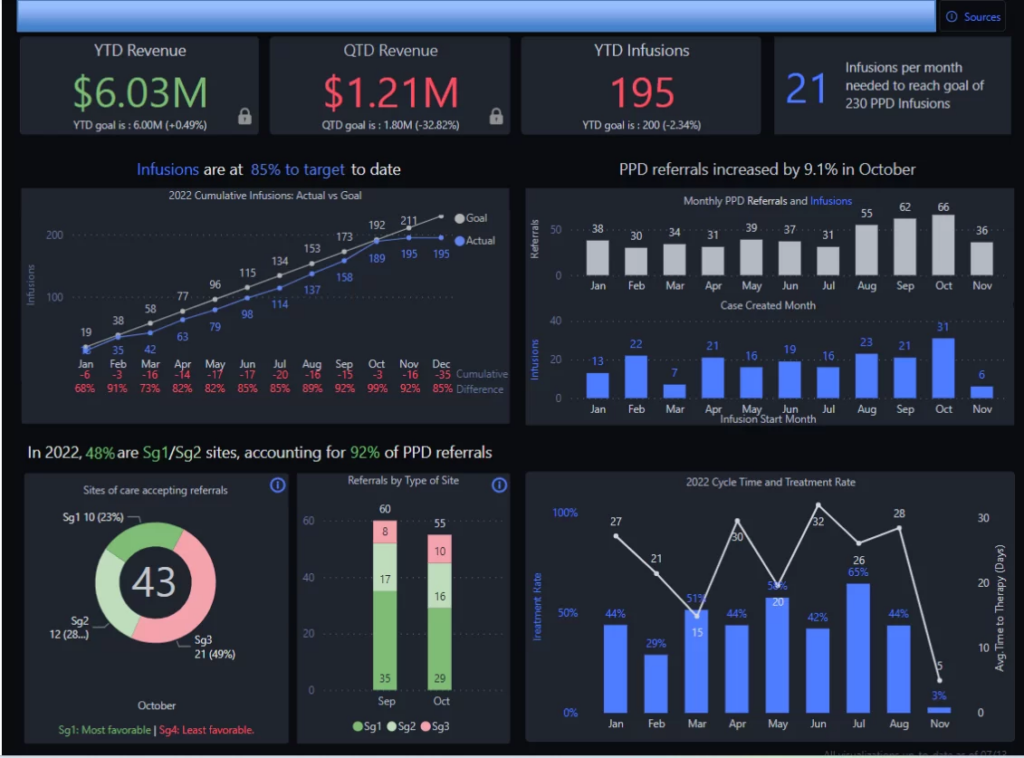
A Power BI pharma sales dashboard gives executives a clear, high-level view of commercial performance across sites and over time. It is designed for CEOs, Sales Directors, and Finance leaders in pharmaceutical companies who need fast insight into revenue trends, infusion activity, and target achievement. Instead of reviewing multiple reports, leadership can see the overall performance snapshot on one page.
Our Power BI consultants built this executive overview dashboard for a healthcare client to consolidate sales and infusion data into a single, structured view. At the top, we display key KPIs such as YTD Revenue, QTD Revenue, YTD Infusions, and Total Infusions to provide an instant performance snapshot. The dashboard also includes line charts for infusion and referral trends over time and actual vs target visuals that show predefined revenue and infusion goals alongside real results.
The dashboard supports structured executive workflows such as monthly sales reviews and quarterly target tracking. Previously, leadership teams relied on static Excel reports and disconnected summaries, which made it difficult to identify underperformance early. Now, executives can immediately see revenue gaps, declining infusion trends, or departments missing targets, and take corrective action before the end of the reporting period.
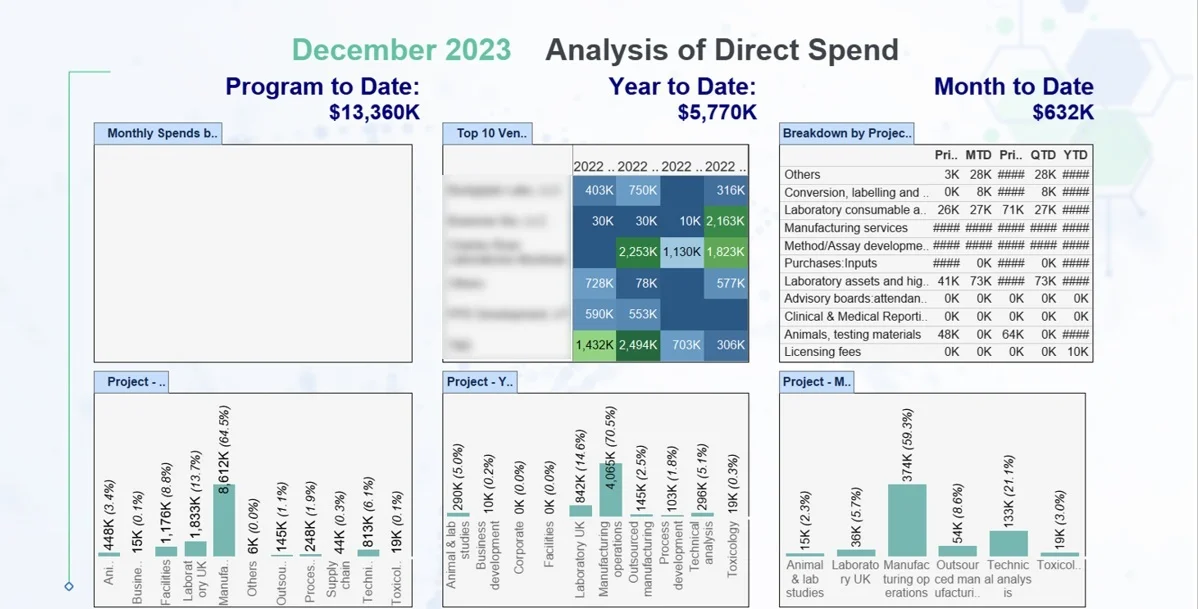
A Power BI Pharma OpEx Dashboard helps pharmaceutical and biotechnology companies control the operational expenses tied directly to drug production. It is primarily used by CFOs, Finance Directors, and Operations Managers who need visibility into laboratory costs, manufacturing spend, and outsourced processes. In industries where production and R&D costs directly impact margins, this level of transparency is critical.
Our BI consultants built this OpEx dashboard for a biotechnology company manufacturing drugs. The dashboard tracks operational expenses across multiple time perspectives, including prior month to date, month to date, prior quarter to date, quarter to date, and year to date. Costs are broken down by laboratory, project, and expense category, such as in-house manufacturing, outsourced production, technical analysis, and laboratory studies, with quarterly comparisons available for each laboratory.
This structure supports monthly and quarterly cost review meetings. Finance teams can quickly identify which laboratories or projects are overspending and whether cost increases are short-term fluctuations or part of a growing trend. Before this dashboard, expense analysis required manual consolidation from accounting and project systems. Now, leadership can detect budget deviations earlier, adjust production planning or outsourcing decisions, and protect profit margins through tighter cost control.
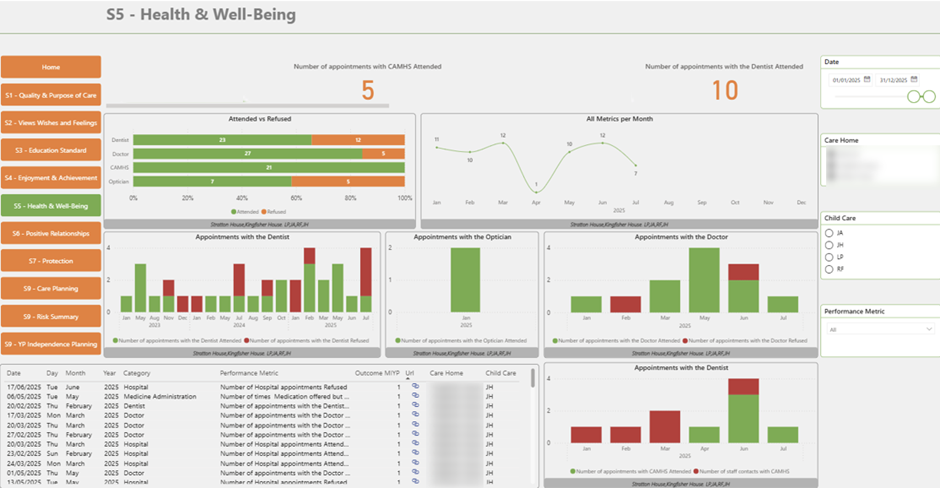
A Power BI Pocket Dashboard for hospitals and care homes gives doctors and facility management teams a simple, mobile-friendly view of patient care activity. It is designed for medical staff and operational managers who need fast access to care metrics during daily rounds, shift handovers, or planning meetings. The focus is on maintaining consistent care standards and ensuring no essential appointments are missed.
Our BI consultants built this dashboard for a care home to monitor key care indicators in one concise view. It tracks the percentage of residents who attended essential medical visits, such as dentists or opticians, versus those who declined. Monthly trends show whether care participation is improving or declining, and the data can be filtered by ward, unit, or time period.
This structure supports daily operational workflows. Doctors can quickly see which residents missed scheduled visits and follow up during clinical reviews. Facility managers can identify patterns across units and address scheduling or communication gaps. Before this dashboard, care tracking required manual record checks. Now, teams have a real-time overview that helps maintain compliance, improve coordination, and protect patient care quality.
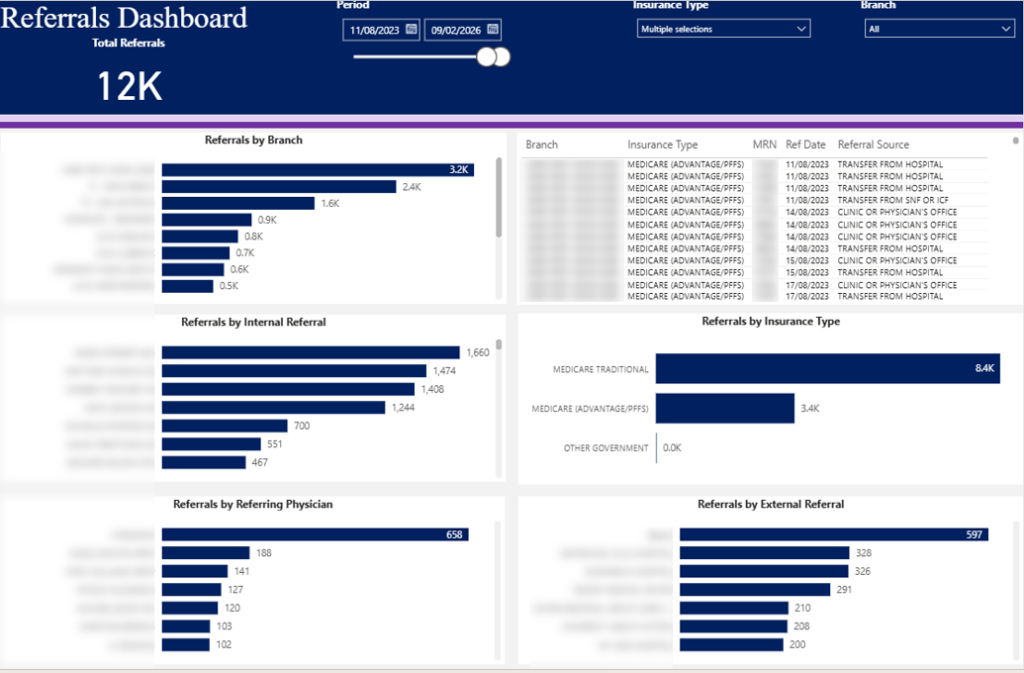
A Power BI Hospitals Referrals Dashboard helps hospitals track where new patients come from and strengthen referral relationships. It is primarily used by business development teams, department managers, and physician leads who want to understand referral patterns across branches and doctors. Since referrals are a key driver of patient growth, structured tracking is essential for maintaining and expanding these relationships.
Our BI consultants built this dashboard for a hospital in the US to provide a clear overview of referral activity. The top section includes a bar chart showing total referrals received by branch, allowing leadership to compare performance across locations. Below, the dashboard breaks down internal referrals by doctor within the organisation and external referrals by physician outside the network. A summary table highlights referrals by branch and referral source, such as hospital transfers or clinic referrals, while an additional visual analyses referrals by insurance type, including traditional Medicare, advanced Medicare, and other categories.
This structure supports both operational and relationship management workflows. Branch managers can identify which physicians generate the highest number of referrals and strengthen collaboration with them. Business development teams can spot underperforming branches and proactively engage external clinics or hospitals to increase patient inflow. Before this dashboard, referral analysis required manual reporting from multiple systems. Now, the hospital can monitor referral trends in real time, improve partner relationships, and support sustainable patient growth.
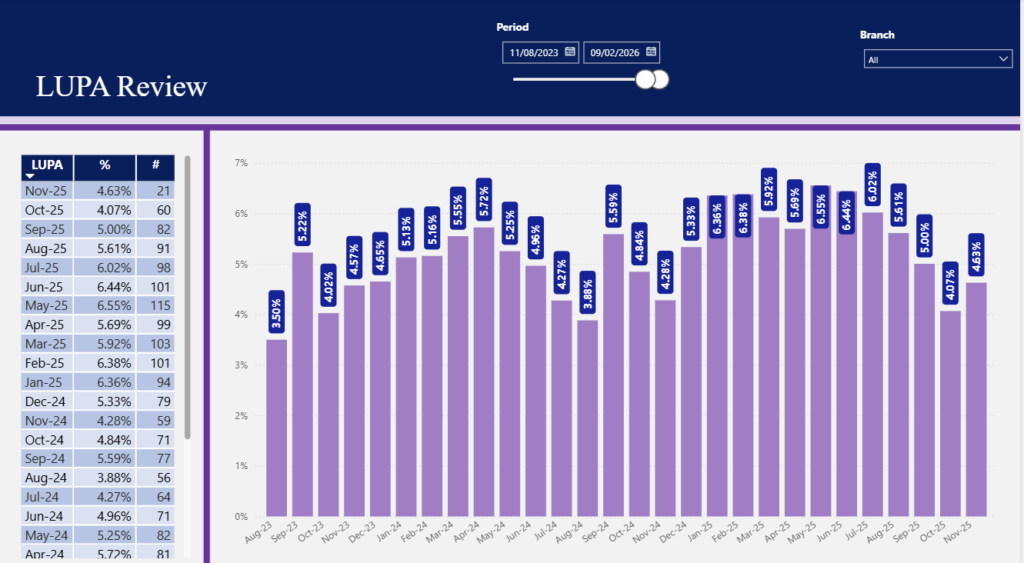
A Power BI Hospitals LUPA Dashboard helps home health agencies monitor Low Utilization Payment Adjustments (LUPA) under PDGM. It is designed for operations managers, clinical directors, and finance teams who need visibility into visit thresholds during each 30-day payment period. Since LUPA directly reduces reimbursement, tracking it is critical for both financial stability and care quality.
Our BI consultants built this dashboard for a US healthcare provider to monitor LUPA performance for the whole organisation. The dashboard shows the total number of LUPA incidents by month and the percentage of cases that resulted in LUPA. Users can filter the analysis by branch to identify locations with higher occurrence rates and detect trends over time.
This dashboard supports three key business processes. From a financial perspective, leadership can see where bundled payments are being lost and intervene before margins are impacted further. From a compliance standpoint, recurring LUPA patterns can be flagged early to reduce audit risk. From a clinical perspective, managers can investigate whether missed visits are affecting patient outcomes. Before this solution, LUPA tracking required manual reconciliation of visit data and billing records. Now, teams can proactively manage visit planning, protect reimbursement, and maintain consistent patient care standards.
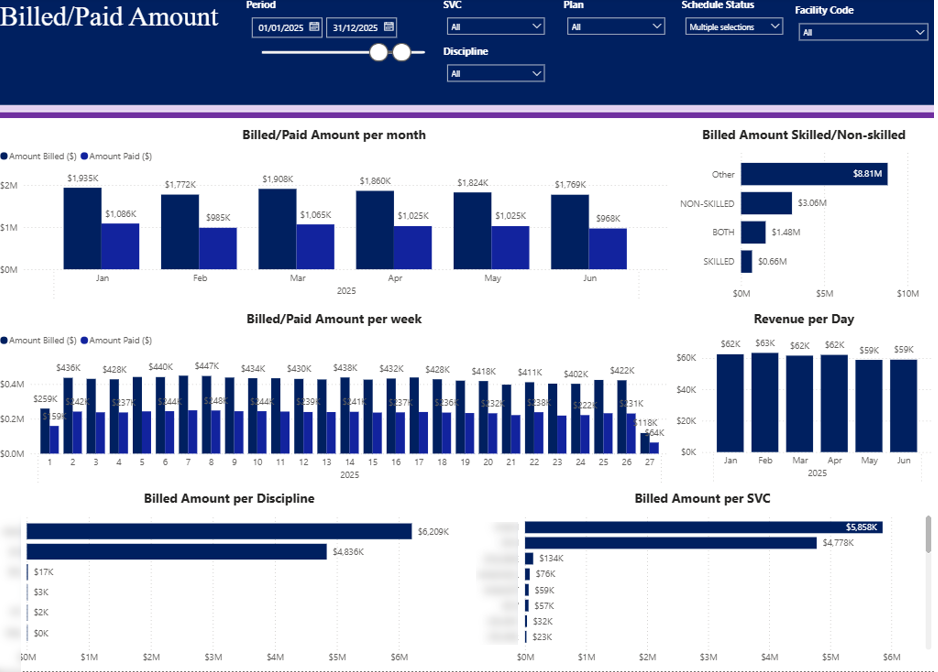
A Power BI Healthcare Service Profitability Dashboard helps healthcare providers understand revenue performance across clinical services. It is designed for finance teams who need visibility into how much labour is billed and how much is actually paid. The focus is on comparing billed versus paid amounts across time and disciplines.
Our Power BI developers built this dashboard to analyse billed and paid labour amounts by both month and week. This allows leadership to monitor performance trends and quickly detect gaps between what was invoiced and what was reimbursed. The dashboard also includes a monthly revenue trend normalised by day, which provides a more reliable comparison since months have a different number of days.
Billed amounts are broken down by discipline, including home health aide, registered nurse, and physical therapist, as well as by procedure (SVC). This structure allows managers to see which disciplines and services generate the highest billed revenue and how payments compare across categories. Before this dashboard, analysing labour revenue required manual reconciliation between billing and payment data. Now, teams can clearly track service-level performance and identify trends that impact overall profitability.
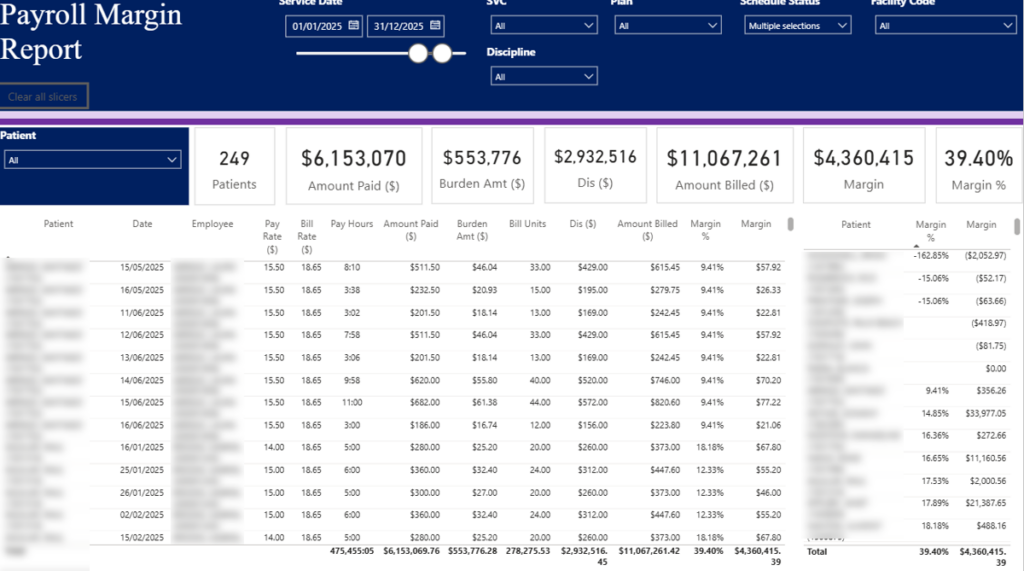
A Power BI Hospitals Service Profitability Dashboard gives hospital finance and operational teams a clear view of profitability at patient and service level. It is designed for finance managers, service line leaders, and facility administrators who need to understand how labour costs translate into margin. The focus is on linking patient activity, billing, and staffing performance in one structured report.
We built this dashboard to display the total number of patients, total amount billed, overall profit margin, and total profit at the top level. This provides an immediate summary of financial performance for the selected period. Below, a detailed table delivers a near transaction-level view by breaking down hours worked, billed rate, pay rate, amount billed, and margin by patient, employee, and date.
The dashboard can be filtered by patient to quickly identify expected charges and validate billing details. It can also be filtered by discipline, procedure, and facility to compare margins across service lines and locations. Before this solution, reviewing service profitability required combining payroll and billing exports manually. Now, users can drill into detailed data instantly, verify margins with confidence, and make informed staffing and pricing decisions to protect overall profitability.
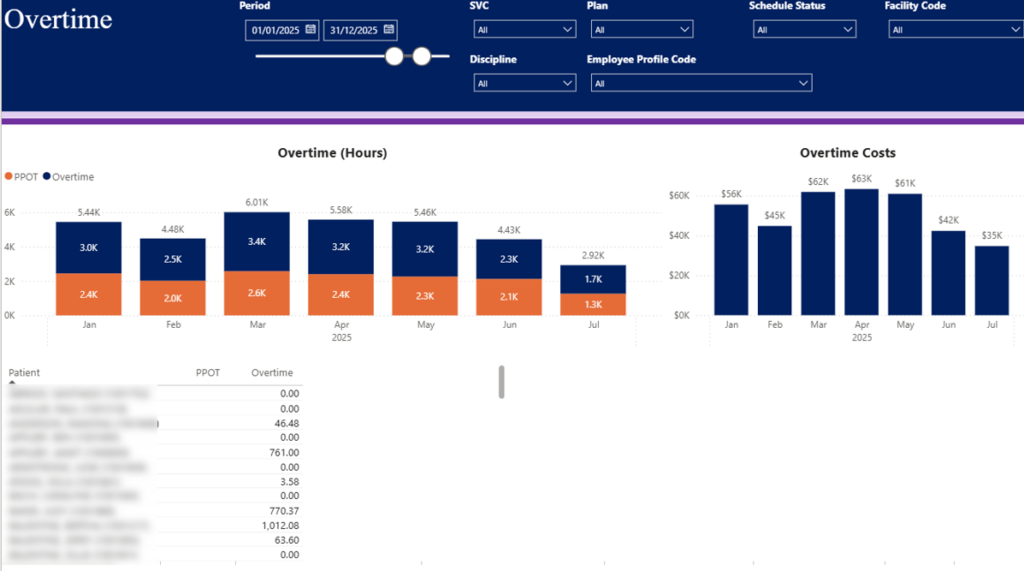
A Power BI Doctor Overtime Dashboard helps hospitals and care facilities control overtime costs while maintaining adequate patient coverage. It is designed for operations managers, HR teams, and finance leaders who need visibility into how overtime impacts labour budgets. Since overtime is common in healthcare, structured monitoring is essential to keep staffing costs predictable.
Our data visualisation consultants built this dashboard to break down overtime costs by month using a clear bar chart. This allows leadership to see seasonal patterns and identify months where overtime spikes. Overtime hours are also categorised into patient-paid overtime (PPOT) and hospital-paid overtime, making it clear who carries the financial burden.
A detailed table below breaks down overtime by patient, giving managers visibility into which cases or assignments generate additional hours. The dashboard can be filtered by facility, medical professional discipline, and employee profile code, allowing users to analyse overtime trends across departments or individual roles. Before this dashboard, overtime analysis required manual payroll reconciliation. Now, management can monitor overtime drivers in real time, balance workloads more effectively, and protect labour budgets without compromising patient care.
We have developed several healthcare dashboards in Looker Studio, particularly for app usage analytics. In our experience, Looker Studio works very well when clients track mobile app data through Firebase. We extract this data into BigQuery and visualise it in Looker Studio, creating a smooth and reliable reporting pipeline. Since Firebase, BigQuery, and Looker Studio are all Google products, the integration between them is stable and efficient.
We have also built Looker Studio dashboards for marketing agencies that report performance to healthcare clients. Sharing Looker Studio dashboards does not require paid viewer licenses, which makes it easy to distribute reports externally to clients, partners, or investors. This flexibility makes Looker Studio a practical option for outward-facing healthcare reporting.
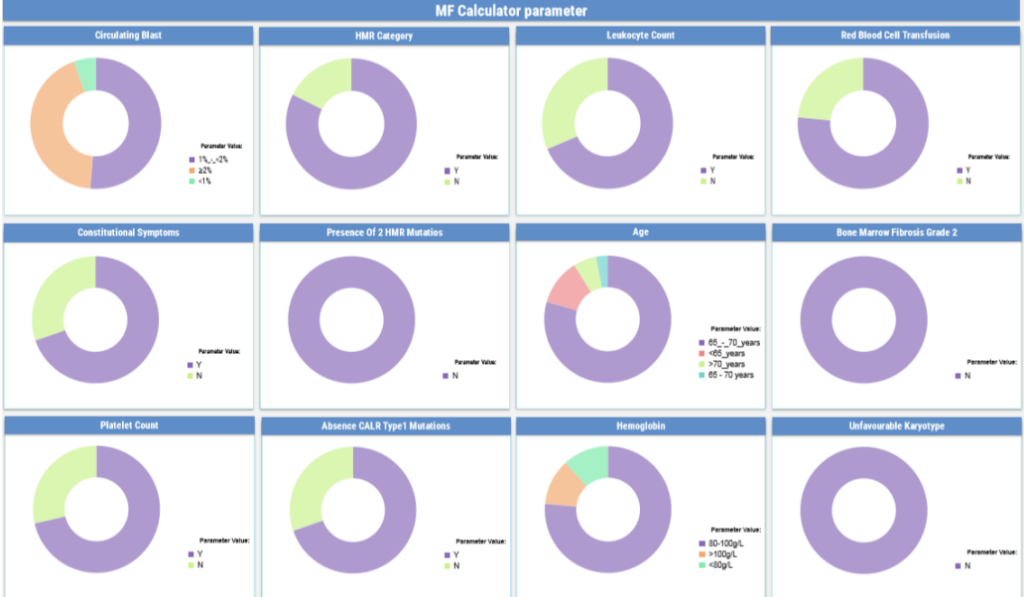
The patient health distribution dashboard provides healthcare professionals with a clear, real-time overview of their patient population. It is designed for healthcare teams using a mobile app to collect clinical data and monitor key medical indicators across multiple patients. The dashboard helps doctors and specialists quickly understand patient distribution and health status at a glance.
This solution was custom-built by our team using data captured directly through the mobile application, tracked with Firebase and visualised in Looker Studio. The dashboard breaks down patient counts using pie charts and segmented views across critical medical parameters such as Hemoglobin levels, Bone Marrow Fibrosis stages, and other oncology-specific indicators.
By consolidating patient metrics into a single interactive view, the dashboard supports faster clinical assessment and better workload management. Healthcare professionals can prioritise attention based on current health indicators and track overall patient trends more efficiently. This structured visibility improves decision-making and supports more consistent, data-informed patient care.
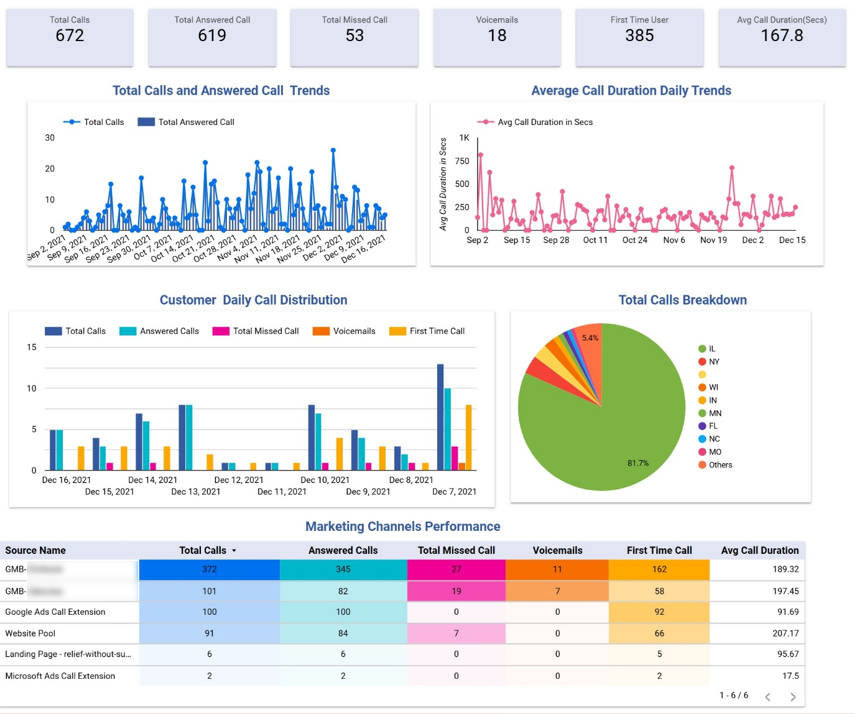
The Healthcare Marketing Dashboard helps clinics and healthcare providers understand how digital marketing drives patient enquiries. It is most relevant for dental clinics, mental health organisations, and other practices that rely heavily on paid ads and online campaigns to generate leads. Marketing managers and clinic directors use this dashboard to track call volume, lead quality, and channel performance in one place.
Our Looker Studio consultants developed this dashboard for a group of dental clinics using data from CallRail. The top section analyses daily trends for total calls, answered calls, and average call duration. Below that, call distribution is segmented by status, including answered, missed, voicemail, and first-time callers. Calls are also broken down by state, allowing the client to focus specifically on enquiries coming from their local target markets.
The lower section evaluates performance by marketing channel. It compares total calls, answered calls, missed calls, voicemails, first-time calls, and average call duration across sources. This allows the marketing team to identify which channels generate the highest volume of enquiries and which bring more engaged leads, measured by longer average call times. As a result, budget allocation decisions become clearer and campaign optimisation becomes more data-driven.
In one of our healthcare projects, we built fully custom dashboards using ReactJS, CSS, and Bootstrap. This is the most technical approach and requires significant front-end and back-end development, which makes it more expensive than standard BI solutions. However, it offers maximum flexibility in both functionality and user experience.
Custom-built dashboards are ideal when BI tools feel limiting in terms of design, interactivity, or workflow logic. For example, if users need to enter or update patient data directly within the application, or if the interface must follow strict branding and UX requirements, a fully coded solution is the right choice.
This approach allows complete control over layout, navigation, permissions, and data handling. While development takes longer, it enables organisations to build a healthcare platform tailored exactly to their clinical, operational, or commercial needs.
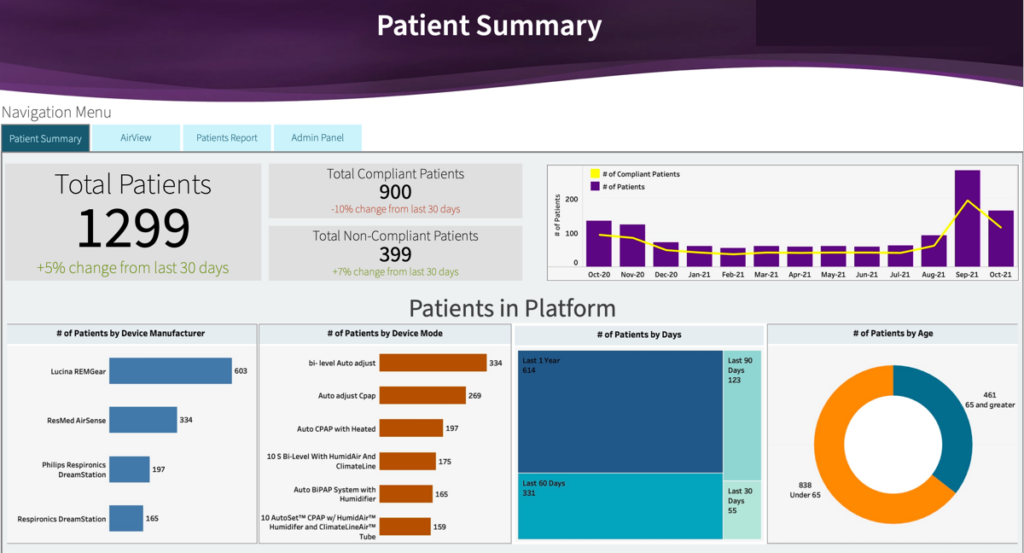
The Patient summary dashboard provides healthcare professionals with a clear overview of patient engagement and device usage. It is designed for operational and clinical teams who need to monitor whether devices are actively transmitting data and whether patients remain compliant over time.
Our dashboard consultants built this dashboard for a medical device manufacturer whose sensors collect health data from individual patients. The summary tab tracks the total number of compliant and non-compliant patients, where a device is marked as non-compliant if no data is received for seven consecutive days after registration. We calculated total patients and compliant patients by month to monitor trends over time. The dashboard also segments patients by device manufacturer, device mode, and age group, and shows how many patients were active in the last 365, 90, 60, and 30 days.
This analysis helps the healthcare organisations identify engagement risks early and prioritise follow-up actions. By monitoring compliance rates and recent activity windows, teams can quickly spot inactive devices and address potential technical or patient-related issues. The structured visibility improves operational oversight and supports more consistent device performance across the patient base.
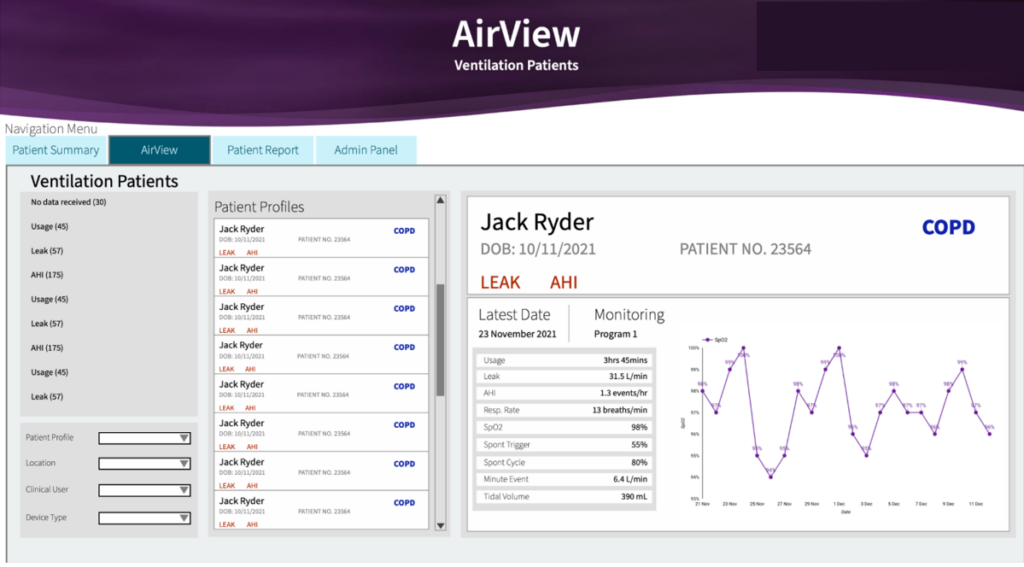
The Patient Health Indicator Dashboard helps clinicians monitor detailed health metrics for patients using connected devices. It is designed for doctors and care teams who need session-level visibility into both device performance and patient condition. The dashboard makes it easy to review individual patient data in a structured and interactive way.
We developed this dashboard for the same medical device manufacturer to allow doctors to select a specific patient and analyse every recorded device session. It tracks key usage metrics such as session duration and leak rate, which measures the amount of oxygen not entering the patient’s lungs as intended. In addition, it visualises critical health indicators including respiration rate, AHI (Apnea-Hypopnea Index), SpO2, tidal volume, and other respiratory parameters. Doctors can click on any date in the line chart to see detailed session metrics for that specific day, or select an individual metric to analyse its daily trend over time.
This level of interactivity supports more precise clinical evaluation and follow-up decisions. By combining device performance data with patient health indicators, clinicians can quickly detect irregularities, assess therapy effectiveness, and adjust treatment plans where needed. The dashboard turns complex respiratory data into a practical decision-support tool for ongoing patient care.
Healthcare dashboards are no longer optional. From pharmaceutical sales and operational expense control to referral management, overtime monitoring, device compliance, and patient health tracking, structured analytics helps healthcare organisations operate with clarity and confidence. When leadership, finance teams, and clinicians work from the same trusted data, decisions become faster, risks are identified earlier, and performance improves across the board.
If you’re ready to improve financial visibility, streamline operations, or gain deeper insight into patient data, contact us today to discuss your requirements.
![]()
![]()
![]()