DOMO CRM dashboard automatically extracts the data from systems like Hubspot, Zoho CRM or Pipedrive and visualize it to find trends and patterns in the data. The goal of the DOMO CRM dashboards is to analyze the sales pipeline, identify inefficiencies and plan for strategies to resolve them.
Our consultants developed DOMO CRM dashboards for a real estate development company by extracting data from Hubspot. This dashboard is used by the senior leadership to track the sales team productivity and their results.
In this article we will review the dashboards that our DOMO consultants developed and explain how they are used by the client to drive meaningful change.
The sales activity dashboard is designed to monitor the prospecting activity of the sales team e.g. sales calls, emails, SMS messages and completing their tasks.
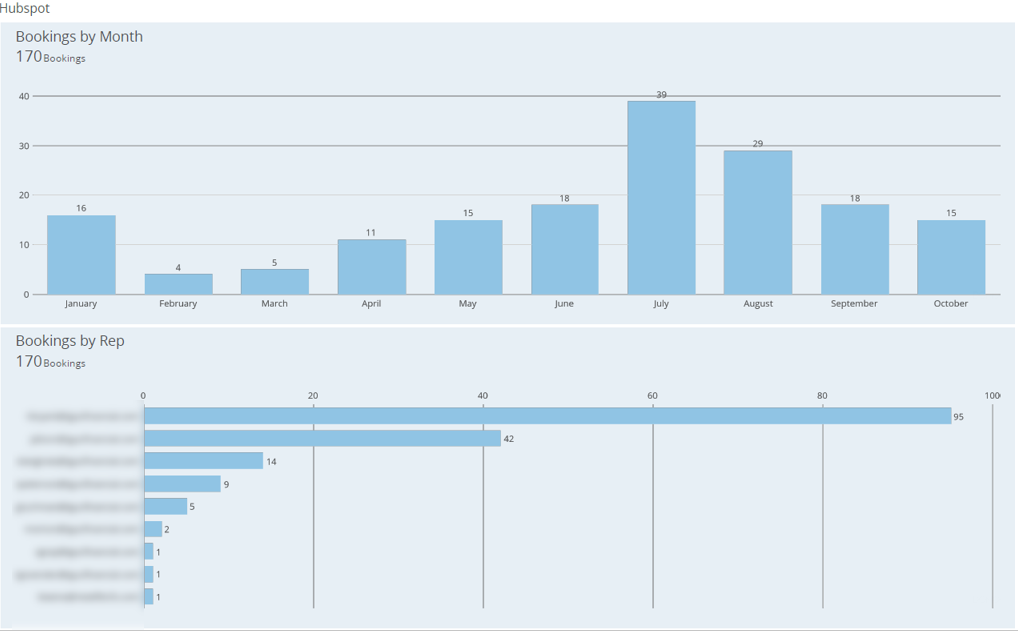
The first part of the dashboard shows the sales activity leaderboard by sales rep. The total number of activities is made of Hubspot tasks, notes, outbound and inbound emails, calls, meetings and SMS messages.
The number of activities is broken down by the sales rep to highlight the most active members of the team.
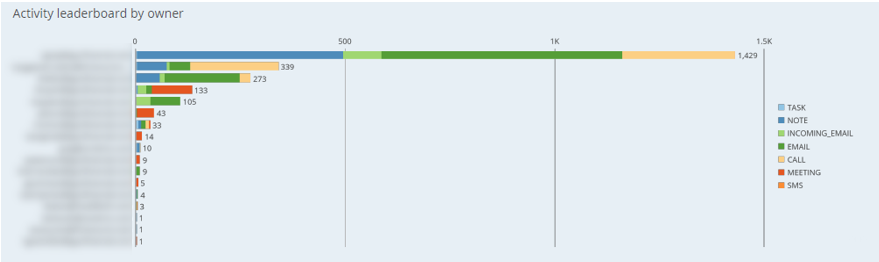
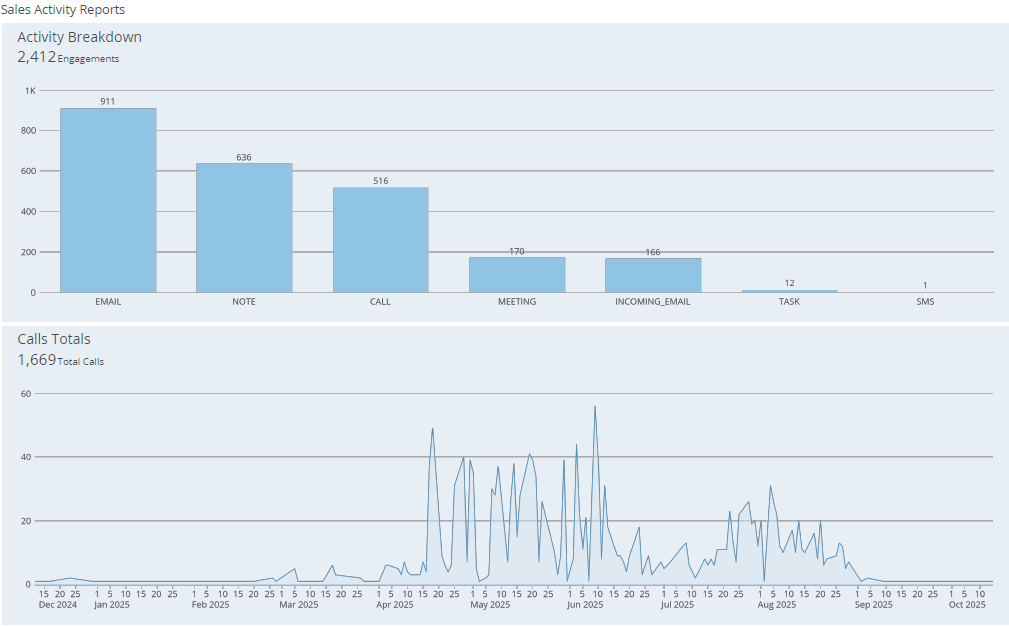
The next part of this DOMO CRM dashboard is breaking down the total number of activities by activity type. This analysis helps to analyze whether the team is doing enough sales calls or relying too heavily on emails.
The number of calls is then broken down by day so that the team can track when the number of calls is going down.
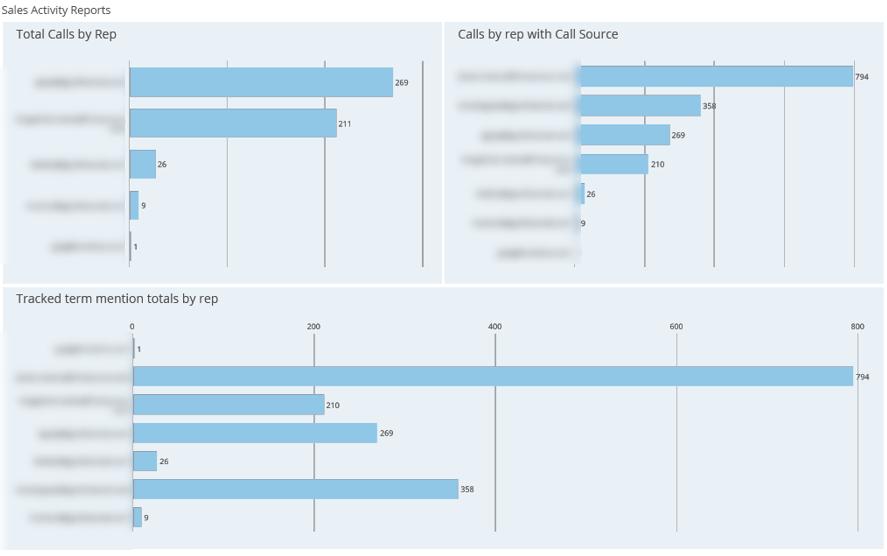
The next part of this dashboard analyzes the number of calls by sales rep.
In this case study Hubspot was also integrated with a call tracking software which tracked when a certain phrase was mentioned in a call. This data was then recorded in a “tracked term” column in Hubspot. We then used this column to create a chart showing the number of tracked term mentions by sales rep.
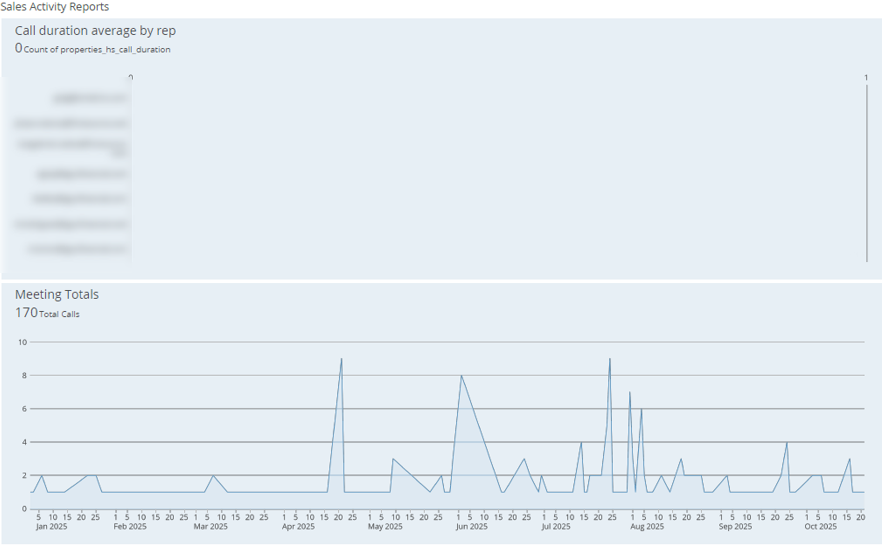
We also analyzed the average call duration by sales rep. The sales team that we worked with was still working on tracking call duration so there was no data in this chart at the time of writing this article. However, once they start tracking this data, the chart would automatically populate.
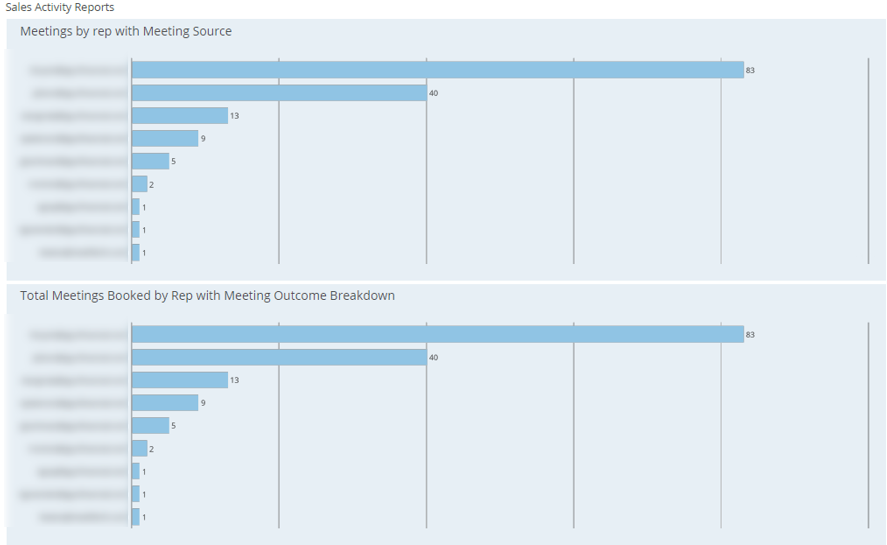
We also analyzed the daily trend for number of meetings to highlight the team effectiveness at organizing sales demos.
We then analyzed the number of meetings with tracked meeting source and meeting outcome. These charts are designed to analyze whether sales reps are entering data on meeting source and outcome properly into Hubspot.
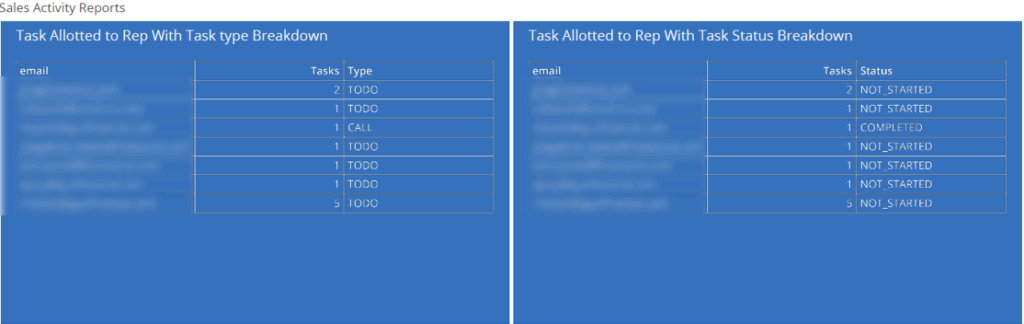
Finally, we analyzed the number of tasks by type and status for every sales rep.
The sales pipeline dashboard is designed to analyze the outcomes of the activities perfomed by sales reps: number of meetings, deals and revenue.
It started with analyzing number of meetings by client industry to highlight the industries where the company is seeing most interest right now.
We then analyzed the number of deals by lead source to identify the most effective lead generation channels.
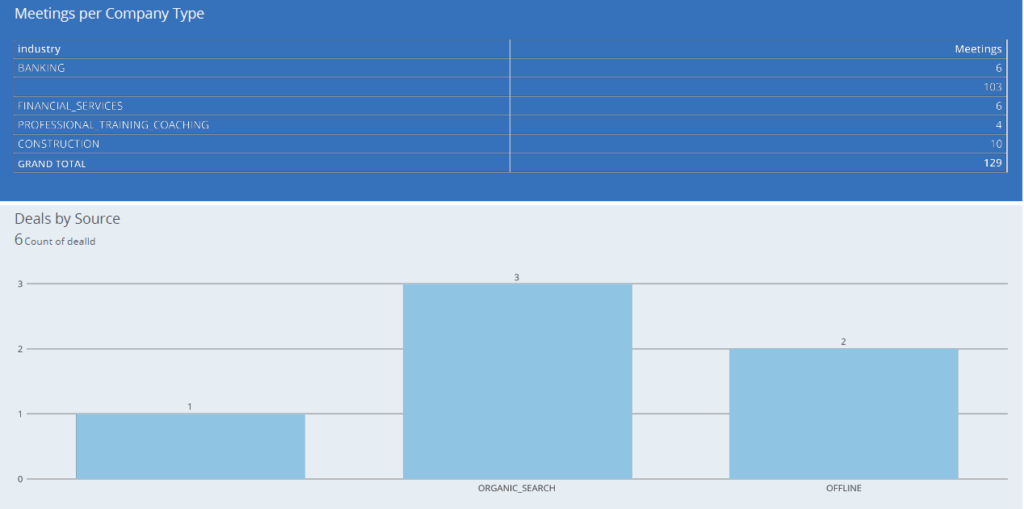
We then analyzed the number of deals by company type and deal size this year. This analysis helps to identify the average project size that the company is bidding on.
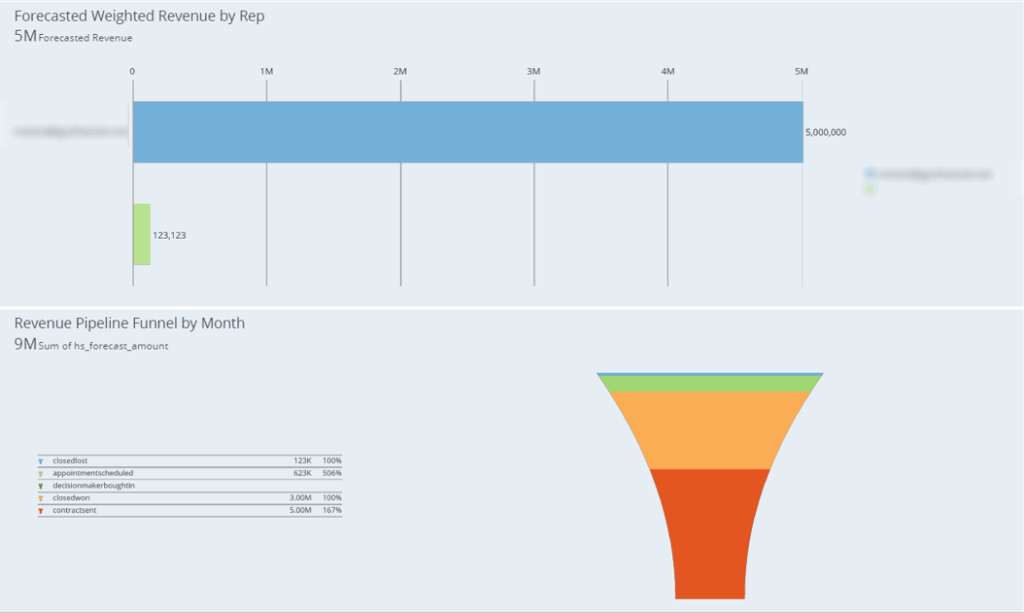
We then created the weighted pipeline analysis where the sales amounts for each deal were multiplied by the % likelihood of the winning the deal. The weighted pipeline revenue was then broken down by the sales rep and deal stage.
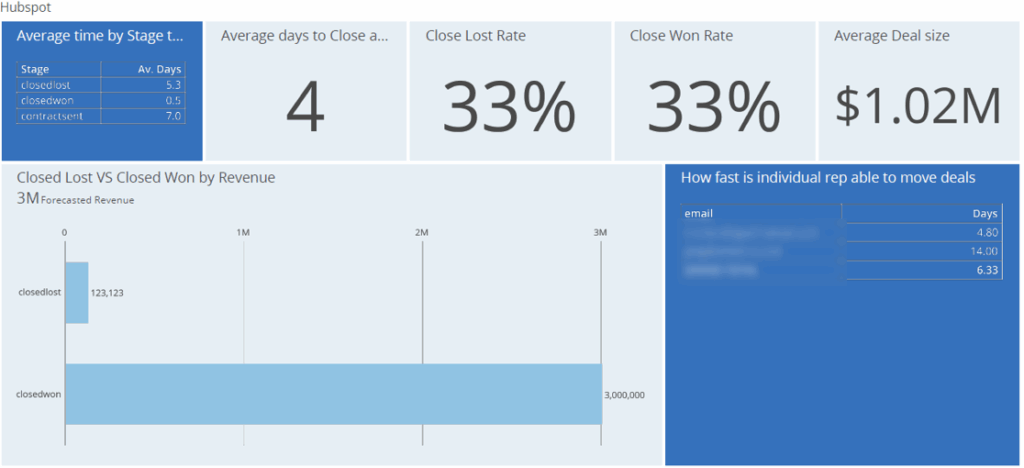
Finally, we analyzed the average number of days it takes to move the deals forward. The table at the top is showing how many days an average deal is spending in a certain stage. We also analyzed how many days on average it usually takes every sales rep to close a deal.
The cards at the top are showing average number of days to close a deal, average deal size and % of won/lost deals.
Our dashboard developers have delivered 1,000+ projects for 600+ clients including Google, Teleperformance and Heineken. We would be excited to bring our experience to your project.
Reach out to us today to discuss your DOMO project!

Support
All the support you need – when you need it. From 1-hour quick fix support to longer-term partnership that drives your business forward.

Consultancy
Advanced data thinking, creative ideas and the best Power Platform practices to unlock the true potential of your business data.

Training
Succeess shouldn’t be a one-off. When we train you teams user adoption surges and your Power Platform results radically improve.
![]()
![]()
![]()