The DOMO financial analytics dashboard is a collection of graphs that analyses the trends and patterns in the accounting and financial data. The goal of this analysis is to find insights that assist financial management of the business and make financial planning more predictable.
DOMO financial analytics dashboards usually pull data from accounting and finance systems like QuickBooks Online, Xero, NetSuite or alternatives.
In this article, we will discuss how our DOMO consultants have built a financial analytics dashboard for a real estate development company. We will look at the created analysis and discuss how it is used by the finance team.
Our consultants used the native QuickBooks Online connector in DOMO to pull the data into the dashboard. We then transformed the data using SQL transform, which gave us a lot of flexibility for writing formulas.
In general, we always recommend to use SQL transform instead of Magic ETL in DOMO for flexible data transformation process.
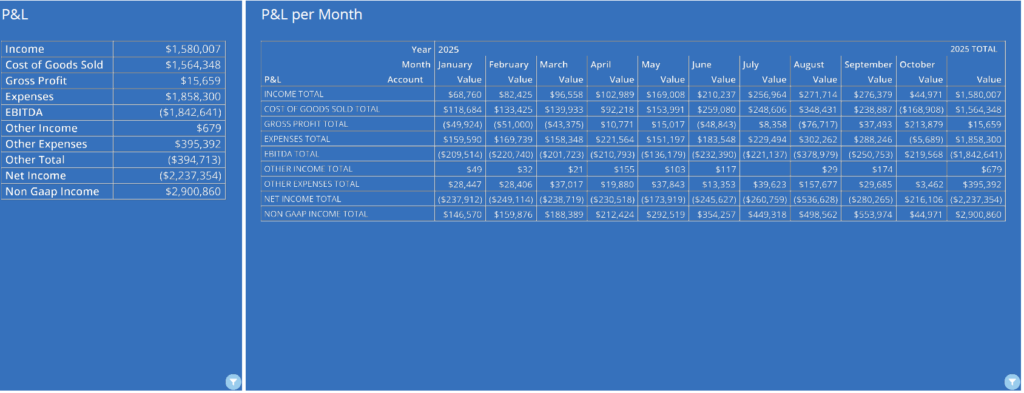
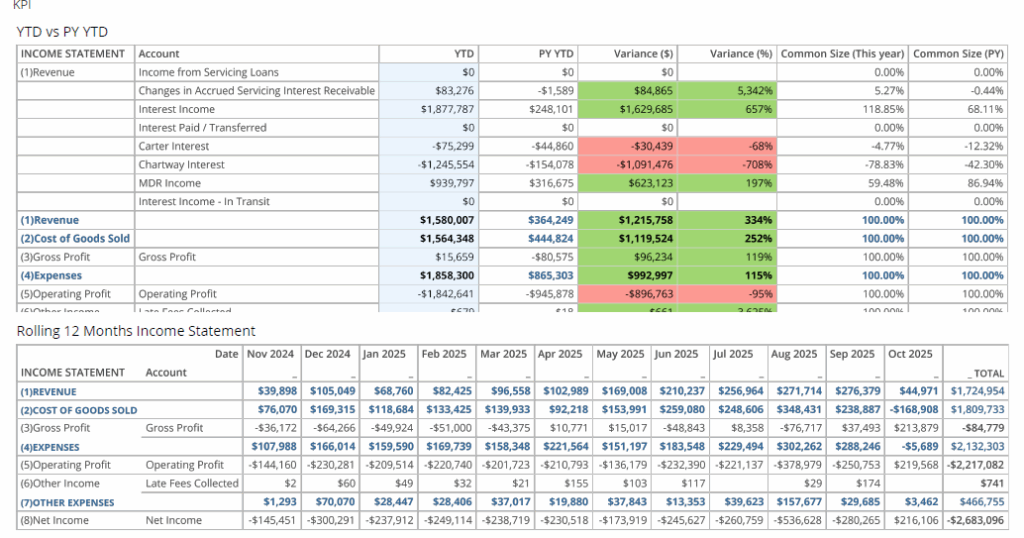
The P&L dashboard in DOMO presents the year-to-date view of all the classic profit and loss metrics: income, gross profit, expenses, net profit, etc.
The P&L table is an essential part of the DOMO P&L dashboard since this is the format that most finance departments easily understand.
It is an important part of financial analytics since it gives the business owners a bird’s-eye view on their business performance.
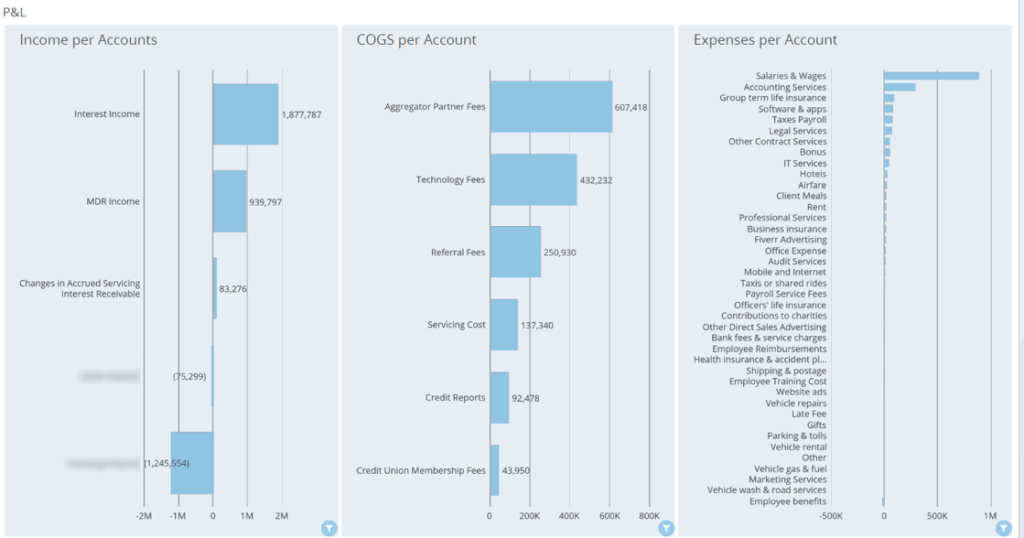
The next part of our P&L dashboard visualizes income, COGS and Expenses per account. We visualized them in graphs to demonstrate their proportional distribution across all the accounts.
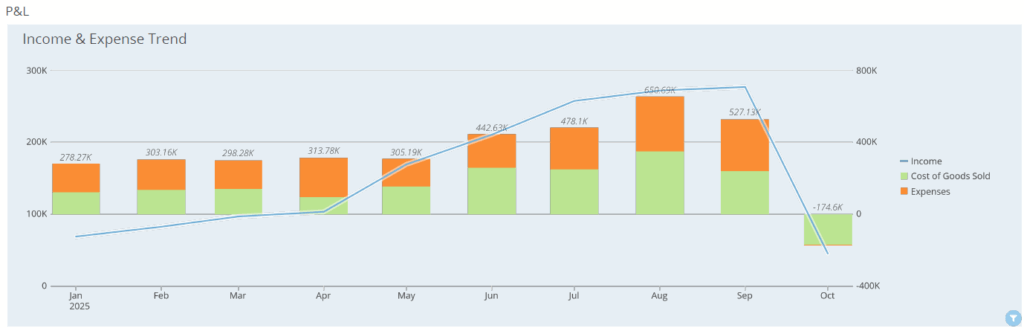
Finally, we analyzed the income and expenses per month to show the clients the months when income covered all the costs. As you can see from the graph below, the company was basically burning cash reserves until June this year since income didn’t cover costs.
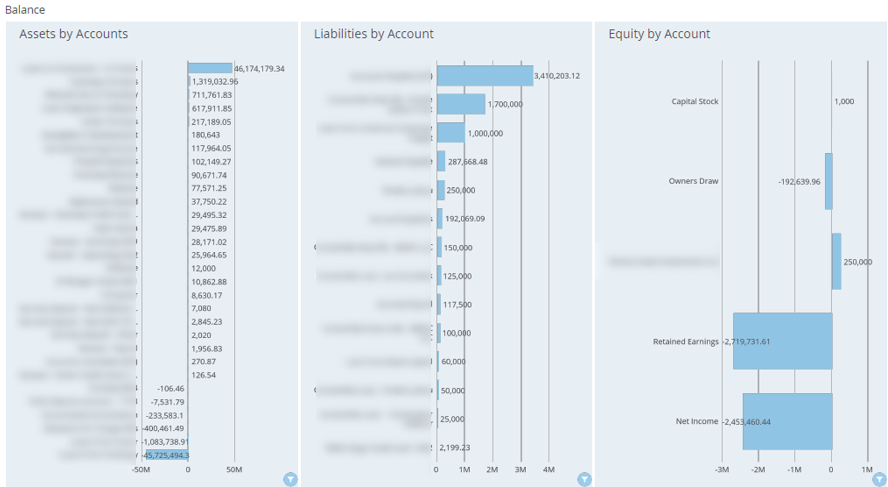
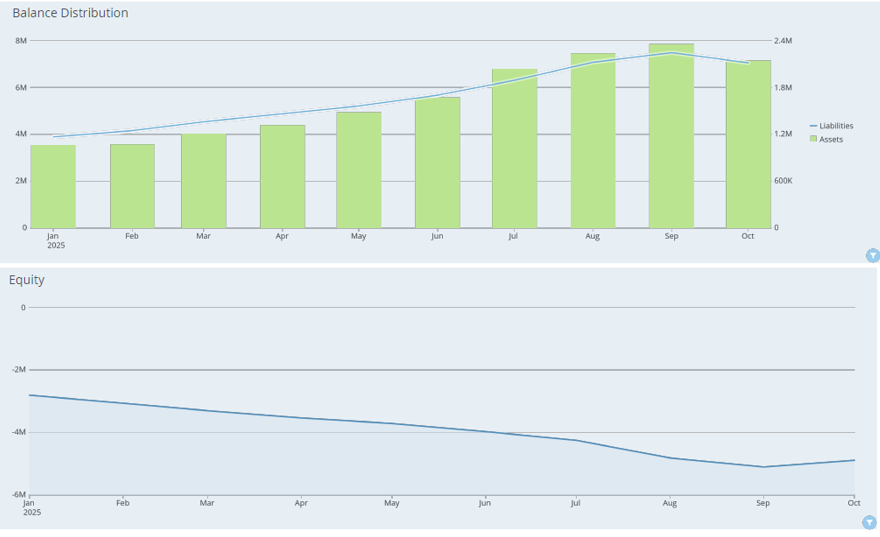
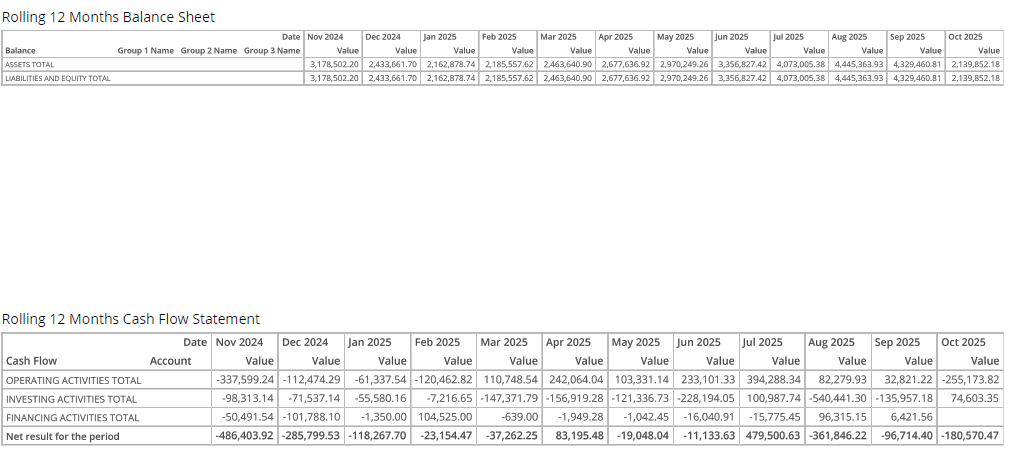
The DOMO balance sheet dashboard visualizes the value of assets, liabilities and equity in the business.
We first visualized all of these metrics by account to show what are the largest business assets and liabilities. Tracking the balance on largest liabilities is especially important for real estate businesses since they often take large loans and mortgages to pay for their projects.
We then analyzed the trends for assets, liabilities and equity per month to help the CFO track how the balance is changing over time
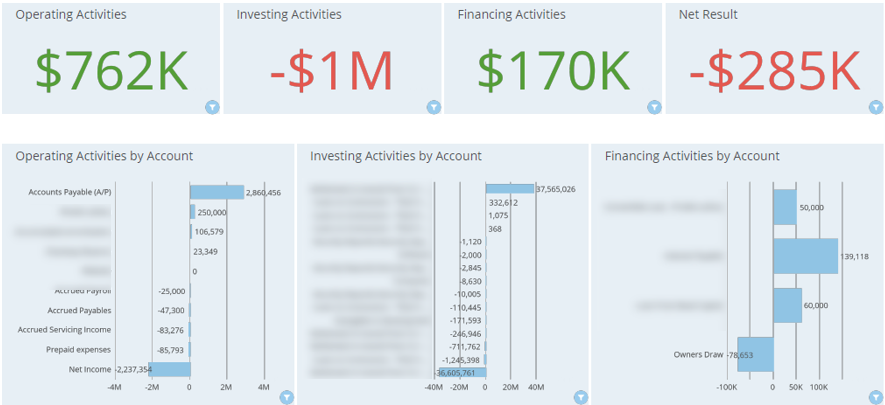
The DOMO cash flow dashboard visualizes how much cash is going in an out of business in a certain time period. When the data is pulled from QuickBooks Online, the cash flow activities are automatically grouped to operating, investing and financing.
We analyzed the total change in cash for every type of financial activity over the selected period of time. We then visualized which accounts were most responsible for the changes in cash balance.
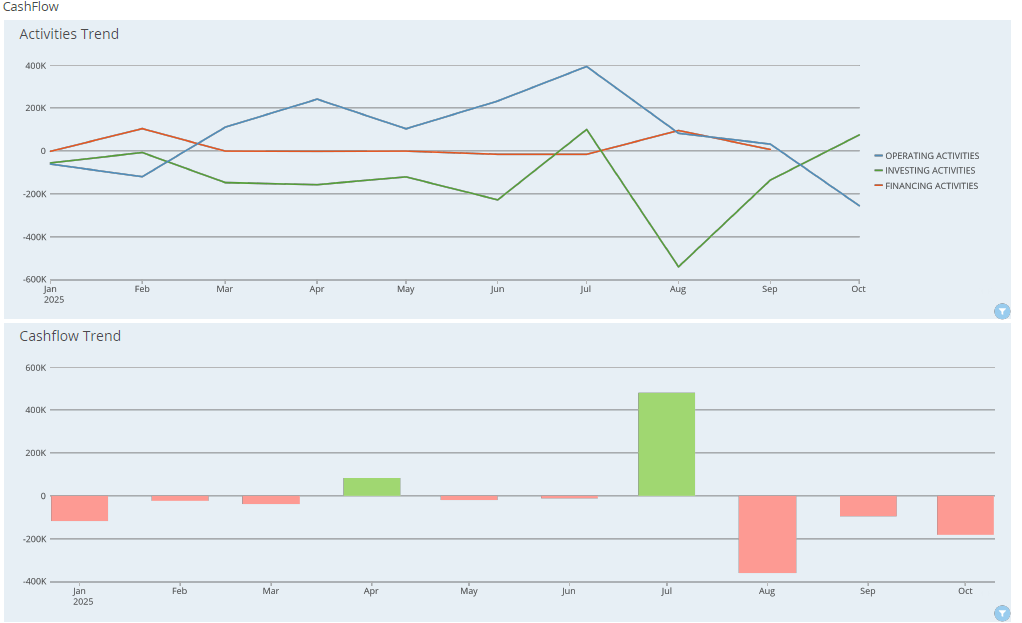
We then analyzed the monthly trends for cash flow: whether amount of cash in the bank increased or decreased in a particular month. We also broke down the cash flow per month by activity type: operating, financial and investing.
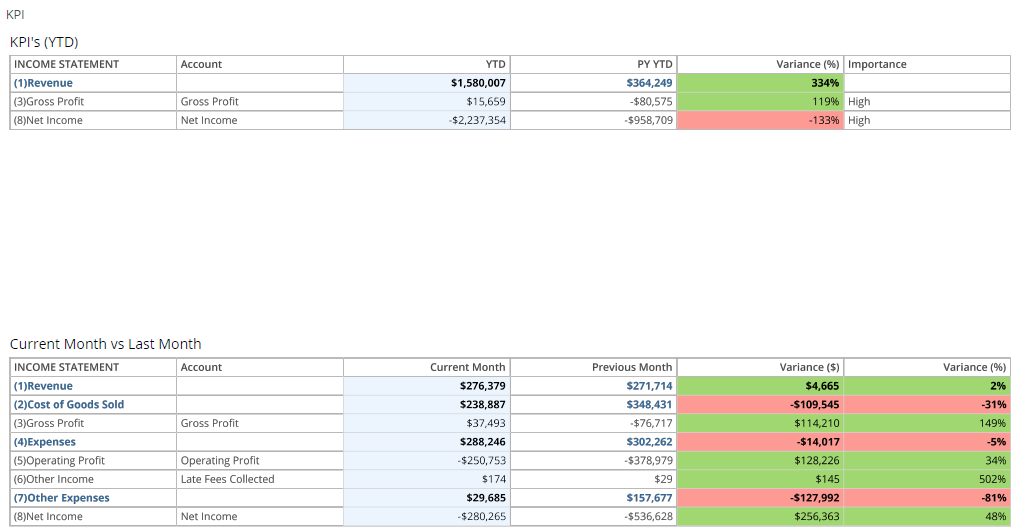
DOMO financial statements dashboard analyses the statements like P&L, Balance Sheet and Cash Flow by comparing the current performance to the past.
The dashboard starts by analyzing the P&L metrics YTD and comparing them to the previous year YTD.
The P&L statement for the current month is then compared to the same statement for the month before. Conditional formatting is then used to find the financial KPIs that increased and decreased.
Our BI consultants have delivered 1000+ projects for 600+ clients including Google, Teleperformance and Heineken. As a result, Vidi Corp is recognized as the #1 BI consultancy in the world by G2. We would love to bring our experience into your project!
Contact us now to discuss your DOMO project in more detail!

Support
All the support you need – when you need it. From 1-hour quick fix support to longer-term partnership that drives your business forward.

Consultancy
Advanced data thinking, creative ideas and the best Power Platform practices to unlock the true potential of your business data.

Training
Succeess shouldn’t be a one-off. When we train you teams user adoption surges and your Power Platform results radically improve.
![]()
![]()
![]()