This Power BI survey results dashboard was created by our Power BI consultancy for one of our clients. There are a lot of valuable lessons in projects like this that we want to share with our readers including ideal survey data format, data visualisation practices and data transformation guides.
The client from this case study is a recruitment company who run an EDI survey to measure demographic trends across marketing professionals. The goal was to identify what the impact of different protected characteristics is on career progression.
The survey came in the form of anonymised answers on an excel spreadsheet. This data was supplemented by the UK average numbers in the census survey. The census data was manually extracted into an Excel spreadsheet and loaded into the data model.
We hope that this case study will inspire you to create your own Power BI survey results dashboard. If you need any support with creating your dashboard, please contact us!
Very often working with survey data is no easy task! Survey results are often in a data format that can be easily consumed by a human but significant data transformation is needed to analyse data in Power BI. For example, free text answers may contain unusual characters and make it difficult to categorise the data.
Power BI is quite well-equipped for dealing with such challenges due to advanced data transformation capabilities. By using Power Query it is possible to transform the data to a convenient format before loading it to Power BI.
If you are planning to analyse your survey data in Power BI, the most convenient data format is something like this:
| Respondent ID | Answer Date | Question 1 Answer | Question 2 Answer | Question 3 Answer |
| 1234 | 15/11/2024 | Categorical Field | Categorical Field | Categorical Field |
If you receive your survey results data in this format, it will be super easy to create a Power BI dashboard from it. Therefore, if you have control over how you are gathering survey data, we recommend to gather it in this format!
However, survey data often comes in formats like the one below
| Respondent ID | Answer Date | Your Gender (Male) | Your Gender (Female) | Your Gender (Prefer not to say) |
| 1234 | 15/11/2024 | True | ||
| 1235 | 15/11/2024 | True |
We have seen data formats like this as well and they require significant data transformation efforts to bring them to the ideal format. You can do this data transformation yourself or work with a professional Power BI consultancy!
The main goal of this project was to generate headlines about how different demographic characteristics affect the career prospects of the marketing professionals. Those headlines were then used for the PR activity and also to generate interest of the current clients into custom survey projects.
Vidi Corp produced a lot of analysis but only kept the data visualisations that resulted in insights which could be used as headlines. 4 out of 10 pages that were produced are presented below.
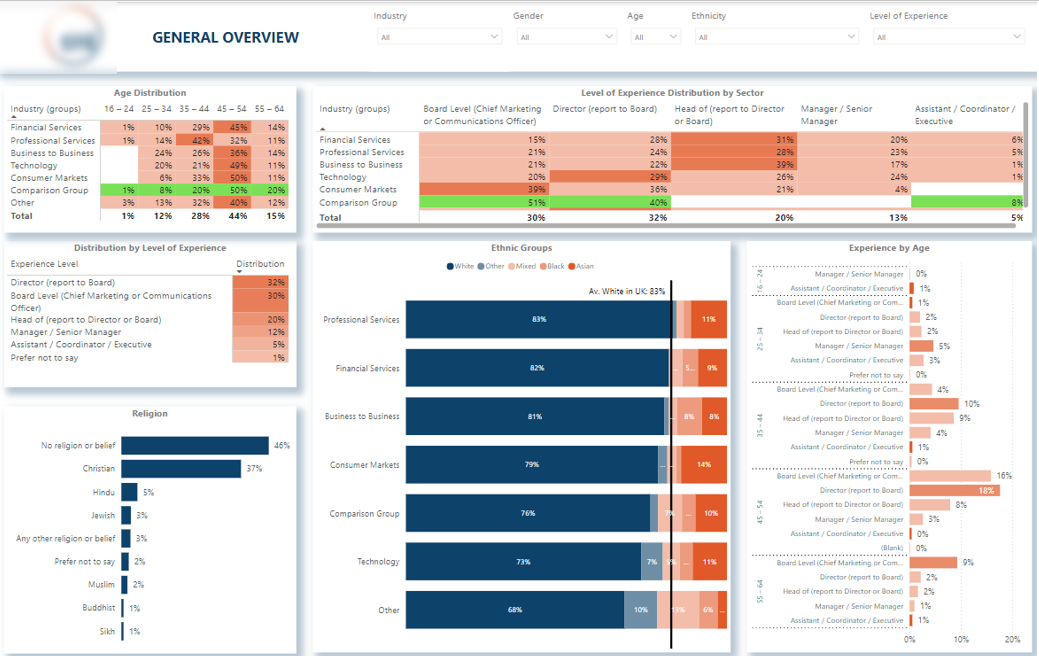
The general overview page highlights the age distribution of marketing professionals in every industry. It is clear that 45-54 is the most popular age group in every industry among the surveyed demographic. The only exception is the professional services industry where 34-45 is the most popular group.
Every industry was compared to the US average for % of white employees. The technology sector was most ethnically diverse and the professional services sector was least diverse.
It was found that most 25-34 year olds work in the manager position, most 35-44 year olds work as a director or head, most 45-54 work as director or board member and most 55-64 year olds work as a board member.
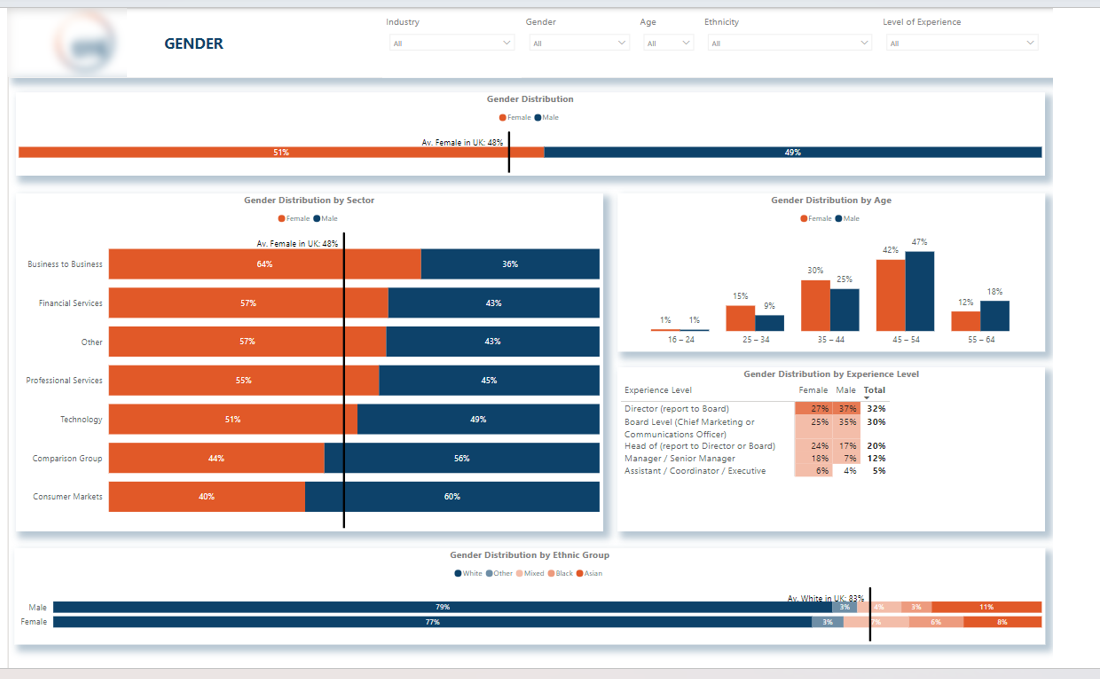
The gender tab analysed which industries provide most gender diversity. For example, the business to business sector is most welcoming to female employees whereas consumer markets is the least welcoming sector.
It was found that 25-44 age groups are more dominated by women whereas 45+ are more dominated by men.
There are more women on manager and department head roles whereas there are more men on board and director levels.
The sexual orientation tab uncovered that employers tend to hire more homosexual men than women. All the industries were also ranked in terms of sexual orientation diversity. 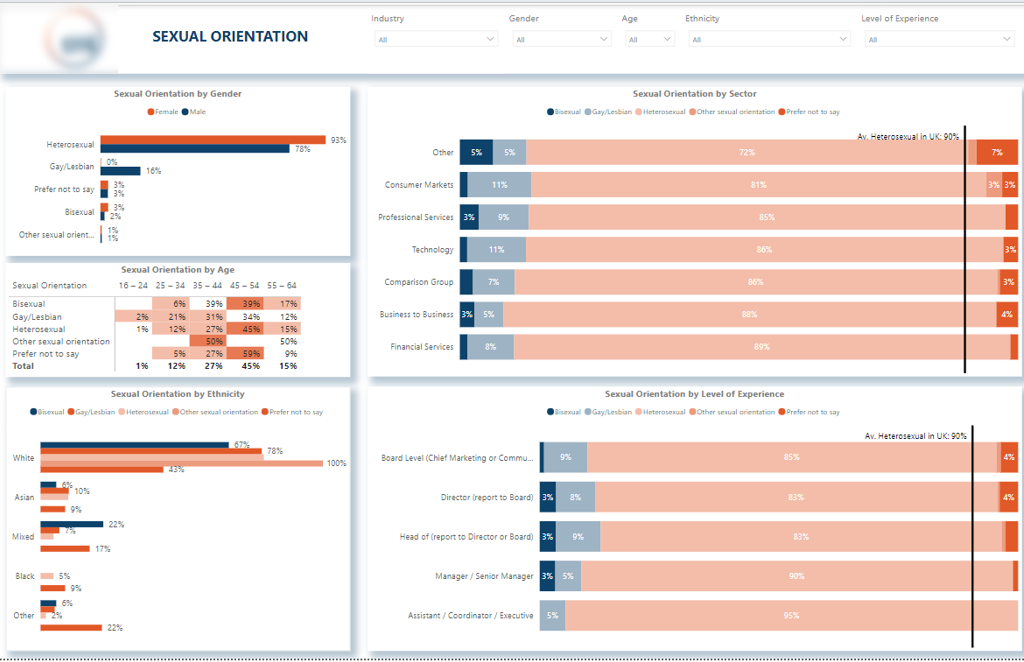
The ethnicity tab showed ethnic diversity by sector and seniority level and compared the results with the UK average. 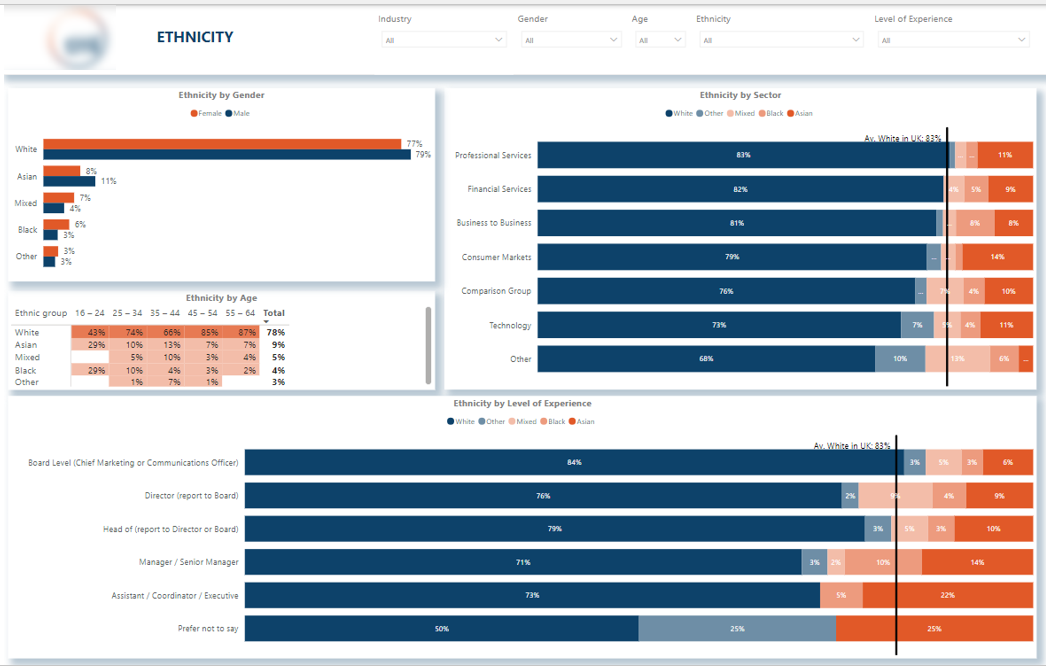
Do you also need to create a Power BI survey results dashboard? If so, please contact us now to plan your survey analysis project!

Support
All the support you need – when you need it. From 1-hour quick fix support to longer-term partnership that drives your business forward.

Consultancy
Advanced data thinking, creative ideas and the best Power Platform practices to unlock the true potential of your business data.

Training
Succeess shouldn’t be a one-off. When we train you teams user adoption surges and your Power Platform results radically improve.
![]()
![]()
![]()