A public manufacturing company needed help migrating a set of 8 manual excel reports into Power BI as part of the company-wide shift away from using spreadsheets for reporting. The client wanted to complete the migration within 3 months, automating the reports and improving the data storytelling along the way.
One of the client reports in particular was built by an intern for the senior management team. The senior management appraised the report highly but the report took a full day of manual work to refresh fully.
Vidi Corp was engaged to help plan for dashboard automation and develop the Power BI reports.
A consultant from Vidi Corp joined the client team for a day-long workshop. As part of the workshop we learned the client KPIs in all the reports, the data that was used to build them and the desired outcomes.
We provided recommendations to the technical team about the automatic data feeds that we needed for the reporting. We also identified that some reports shared data sources which allowed us to link 2 or more reports to the same data extract. As a result, there was no more need to refresh the same dataset manually several times.
As part of the project 100+ Power BI pages were created. The most impactful analysis was:
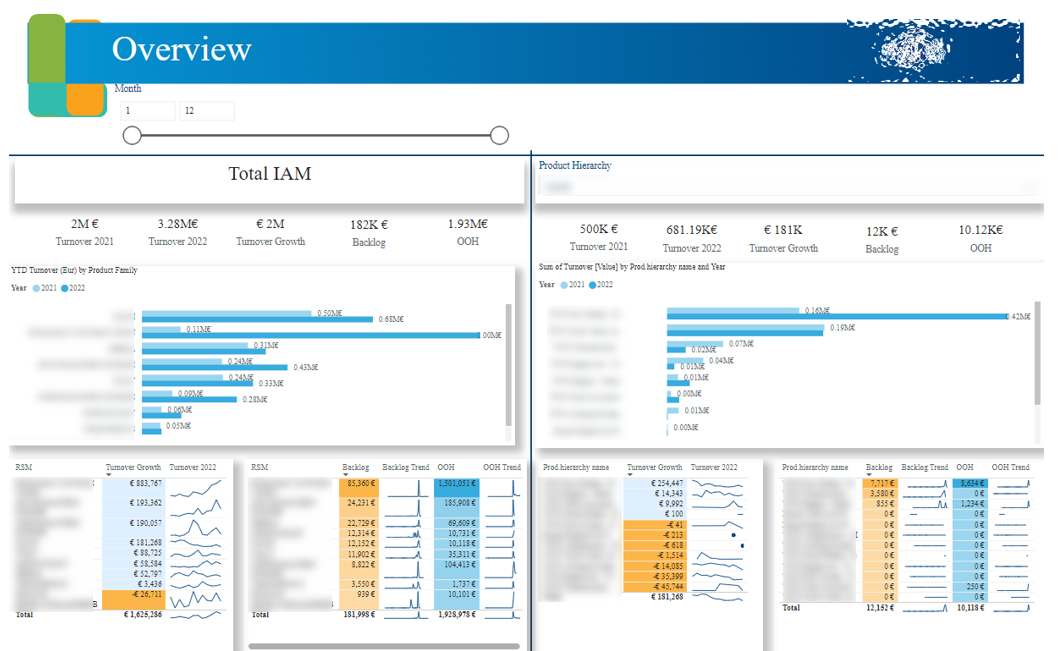
1. Analysing backlog of orders across all the product groups and clients. Identifying the clients that are most affected by the backlog of orders.
2. Identifying the markets with YoY revenue growth highlighting opportunities for regional growth
3. Identifying product groups and materials with highest and lowest YoY growth
4. Creating side-by-side comparison of a particular region/product group to the overall market
5. Identifying products and markets where recycled materials were used for the manufacturing most and least
Below are some of the pages produced as part of this project
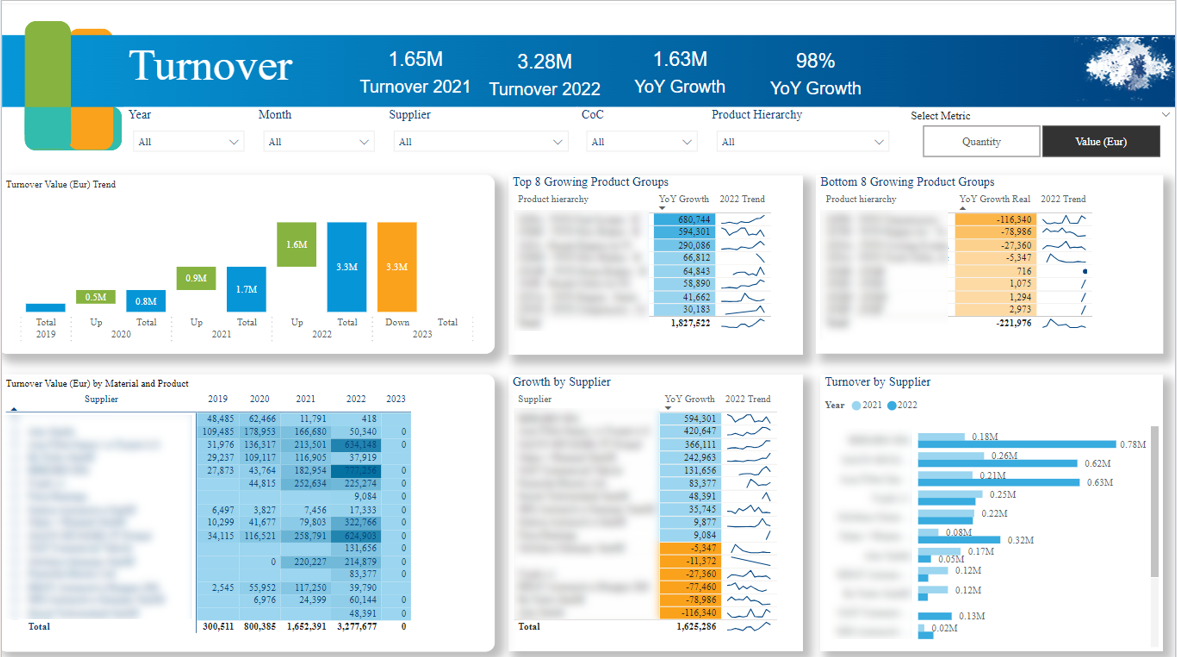
The turnover page highlighted the YoY growth for the company product portfolio. The top 8 and bottom 8 products by YoY growth were identified and sent to the management for a more detailed discussion. The YoY growth by supplier enabled more insights to manage supplier relationships and the insights on YoY growth by region analysis supported regional growth strategy.
The regional analysis page supported conversations on which countries within every region contributed most to the YoY growth. The client could select a product in the filters and see the performance of this product in every country and region.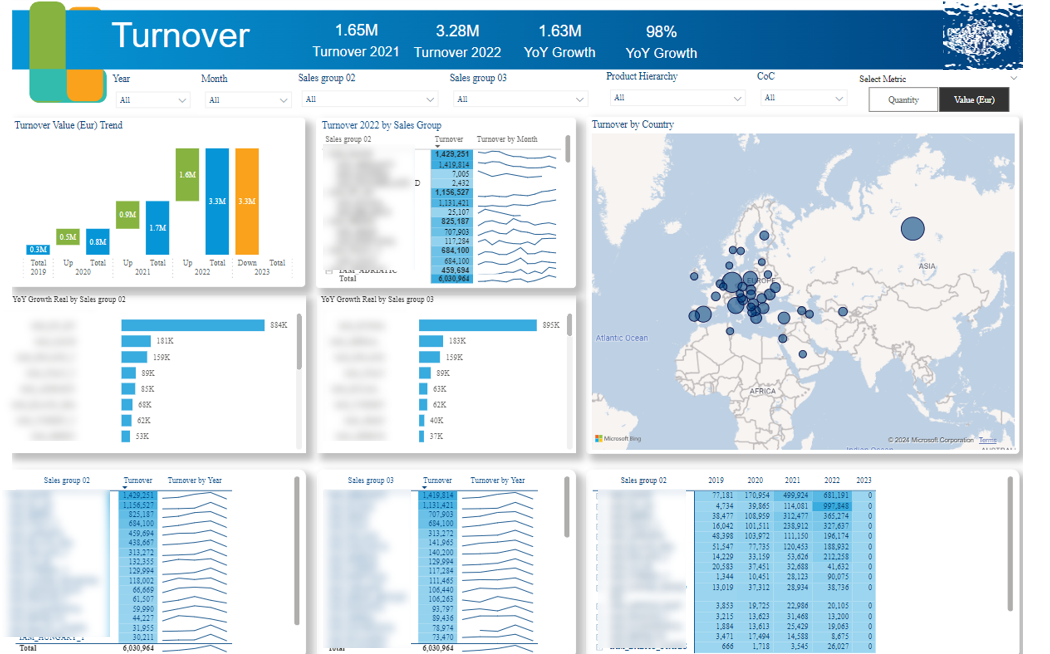
The side-by-side comparison tab enabled the client to compare a particular product by the overall market. This allowed the client to identify products where the distribution of sales by region is different to the company-wide performance. It turned out that some products were showing strong performance in the particular regions even though it wasn’t noticeable when looking at the whole market.
The focus group tab highlighted YoY growth for every key product group. Products showing most and least growth were identified through this tab.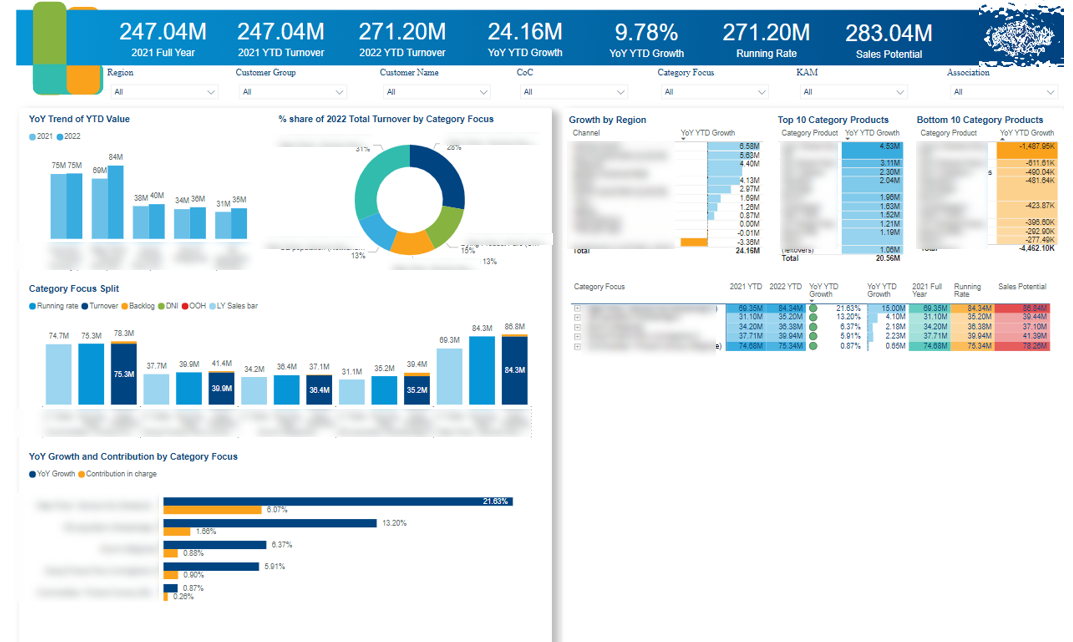
The remanufacturing report highlighted the company’s efforts in moving towards using recycled materials for their production. This supported social goals of circular production. Regions and product families where most remanufactured materials were used were identified. 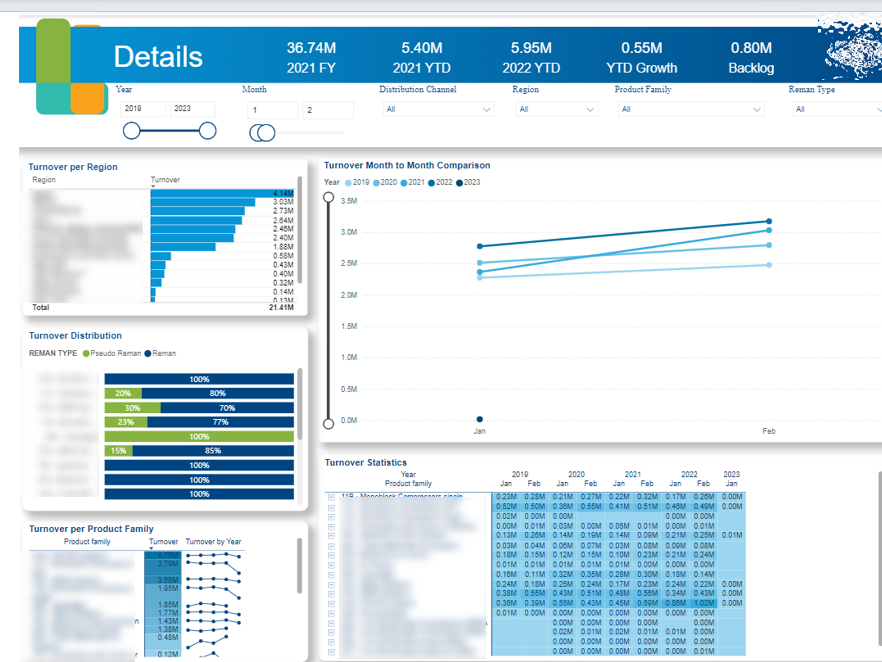
Are you also planning a similar Power BI project? Contact us now to learn more about our experience in delivering similar projects.

Support
All the support you need – when you need it. From 1-hour quick fix support to longer-term partnership that drives your business forward.

Consultancy
Advanced data thinking, creative ideas and the best Power Platform practices to unlock the true potential of your business data.

Training
Succeess shouldn’t be a one-off. When we train you teams user adoption surges and your Power Platform results radically improve.
![]()
![]()
![]()