Power BI project management dashboards are essential for providing clear visibility into project progress, performance, and potential risks. They give project managers real-time insights to monitor progress and make informed decisions.
With the ability to visualize project progress, resource allocation, and risks, these dashboards empower project managers to stay on top of every detail, ensuring that projects are completed on time and within budget.
In this article we will explore 6 essential Power BI project management dashboard examples and explain how they drive efficiency and transparency in project execution.
Let’s jump straight into it.
Power BI is a business intelligence tool developed by Microsoft that enables users to create interactive visualizations and gain valuable business insights. Its user-friendly interface makes it easy to design custom reports and dashboards without extensive technical knowledge. Power BI integration capabilities allow users to connect to a wide range of data sources, allowing them to analyse data in a unified interactive dashboard.
The platform offers multiple licensing options: free version, Power BI Pro and Power BI Premium. Power BI interface and its powerful capabilities make it an essential tool for businesses to track operations and spot data trends.
Using Power BI helps project managers to get real-time data about budget and schedule, improving resource allocation and preventing unexpected budget overrun.
Power BI project management templates improve accountability because they show team members’ progress and results. Team members become more aware of their outstanding deliverables, improving organisational confidence in the direction of the project.
Finally, tracking risk indicators in Power BI dashboards helps to identify potential issues and prevent them before they can affect overall project performance. This allows team members to adjust strategy and resources when needed, ensuring better control over timelines.
Power BI is usually implemented for project management reporting when companies want to pull data directly from ClickUp, Jira, and other sources to create one unified view of project performance. Automated reporting and customized dashboards help teams collaborate more effectively and make faster, data-driven decisions.
Let’s discuss each use case in more detail.
Power BI can connect to multiple data sources like Excel, SharePoint, Jira, and ClickUp, eliminating the need for manual data extraction. This ensures that all team members have access to consistent and up-to-date information about project performance.
Power BI reports refresh automatically. This enables managers to continuously monitor key metrics continuously, allowing for proactive action based on live data signals..
Dashboards can be shared across departments securely, promoting open communication and alignment across the organisation. Integration with tools like Microsoft Teams and SharePoint further streamlines communication and supports efficient decision-making.
Power BI custom visuals allow organisations to create visualisations that are tailored to specific business needs. You can also create reports for different audiences. For example, an overview report for executives and a detailed tasks view for project managers.
Task status dashboard breaks down the tasks by status, project and team member. It is used by project managers to keep track of outstanding tasks, time spent and analyze performance by employee.
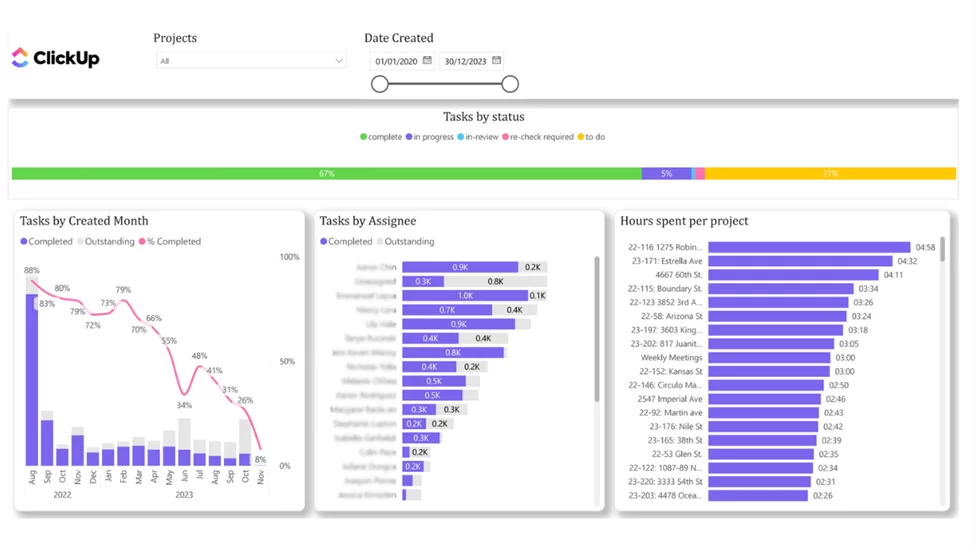
This Power BI project management dashboard shows tasks created each month, who they are assigned to and how much time is spent on each task and project.
It visualizes the number of completed and outstanding tasks by month. The trend line indicates the completion rate, helping project managers evaluate the progress made every month.
This section of the task status dashboard is used to analyze the progress made by the whole team. This analysis is used to compare the performance of different team members to each other and identify those who complete less tasks or don’t log their activity properly.
The next section of this Power BI project management dashboard helps to analyze the task status for individual employees. The project managers can use the filter at the top to select a team member.
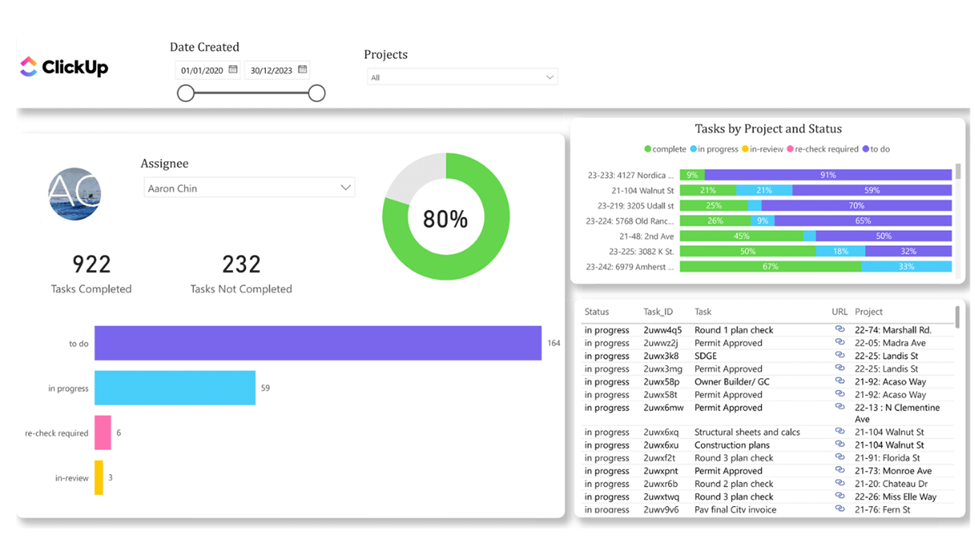
This dashboard then analyzes the number of tasks in every task status and filter to those where the team member is blocked. Project managers can see the list of individual tasks in the table below and click on the link icon to go to this task in ClickUp.
Finally, the bar chart above shows the number of tasks by status for every project. This helps the project managers to clearly see which projects are still ongoing and which ones require their attention.
The resource allocation Power BI project management template analyzes how the working hours of every member of the team are utilized. The number of hours is analyzed by resource, task type, project and many other granularities.
Resource allocation Power BI dashboards are usually fully custom for every company but they have some things in common:
You can see an example of resource utilization Power BI dashboard below. Our Power BI consultants developed this project management dashboard for a company that organizes corporate events in London.
The first section of this Power BI project management analyzes the number of actual hours vs quoted hours by month. It also shows how many projects were delivered 20% below the estimate, 10% below etc.
This analysis helps the project managers to evaluate how accurately the team is able to estimate for an average project. Equally it is analyzing the ability of the team to deliver within the estimated time.
The bar chart below analyses actual and estimated hours by employees to evaluate who is struggling to meet estimates.
Finally, the actual and estimated hours are broken down by project and task type. This analysis helps to quickly identify problematic projects and task types on these projects.

The next tab of this Power BI project management template illustrates the percentage of time spent on billable versus non billable tasks. Billable tasks are related to service delivery whereas non billable tasks related to admin and sales.
This analysis is designed to find utilization of team members for billable vs non billable tasks. It ultimately supports the efforts to optimize profitability of the whole team by monitoring the % of billable hours and ensuring that it stays within the target.

This section of the resource allocation dashboard analyzes the % utilization of resources and departments for billable vs non billable tasks. It also analyzes the team % utilization for billable tasks by month to ensure that the high level of billable activity is maintained consistently.
Overall, this Power BI Project Management Dashboard serves as a comprehensive executive-level reporting tool that provides a clear overview of how resources are being utilized across projects. It gives project managers clear visibility into overall project efficiency and performance.
Milestones Progress Power BI Project Management Dashboard shows how projects are moving through key phases and deliverables. It tracks the status of each milestone, allowing project managers and executives to monitor progress in real time.
It also visualizes milestones on a Gantt chart, providing a clear view of milestones that are approaching a deadline.
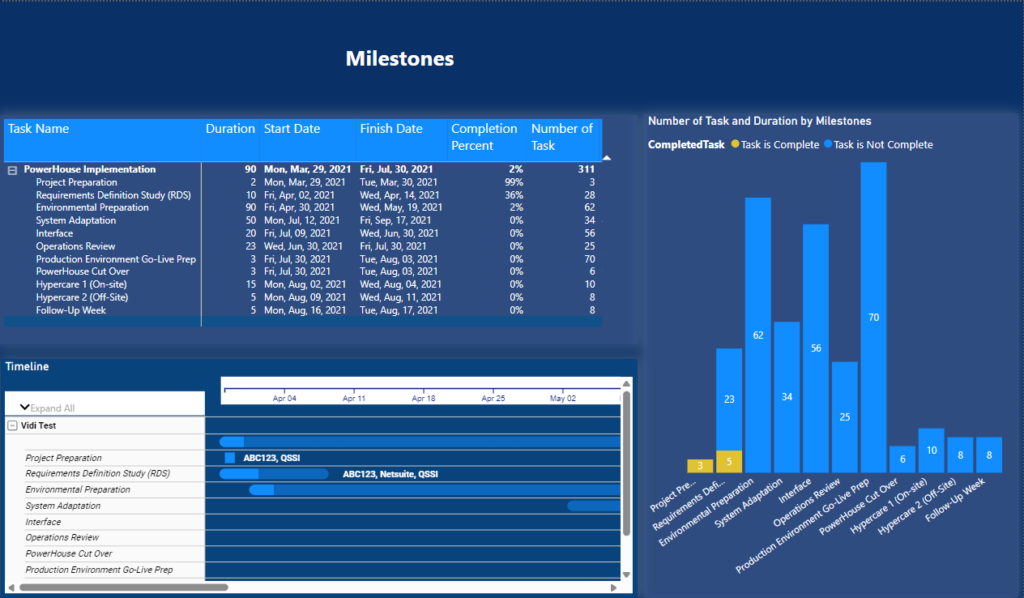
The next tab provides project managers with an overview of task progress for every milestone and completion percentage across ongoing projects.
It shows a table with all current tasks, a graph with percentage of tasks completed, overall completion %, task assignment and cards with days remaining to complete tasks, overdue tasks, newly added tasks, and completed tasks within the selected time frame.
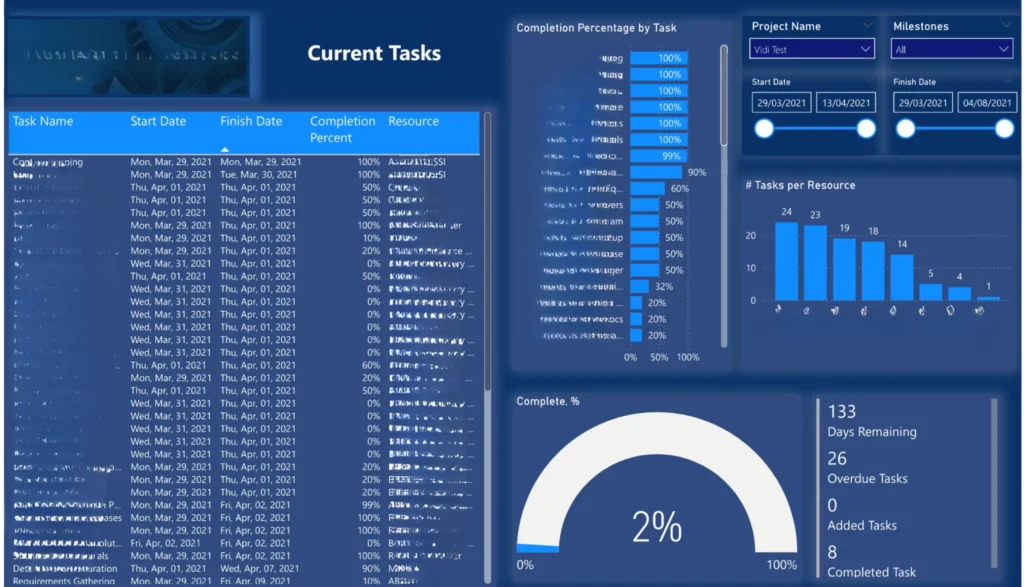
This Power BI project management dashboard helps to identify potential delays early and keeps projects on track. It also highlights deliverables that need attention, ensuring timely completion and stronger accountability across teams.
You can also watch our video here to see how a project manager used this Power BI template to ensure project success.
This Power BI project management dashboard focuses on assessing the risk levels of individual tasks and their impact on the delivery schedule. It provides project managers with a clear overview of high-risk tasks, which resources raised this risk and the risk levels.
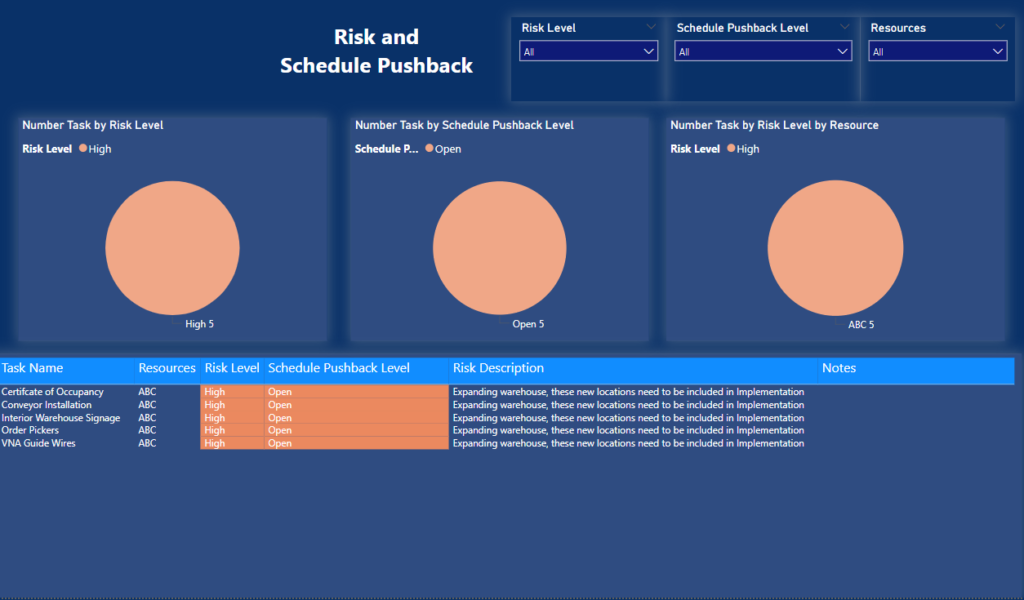
This Power BI project management template enables project managers to track risk factors and take proactive measures before potential issues escalate.
You can also watch our video here to see how a project manager used this Power BI template to ensure project success.
This Power BI project management dashboard helps project managers monitor financial metrics to keep projects on budget. It analyzes the actual project cost, compares it to the approved budget, and clearly shows the Remaining Budget.
Its’ main objective is to keep track of project costs in real time and ensure that the project is delivered within budget. Many organizations complement reporting tools like Power BI with dedicated project management systems that allow them to track finances during project management, ensuring that budgeting, forecasting, invoicing, and profitability analysis are handled within the same operational workflow.
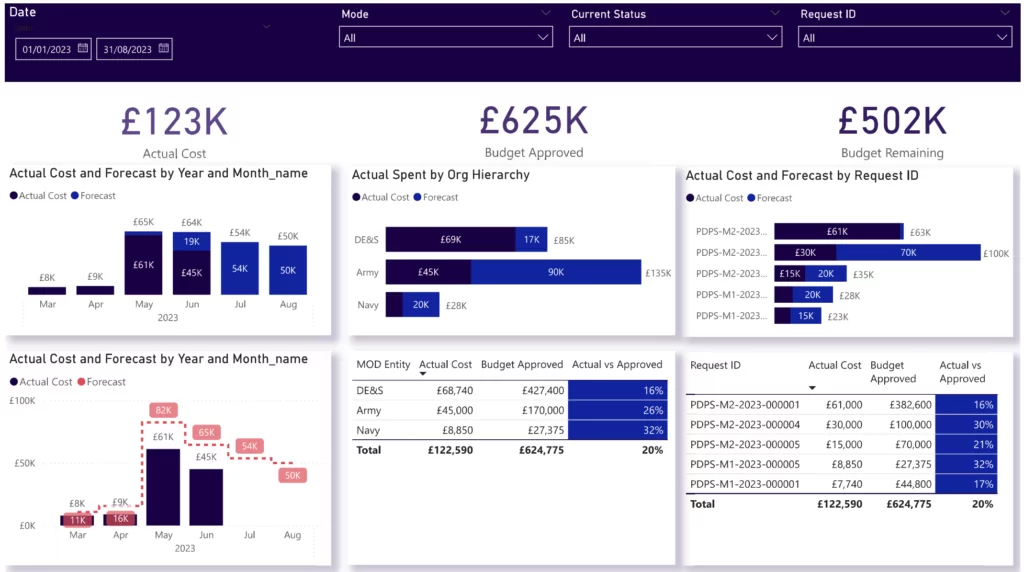
The project budget tracking dashboard shows the actual and forecasted costs by month to help the organizaton anticipate their expenses. This cost is then broken down by departments, resources and initiatives to analyze what exactly the money is spent on.
Overall, this project management dashboard enables businesses to track expenses efficiently, compare actual costs against budgets, and monitor financial performance.
Our Gantt Chart Power BI Project Management template delivers key insights about tasks KPIs. This dashboard offers a detailed view of task progress, deadlines, assignments, and overall project performance.
It provides leadership teams with a comprehensive understanding of ongoing activities and project timelines. A Gantt chart helps to track the progress of each task across the time frame, providing a clear visual representation of project timelines and milestones.

This first section of this Power BI project management dashboard shows the Gantt chart itself and also summarizes it using the graphs above.
The Gantt chart is showing overdue deliverables using red bars and completed deliverables in green making it easy to see the progress by milestone.
The charts above show the total number of tasks by status. Those are then broken down by project and assignee to see which projects are affected the most.
The next tab of Gantt Chart Power BI project management dashboard provides a detailed breakdown of individual tasks and their timelines.
It shows the same Gantt chart but also summarizes the tasks by category and shows the tasks to focus on right now.
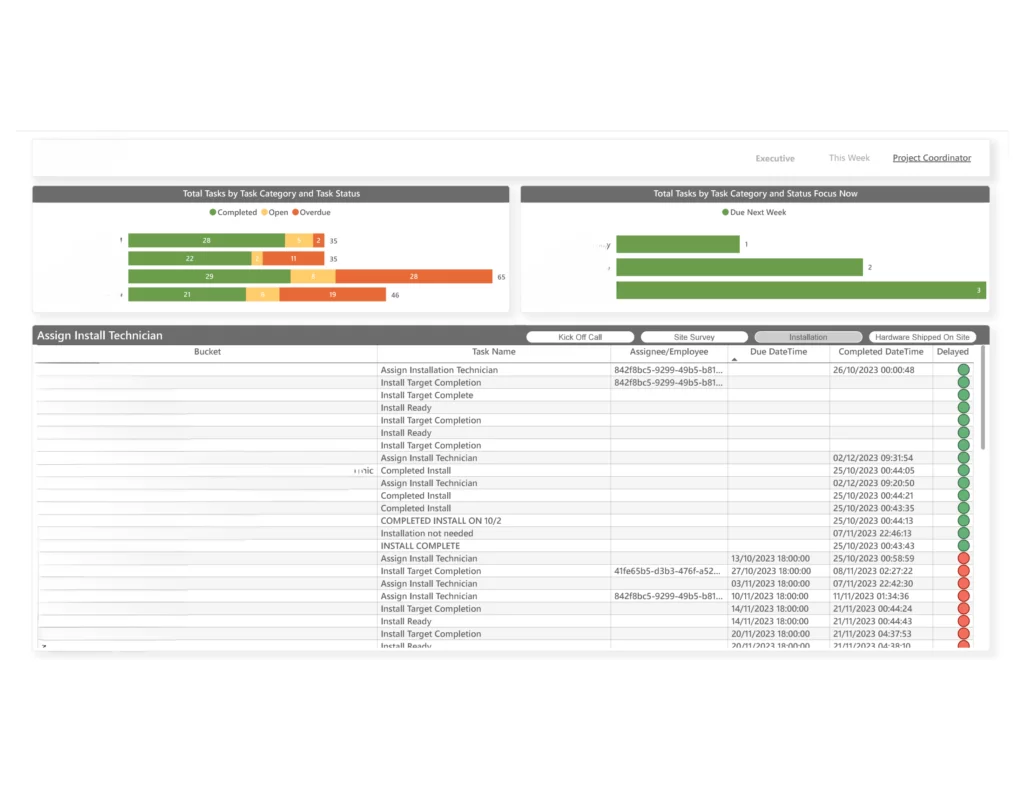
Businesses can export this data for further analysis. Additionally, the tab offers KPIs for task categories and highlights tasks that are due in the upcoming week, helping to focus on upcoming priorities.
The Gantt Chart Power BI dashboard enables project managers to track task progress more effectively, spot potential delays early, and optimize project scheduling and resource allocation.
Effective reporting is vital for successful project management, providing critical insights into progress, resource utilization, and financial performance. Power BI enhances this by offering dynamic visualizations and real-time data analysis.
We specialize in not only developing comprehensive reports but also in streamlining and automating data pipelines to ensure seamless and accurate information flow. Our expertise helps businesses gain actionable insights and optimize their project management processes.
If you need a customized reporting solution or assistance with data automation, reach out to us for tailored solutions that meet your business needs.
![]()
![]()
![]()