
Are you building a Looker Studio SEO dashboard with your Google Analytics Data? If you’re someone who manages SEO campaigns for clients or works on SEO for your own business, then you’re probably already aware that:
Our Looker Studio template helps to better understand what the Google Analytics data is telling you about SEO. You can contact us to help you build this template or replicate it yourself from screenshots by following this guide.
Our Looker Studio SEO dashboard enables you to:

First of all, our Looker Studio SEO dashboard is filtered to only show organic traffic from GA4. All the other channels like paid social, referrals, PPC are filtered out.
The most important KPIs are sessions, pageviews as they are the primary user engagement metrics for the site. However, you can also consider adding other metrics like the total number of users or new users.
The breakdown of key metrics by landing page is also important to analyse which pages drive trafic and acquire engaged users.

Secondly, it is important to know what traffic demographic you are attracting to your website: their age, country, gender and device. You basically want to make sure that you are attracting the right type of traffic to your website.

It is also important to be able to compare the organic search with the other traffic sources and mediums to know how your SEO performance compares to other channels.

This Looker Studio SEO dashboard page is using the data from Google Search Console. The brand queries include your brand name in the query string while the non-branded queries don’t.

Finally, it is important to visualise the trends for the key metrics to know if you are getting more engaged sessions or pageviews over time.
Looker Studio, although widely used and preferred, is not your only option when it comes to building SEO dashboards.
You can use similar tools like Power BI, and Tableau and pull data from other sources like SEMRush.
Regardless of your chosen platform, you need to follow these best practices to ensure your dashboard effectively informs decision-making and strategy.
Before we begin, you need to ensure your Google Analytics is properly configured and [MASK] your website.
You also need to sign in to Looker Studio using the same Google Account as your Google Analytics account.

Once you sign in to Looker Studio, create a new project by clicking the tile with a google-themed cross.

You’ll be immediately directed to this page after you create a new project.
This page is where you’ll select your data source which in this case is Google Analytics.
P.S. Looker Studio allows you to connect to several data sources and blend the data in one dashboard, so you can always add new data from other sources like Google Search Console, etc as your SEO needs grow.
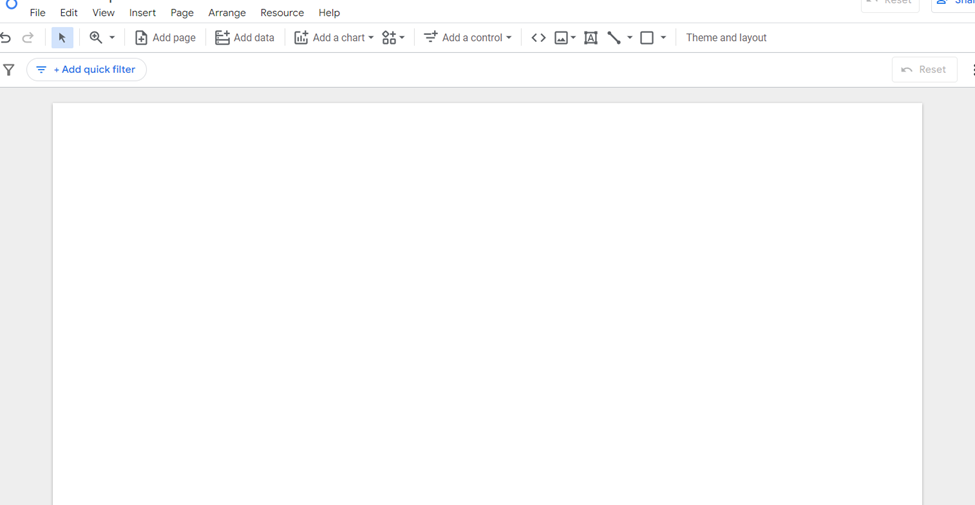
After selecting your data source, you’ll be directed to a blank page which is where you’ll start building your report/ dashboard.
So, the next step is to use Looker Studio’s drag-and-drop interface to add charts, graphs, and cards to your report.
N.B. You need to apply the general guidelines for SEO Dashboard building and you can customize the dashboard colors, themes, and so on to your liking.
Building your Google Analytics SEO Dashboard with Looker Studio is the most convenient and effective approach, but it still has some drawbacks that can limit your SEO analysis:
If you need a custom SEO dashboard in Looker Studio that isn’t bound to these limitations, then look into Vidi’s custom Google Analytics Dashboard solution.
Vidi’s experts will apply all industry best practices and advanced data engineering techniques to deliver you a custom SEO Dashboard that is guaranteed to increase your SEO ROI.
![]()
![]()
![]()