Are you managing a PPC agency? Or do you run Bing or Google Ads to promote your business? Then you will come across the need to manage your campaigns through a centralized location. This is where our Bing & Google Ads dashboard can help. The dashboard is ideal for lead generation and ecommerce agencies. However, any other business that runs Google or Bing Ads can think about using it as well.
With customized reporting, visualizations, and analysis, our dashboard enables you to:
Let’s deep dive and learn more about what this dashboard is all about. Then you can decide to go ahead and implement it in your business.
Let’s first take a look at all the prominent features that you can get out of the Bing & Google Ads dashboard. These reasons also highlight the reasons why you should get your dashboard created.
Our dashboard centralizes reporting data from both Bing Ads and Google Ads accounts. This saves you the headache of logging into multiple platforms to gather data or trying to manually compile reports.
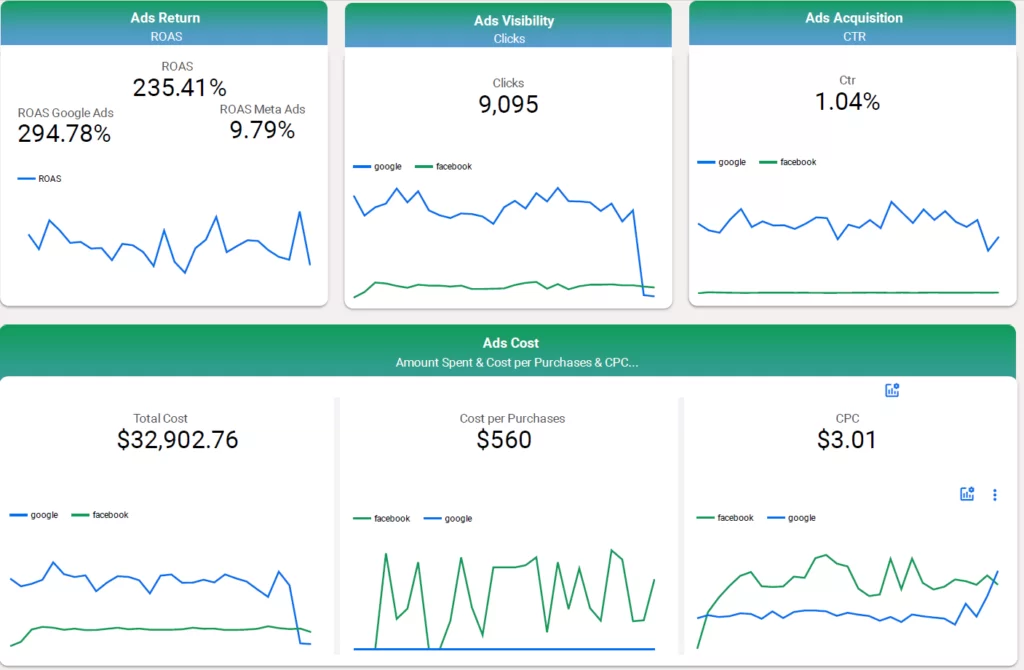
With a few clicks, you can pull consolidated reporting on metrics like impressions, clicks, clickthrough rate (CTR), average cost-per-click (CPC), and conversion tracking. No more toggling between accounts or exporting reporting data to attempt to get a holistic view.
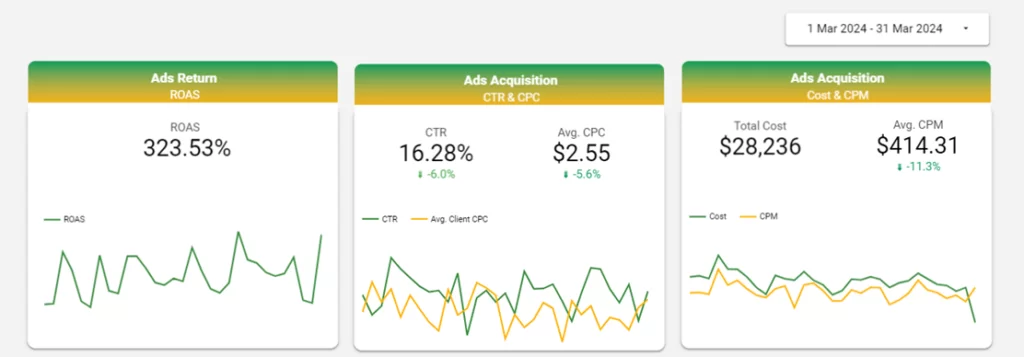
The dashboard allows you to visualize campaign data through interactive charts and graphs. This makes it easy to spot trends and patterns at a glance.
Key visualizations include:
You can filter the visualizations by date range, campaign, ad group, and other attributes to drill into the data. Interactive charts make it simple to identify periods of peak performance as well as dips that need optimization.
While the dashboard comes equipped with several preset reports, you can also create fully customized reporting to serve your business needs.
Build reports with the specific metrics, dimensions, time frames, and filters that you want. Custom reports can be scheduled to run automatically on a recurring basis, so the latest data is always at your fingertips.
Scheduled email delivery means your customized reports can be sent to stakeholders on a cadence of your choosing. This keeps key decision makers informed without having to log in to the dashboard.
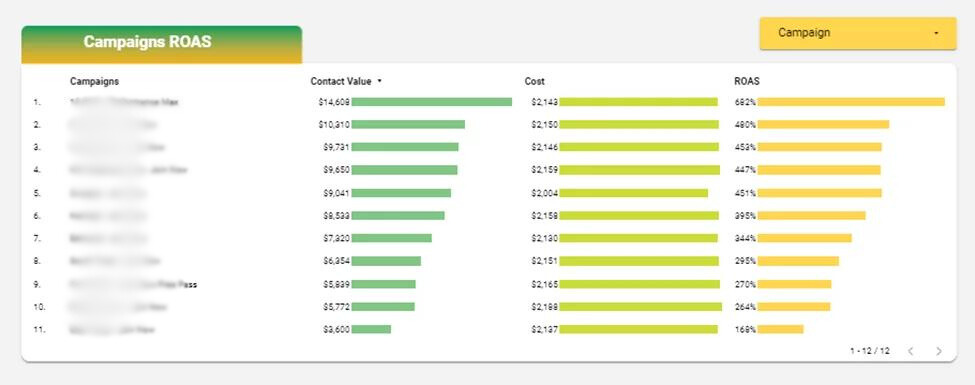
Our dashboard allows you to benchmark performance against internal goals and external averages. See how metrics like CTR, CPC, conversion rate, and ROAS stack up month-over-month or versus industry benchmarks.
This makes it easy to assess campaign health, uncover new opportunities, and showcase successes to demonstrate value. When performance dips below goals or benchmarks, the data can inform where to focus optimization efforts.
The dashboard’s annotation capabilities provide a way to add context behind the data. Annotate campaigns, ad groups, or date ranges to document learnings, highlight tests, or explain performance shifts.
This creates institutional knowledge so others who access reporting can better understand what drove results instead of just seeing the numbers.
Dig deeper into the customer journey with multi-channel attribution modeling. See how search campaigns influence conversions across other channels like paid social, display, and email.
Uncover the true value search ads contribute to pipeline and revenue rather than stopping at last-click analysis. Factor assisted conversions into ROAS calculations for a more accurate picture.
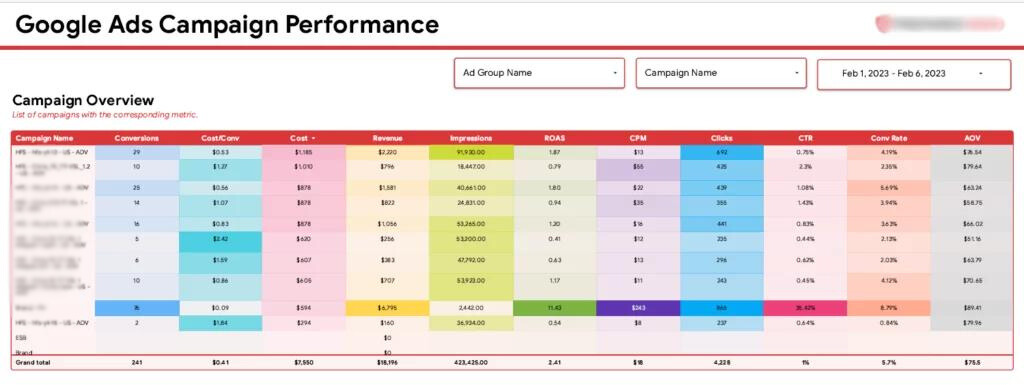
Proving marketing’s impact on the business in terms of pipeline and revenue generated is crucial. That’s why our reporting moves beyond vanity metrics to detail ROAS and contextualize campaigns’ dollars and cents impact.
See search ads’ contribution to new SQLs and opportunities created or customers acquired. Factor in average deal size or customer LTV to quantify lifetime value. Demonstrate spending efficiency alongside business outcomes.
Here is an overview of how we build out the centralized Google and Bing reporting dashboards:
We leverage custom code to automatically extract the freshest data from both platforms on an ongoing basis. Pulling directly from the APIs guarantees up-to-date accuracy rather than relying on manually exported reports.
With the raw data aggregated into our system, we handle joining, cleansing, and transforming it for analysis. This includes mapping campaign hierarchy, aligning date formats, deduplicating etc. to create a unified dataset.
The unified data is then loaded into Looker, Power BI, or Tableau where our team builds fully customized, visually intuitive dashboards tailored to your needs. KPIs can be sliced by date, campaign, client and more.
View performance holistically at the agency level or apply filters to dig into client-specific data based on the user’s access. Share filtered dashboards externally so clients see only their own campaigns.
At the completion of implementation, here is what you will receive:
We will have built custom scripts to automatically pull data from the Google Ads API and Bing Ads API on an ongoing basis. This enables real-time reporting efficiency compared to manual exports.
Your team will have access to interactive, visually rich dashboards built within your choice of Looker, Power BI, or Tableau. These consolidate key metrics, provide filtering, and surface insights through custom visualizations.
We deliver documentation detailing the architecture, scripts, transformations, and back-end processes powering the reporting dashboards. This enables your team to understand what is happening behind-the-scenes.
As your Google and Bing accounts evolve, we handle updating data connections and expanding reporting capabilities accordingly. Our team is also available if any technical issues arise to minimize interruption.
Our robust Bing and Google Ads reporting dashboard delivers the tools, customization, and insights PPC advertisers need to optimize efforts and demonstrate value. To learn more about enabling this business intelligence capability for your organization, please contact us today. We are happy to schedule a demo and discuss how our solution can meet your unique needs.
![]()
![]()
![]()