
Eugene Lebedev is a Power BI consultant by background. Before founding Vidi Corp in 2021 he created Power BI reporting for Autodesk. His Power Bi reports were used by VPs of Finance and C-suite of Autodesk. As part of Vidi Corp, Eugene created dashboards for Google, Teleperformance, Delta Airlines and 200+ clients worldwide.

Nowadays, businesses and companies generate terabytes of data on a single day across the globe through multiple resources. Every business market is unique. They have their hurdles and complications to cater for the rapidly changing needs of their customers. But on the other hand, customers are clear with their vision, choices, and budget while choosing their desired products or services, and if your products or services don’t fit into their baskets, you will lose them. Hence as a business owner, you need to focus on different sales and marketing approaches for different products or services. We know it is hard to analyse the market and act accordingly, but today we will help you by clearing this hurdle with a Business Intelligence tool called “Power Bi“. This blog will give you a brief idea of what is Power Bi and how it can power up your business growth. Let’s check it further.
Power BI is a business intelligence(BI) tool developed by the tech giant Microsoft and often termed Microsoft Power BI in most scenarios. It is a suite of apps,connectors and services that gives power to businesses to analyse complex data into valuable insights. It bridges the underlying gap between data and decisions.
It is one of the widely used business intelligence tools due to its high integration features and availability of a wide range of products. It analyses data from various sources such as Excel workbooks, SQL databases, cloud services, web apps and displays rich user friendly dashboards.
Power BI is one of the dominant players in the field of business intelligence and data visualisation. It is a cloud-based tool designed and developed by the experts of Microsoft and derived from its years of experience from years of relational databases such as Access, SQL etc. It took excel to the whole next level where users can visualise the data instead of rows and columns.
The biggest advantage of this tool is, it is comparatively easy to relate with that of excel sheets, where most of the business owners and data analysts are already familiar with. Power BI stores all your data resources into one location, saving time and effort and by using it even non-technical users are also able to aggregate data from a visual interface.
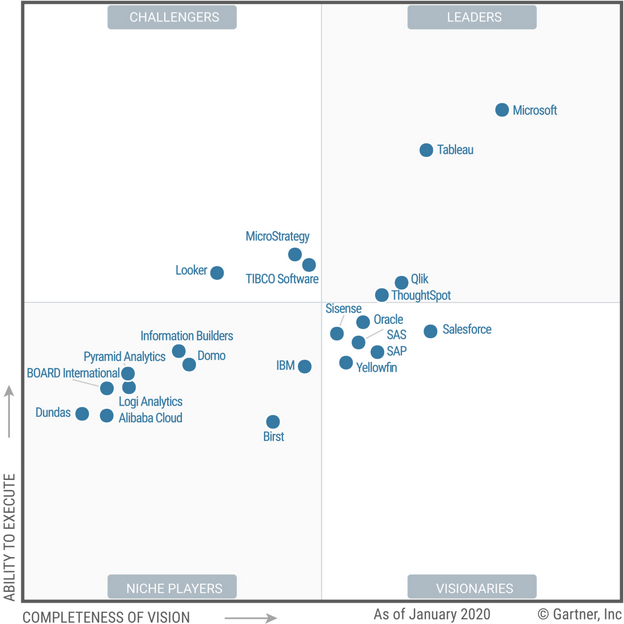
Microsoft Power BI is considered the pioneer in Gartner’s magic quadrant for the Analytics and Business Intelligence Platforms 2020 edition, making it look out of the rest. According to the Gartner Magic Quadrant, it is considered a go-to choice for all kinds of businesses due to its vision and its continuous improvements.
To see how you can optimise your reporting with Power BI, make an enquiry here.
Power BI offers a wide variety of products under its segment to cater for all kinds of data visualisation and business intelligence solutions. In this section, we will walk you through the different areas of it in brief.
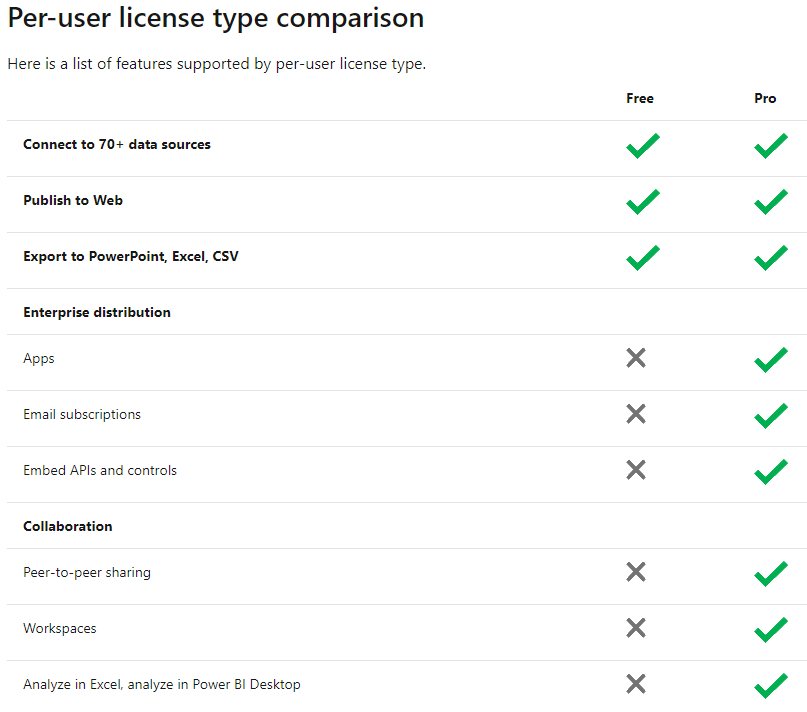
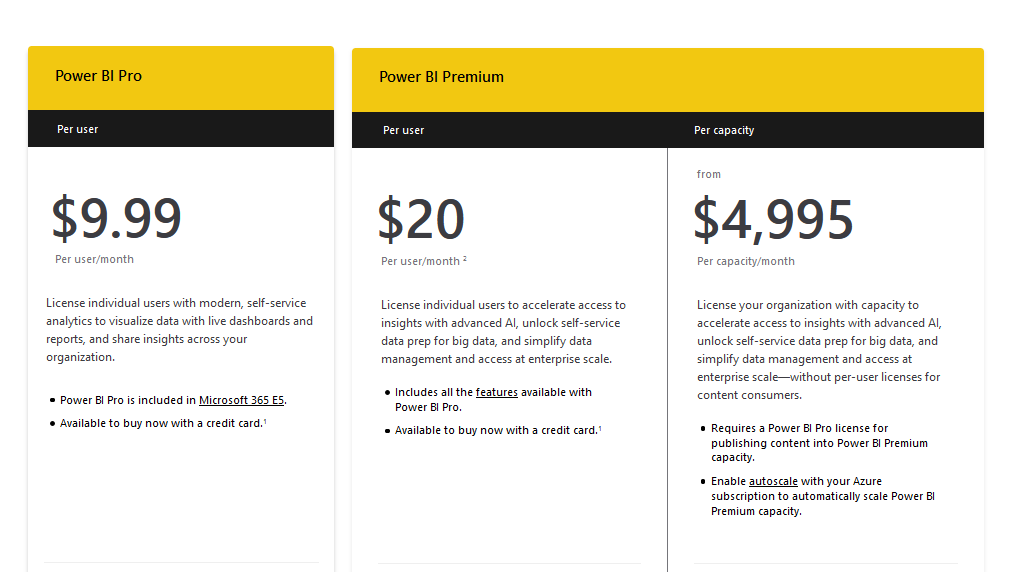
It comes with flexible pricing with few tools as free and some others as paid subscriptions. However, it addresses the needs of all kinds of users, right from single business owners to large scale enterprises. We include a price chart resourced from the original site where you can understand the pricing in brief.
To make you know if this is your go-to tool for your business or not, we are giving you here the top-7 reasons to decide it on your own
1. An easy tool
It is one of the easiest tools to operate for your Business Intelligence. You can easily get insights quickly without any need to underlying any complex infrastructures. It doesn’t require expensive training or any complicated connectors, and it includes powerful and interactive user dashboards for Salesforce, Google Analytics, and Microsoft Dynamics.
2. Streamlined pipelines and centralisation
Your team no longer needs to email large files or store them in shared drives, now analysts can publish dashboards directly to the its services, and sharing is made a lot easy. Also, as the pipeline is streamlined, the data is updated in real-time as soon as the data is updated.
It also offers meaningful insights into your business via BI dashboards. It doesn’t bother even if you have disparate data systems; still, it can pull data from all your systems into a single location, saving a lot of time and effort
3. Better Decision making
Having all your required data in one place on a BI dashboard makes you take quick and better decisions. A data-driven culture is always effective with Power BI. You can also set your goals and track your goals, such as sales targets, ad budgets, employee performance, revenue goals, etc.
As data is updated and analysed in real-time, it opens opportunities for quick and prompt decision making without getting delayed. Data also helps in identifying the new opportunities and in solving the existing problems on time.
4. Accessibility and security
You often need some reports where you don’t want your staff to get access to these top executive-level reports which are truly made only for Ceo’s, Coo’s, CTO’s and for other top executives which might involve confidential data and to make sure that only right people have access to that data, you can enable same Microsoft Information Protection sensitivity labels as in Office, SharePoint, and other tools.
5. Insightful stories with data
Charts are extraordinary for numerical data to be displayed; however in case you need to expose statistics that change over the years in a manner that’s smooth to understand, then Power BI’s new Timeline Storyteller is for you.
With this tool, you may create a linear listing of dates or times, or lay them out in circles, spirals, grids, or custom shapes. You can then use that to inform the records of your business, display how the growth is, or explain something else wherein the series of events matters.
6. Cortana to answer your BI questions
It works with Cortana, Microsoft’s digital assistant. Users can orally ask questions in natural language to access tables and graphs. This is especially useful for mobile users.
For example, you can ask a few questions like “total sales by region by month”. Also, Suppose the question turns out to be extremely useful. In that case, you can pin the visualisation to the dashboard, and it makes this an easy way to create visualisations for a data set. Q&A uses the names of tables, columns, and calculated fields in the data sets, and if the column is called “area” rather than “region,” then you need to ask for “sales by area”, or you add synonyms to the tool for better recognition.
7. A powerful combination of AI and ML with BI
It also gives its users the choice to automate the data flow using machine learning and Artificial intelligence. Users can access image recognition and text analytics, create machine learning models, and integrate with Azure Machine Learning.
Define what you want to predict, such as whether a product will be out of stock, and AutoML suggests what columns of data to use for the model, selects, and automatically tunes the algorithm.
Well, by now, we anticipate that you have made your mind in choosing the Power BI as your go-to tool, considering the features, pricing and the strong support of Microsoft behind it. It is not any wonder that you stick to this as your choice, but it matters about the partner who powers up your business intelligence game. Along with the right tools, you also need the right partner like Vidi-corp, who delivers you the right services at the right time.
Vidi-corp is a UK based Business intelligence and Analytic agency built on a mission to help businesses make the right decisions at the right time. Our motto is to scale the growth of the business using powerful insights and dashboards. We are a team of passionate data geeks who love to present complex data into interactive storyboards for business owners.
We offer different BI consulting services like web analytics, financial analytics, Business analytics for all kinds of businesses where data plays a major role. Our team specialises in reporting power Bi financial reportings and power BI financial dashboards. We believe in the mantra of “your growth makes us grow”, and our team is committed to making it happen.
Join us in making your business power up with power BI, and let us make your business simplified with data analytics. It’s the right time to act now rather than regret later. So, we urge you to contact us today to start getting data-driven insights from Microsoft’s Power BI right from tomorrow.
If you feel our blog helped you understand what Power BI is, please leave a comment below, and to get more blogs into your inbox regularly, please consider subscribing and sharing with your colleagues and partners.
![]()
![]()
![]()