To visualize QuickBooks Online data in Power BI effectively, you must automatically connect to it and retrieve the data in an easy-to-work-with format.
The tricky part lies in finding the “convenient data format” because the native Power BI connector to QuickBooks Online contains over 100 tables. Searching for the columns you need within it is akin to searching for a needle in a haystack.
Instead of using the native QBO Power BI connector, there is a better way to extract Quickbooks Online data to Power BI which we will explore in this article. There are multiple benefits of using this method of extracting data:
You can see the data format you would get in Power BI through this link.
CONTACT US TO GET THIS SOLUTION
Not everyone needs to extract data from Quickbooks Online into Power BI. However, it is important for:
If you fall into one of those categories, the approach below would be the most convenient way of extracting Quickbooks Online data to Power BI for you.
Instead of using the native connector to QBO connector in Power BI, we will be demonstrating the Quickbooks connector by Vidi Corp. This connector extracts the Quickbooks Online data to Azure SQL database which can later be connected to Power BI or any other reporting tool of your choice.
There are multiple advantages of extracting Quickbooks Online data to Azure SQL Server before loading it to Power BI:
If you want to set this connector set up for yourself, follow this simple 4 steps below or follow our video guide:
1. You register an account on the Vidi Corp Power BI Connectors platform.
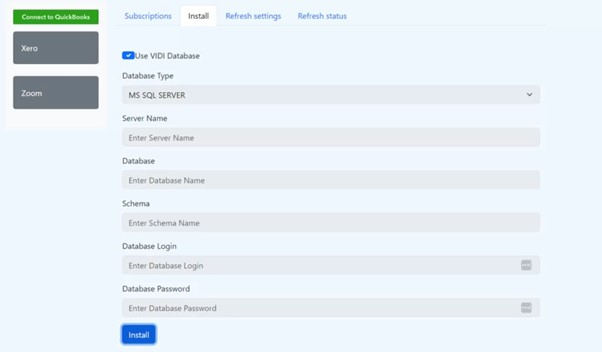
2. Navigate to the “Install” tab after you log in. This is a menu for creating the tables that you need inside of your database of choice. You can add your Azure SQL Server details in here or simply choose to use “Vidi Database”. One you click “Install”, the script would create the tables inside of your database. Your Quickbooks data would flow to these tables once you connect your account to the system.
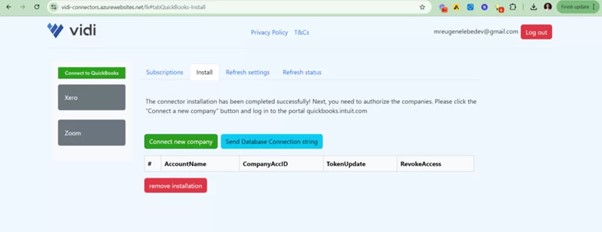
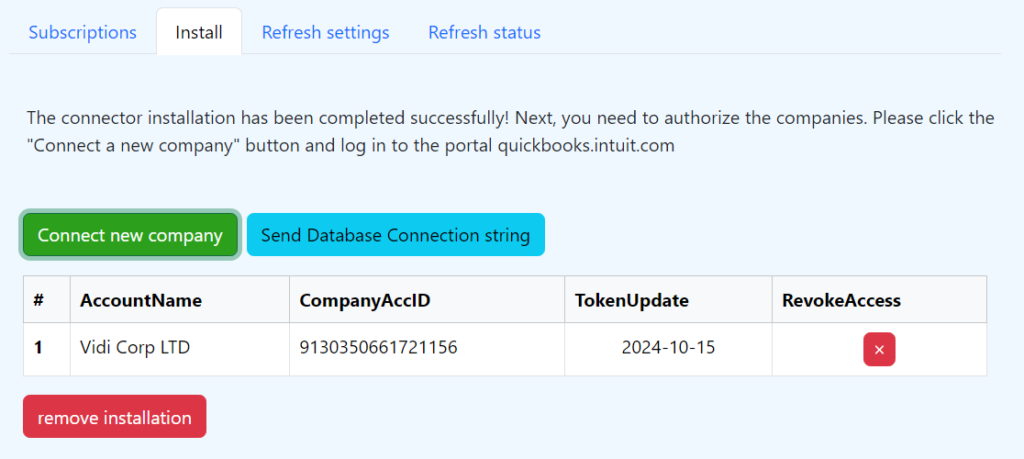
3. Once the tables are created, you would be automatically redirected to the next menu where you can connect your Quickbooks data to the system. Simply click on the green button to “connect new company” to start the process.
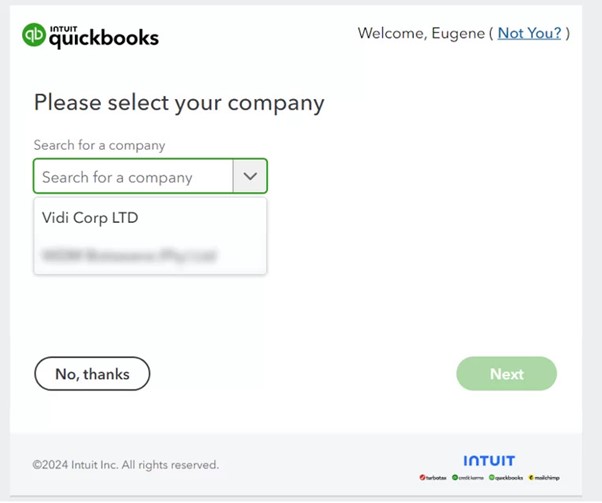
You would then need to select a Quickbooks company to connect to Power BI and click next.
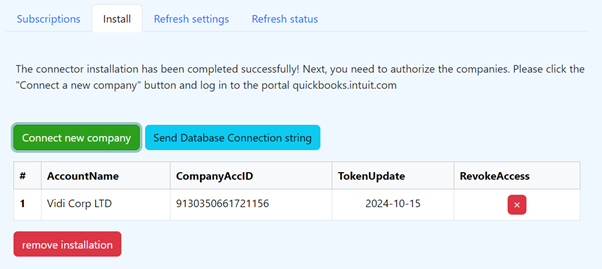
After this you will be automatically redirected to the same table as before. You will see your company name in the table.
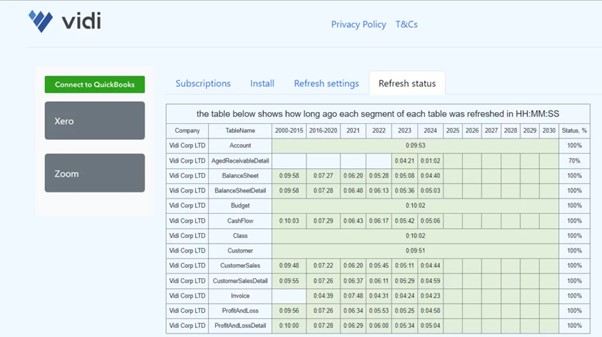
You can use the “Refresh Status” tab to monitor the load of your data. Once the load reaches 100%, your data will be fully ready to use.
Once all the historical Quickbooks Online data is extracted to Azure SQL, the software will take care of automatic table refresh going forward. This table refresh can be scheduled based on the customer needs. The standard is every 30 minutes but Vidi Corp is actively working on the “Refresh Settings” tab where a client would be able to refresh the database on a custom schedule.
If you go back to the install tab, you will be able to click the blue button to “Send database string” to your registered email.
You will then receive an email like the one below. You can use the details from this email to connect Power BI to your Azure SQL Server database.

CONTACT US TO GET THIS SOLUTION
Now that everything is set up, we can explore the data format inside of Power BI. You can do this by installing the free Power BI Quickbooks Online template or creating your own from scratch.
Let’s start with the P&L Detail table. Every row in this table is a transaction. We get the transaction date and value in the first 2 columns and transaction description as the forth column.

If we scroll to the right, we can see that all the transactions are grouped to accounts the same way as in the P&L statement of Quickbooks Online. We can also filter this table by accounting method: cash or accrual. This means that in our Power BI report either one of those should be selected in a filter for the numbers to make sense. Class data is also available in this table as well as Quickbooks account name.

As you see, with this connector it only takes one table to analyse your P&L metrics. We can now use this table to create analysis like below.

You can view more Power BI templates that can be produced with the data from this connector here.
Let’s now take a look at the Balance Sheet table. Again, the data format in this table mirrors the Quickbooks Online Balance Sheet report. The first columns give us amount value, date of the transaction and the description of this transaction.

Just like before, all the transactions are grouped into account groups with 3 levels mirroring the Quickbooks Online report data format. You can also filter this table by accounting method: (cash or accrual) and Quickbooks account name.

Again, we only need one table to create a Balance Sheet Power Bi report using the Quickbooks Online data.

You can read more about this template or view other Power BI templates with Quickbooks Online data here.
The Quickbooks Online Power BI connector discussed in this article allows companies to extract data in a very convenient format. Having all your data grouped in tables like P&L, Balance Sheet, etc saves dozens of developer hours since no data blending work is needed to produce the reports. Ability to combine several Quickbooks Online accounts into a single Power BI dashboard is also extremely useful for companies with segregated data.
The connector software is continuously maintained and new features are added over time. All the clients get maintenance with the connector and get access to the new features once they are released.