How to Build a SEO Dashboard with Google Analytics Data

14 August 2024

Build a SEO Dashboard with Google Analytics Data

Have you been wondering how to build a SEO dashboard with your Google Analytics Data? If you’re someone who manages SEO campaigns for clients or your business using Google Analytics, then you’re probably already aware that:

  • The SEO data available to you can be voluminous
  • It takes time to see SEO results
  • A single metric can’t tell you everything you need to know about the progress of your website’s SEO.

To fully understand what the SEO data from Google Analytics is trying to tell you, you need a way to:

  • focus on only the data that matter most to your SEO goals
  • monitor trend/ time-series graphs of your core SEO metrics since time is of the essence when it comes to SEO.
  • monitor several metrics i.e. organic traffic, SERP rankings, keywords, and more

So, it only makes sense to have a dedicated SEO dashboard that lets you do all of this in one simplified place.

In this blog, we’ll talk about how to build your Google Analytics SEO dashboard using Looker Studio.

Table of Contents:

  • Key Metrics in a Google Analytics SEO Dashboard
  • Guidelines for Building a SEO Dashboard
  • Step-by-Step: How to Build a SEO Dashboard in Looker Studio
  • Limitations of Looker Studio
  • Vidi’s Custom Google Analytics SEO Dashboard Solution

Key Metrics in a Google Analytics SEO Dashboard

An SEO strategy is not a straight line. A lot of things come into play, and data from Google Analytics is always one of them.

The reason is pretty obvious – Google Analytics is made by the same company as the search engine people use to find your website, so it provides metrics that you may not find elsewhere.

So what metrics are we talking about here?

  • Organic Traffic: How many people are visiting your site from search engines?
  • Bounce Rate: What percentage of people are leaving your site after just one page?
  • Average Session: How long are people spending on your site per visit?
  • Pages per Session: How many pages are people viewing when they visit your site?
  • Referral Traffic: How many people are visiting from other sites that link to yours?
  • Top Landing Pages: What pages are people entering your site through?
  • Top Exit Pages: What pages are people leaving your site through?
  • Time on Page: How long are people spending on a specific page of your site?
  • Click-Through Rate (CTR): What percentage of people seeing your site in search results click on it?
  • Custom Metric: What other metrics do you have to track for your business’s SEO goals?

Guidelines for Building an SEO Dashboard

Looker Studio, although widely used and preferred, is not your only option when it comes to building SEO dashboards.

You can use similar tools like Power BI, and Tableau, or other platforms like GA4 and SEMRush.

Regardless of your chosen platform, you need to follow these best practices to ensure your dashboard effectively informs decision-making and strategy.

  • Have clear business goals: You must start by clearly defining what success looks like for whatever SEO efforts you’re making. What results do you want to see after investing in SEO? i.e. Increase in sales, More Newsletter signups, etc.
  • Identify all the right metrics and KPIs: Next, you need to identify the metrics and KPIs that are directly impacting your business goals and SEO strategy. They’d form the basis of the dashboard which will help you track your SEO progress and give you an idea of what’s yielding results and what needs improvement.
  • Set Up Events to Track Site Activity: You should use Google Analytics events to track specific user actions on your website (e.g., button clicks, form submissions).
  • Have a baseline for each metric/ KPI: It's difficult to measure progress when you don't know where you started. So, to understand your progress and identify areas for improvement, you need to compare your website's performance against some benchmark like the industry status quo or past data.
  • Use the Right Visualization and Colors: Trying to use a poorly designed dashboard is like trying to have a conversation in a foreign language — it's confusing, and you miss all the points. You need to present your data in a clear and easy-to-understand manner. The charts, cards, and graphs you use depend largely on the type of data you’re dealing with so use them accordingly. For instance, you can use bar charts to compare website traffic across different channels, line graphs to show trends over time, and pie charts for breakdowns of categories (like traffic sources). Also, use colors that follow human intuition: red for warnings or declines, green for positive trends or growth.

Step-by-Step: How to Build a SEO Dashboard in Looker Studio

Before we begin, you need to ensure your Google Analytics is properly configured and [MASK] your website.

You also need to sign in to Looker Studio using the same Google Account as your Google Analytics account.

Step 1: Add a New Project

Build a SEO Dashboard with Google Analytics Data

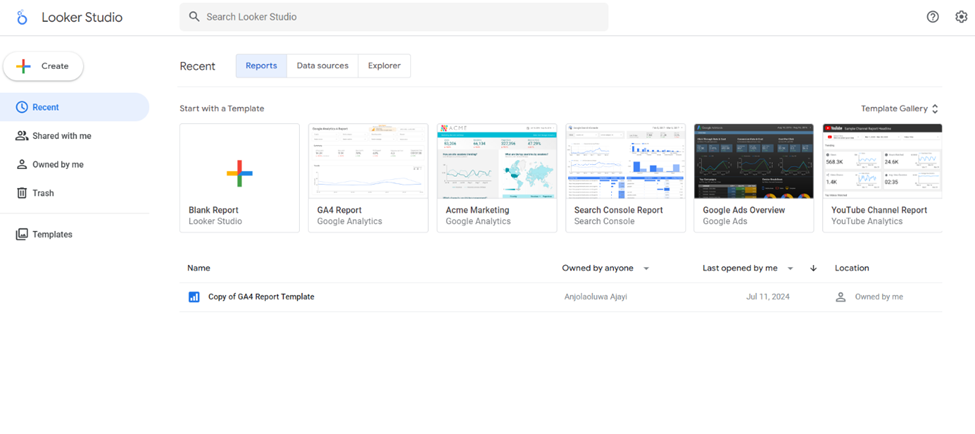
Once you sign in to Looker Studio, create a new project by clicking the tile with a google-themed cross.

STEP 2: Connect to Google Analytics

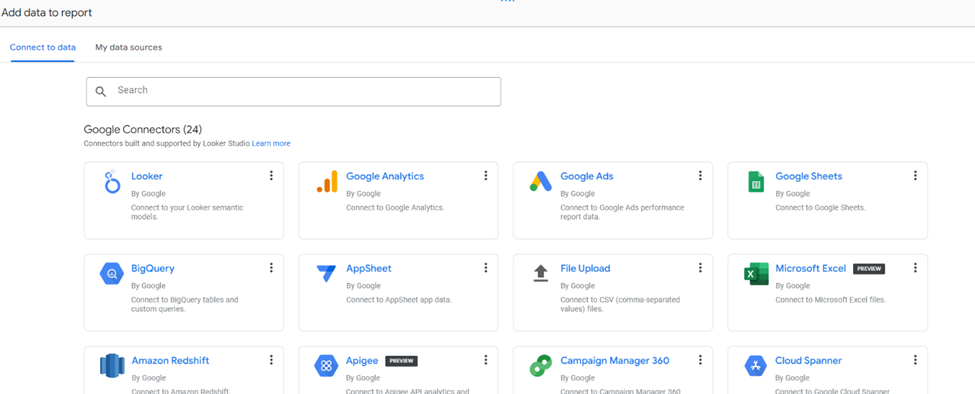
You’ll be immediately directed to this page after you create a new project.

This page is where you’ll select your data source which in this case is Google Analytics.

P.S. Looker Studio allows you to connect to several data sources and blend the data in one dashboard, so you can always add new data from other sources like Google Search Console, etc as your SEO needs grow.

STEP 3: Add visualizations

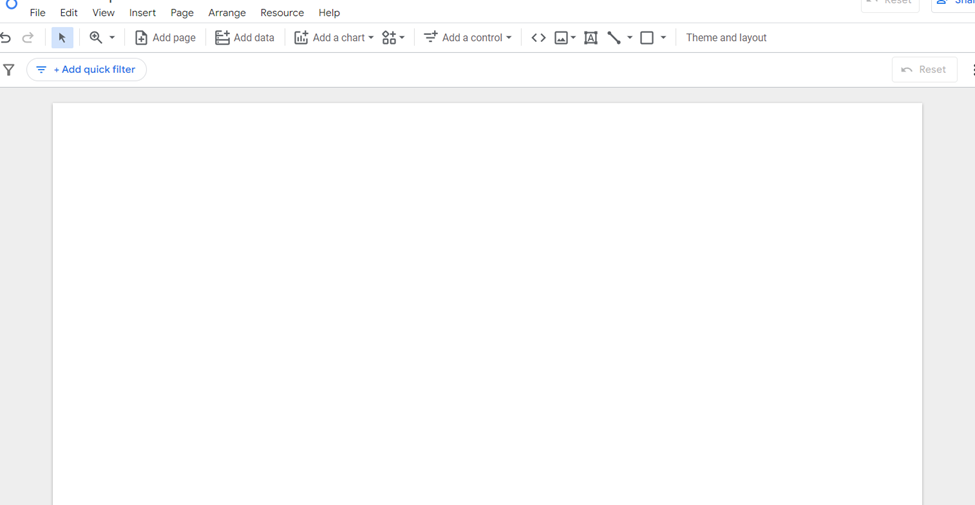
After selecting your data source, you’ll be directed to a blank page which is where you’ll start building your report/ dashboard.

So, the next step is to use Looker Studio’s drag-and-drop interface to add charts, graphs, and cards to your report.

N.B. You need to apply the general guidelines for SEO Dashboard building and you can customize the dashboard colors, themes, and so on to your liking.

Limitations of Looker Studio

Building your Google Analytics SEO Dashboard with Looker Studio is the most convenient and effective approach, but it still has some drawbacks that can limit your SEO analysis:

  • You can’t directly use custom metrics that require advanced data transformation.
  • If you bring together data from multiple data sources, you may experience some data inconsistency issues.
  • You can’t easily display YoY and MoM trends in Looker Studio.

If you need a custom SEO dashboard in Looker Studio that isn’t bound to these limitations, then look into Vidi’s custom Google Analytics Dashboard solution.

Vidi’s experts will apply all industry best practices and advanced data engineering techniques to deliver you a custom SEO Dashboard that is guaranteed to increase your SEO ROI.

Vidi’s Custom Google Analytics SEO Dashboard Solution

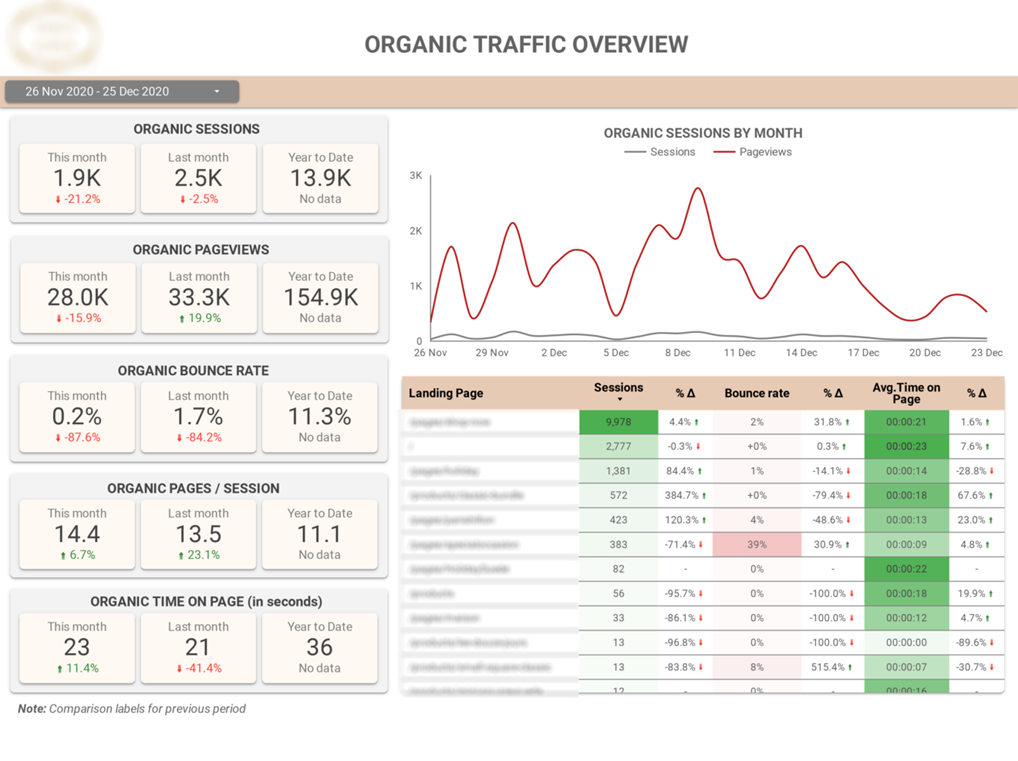
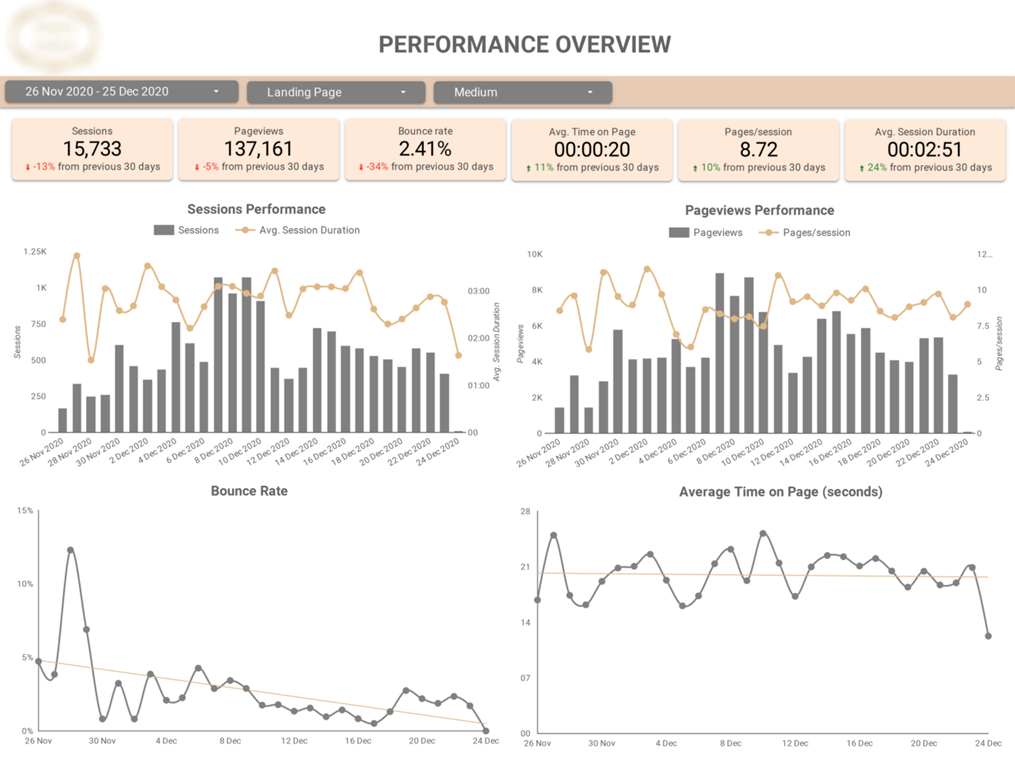
This dashboard helps monitor metrics like organic traffic, page views, bounce rate, average time on a page over time, and for each landing page.

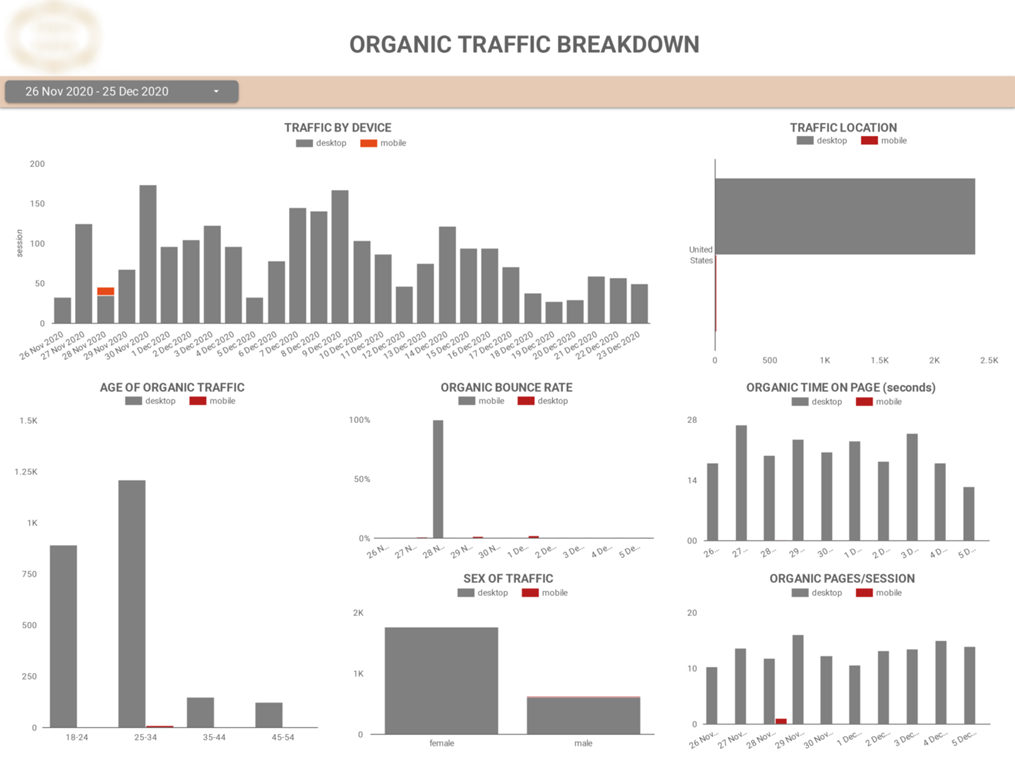
This dashboard lets you monitor metrics like organic traffic, bounce rate, average time on page, and pages per session based on the devices your visitors are using to access your website.

Build a SEO Dashboard with Google Analytics Data

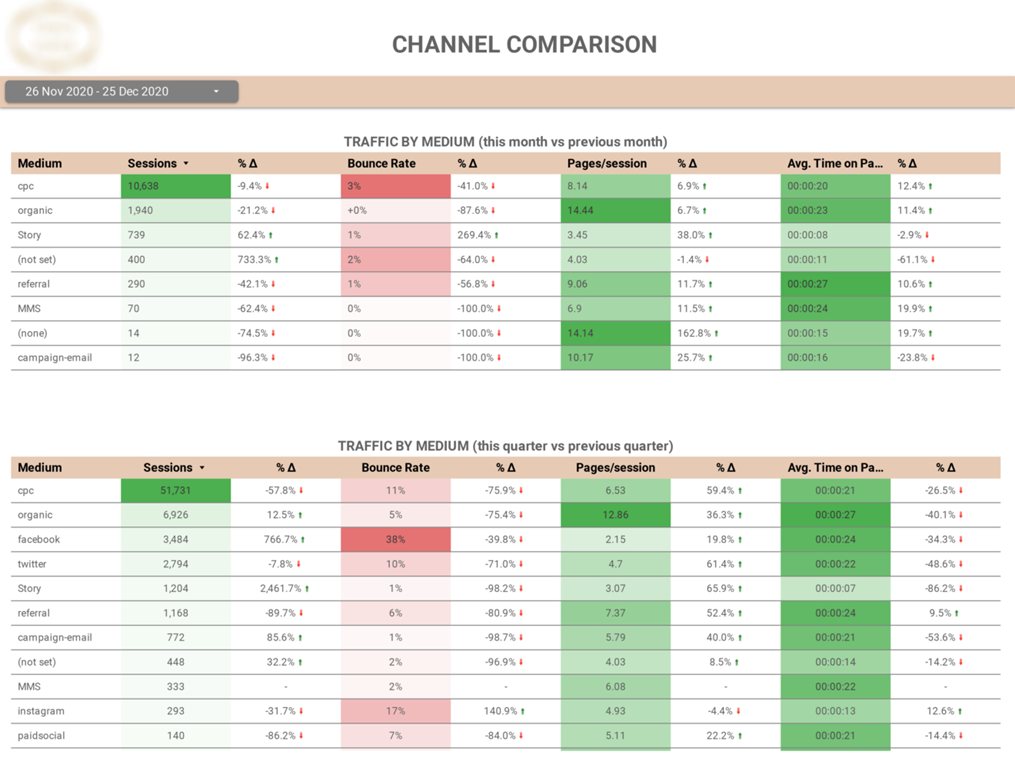
This page lets you compare the monthly and quarterly performance of all your external sources of traffic.

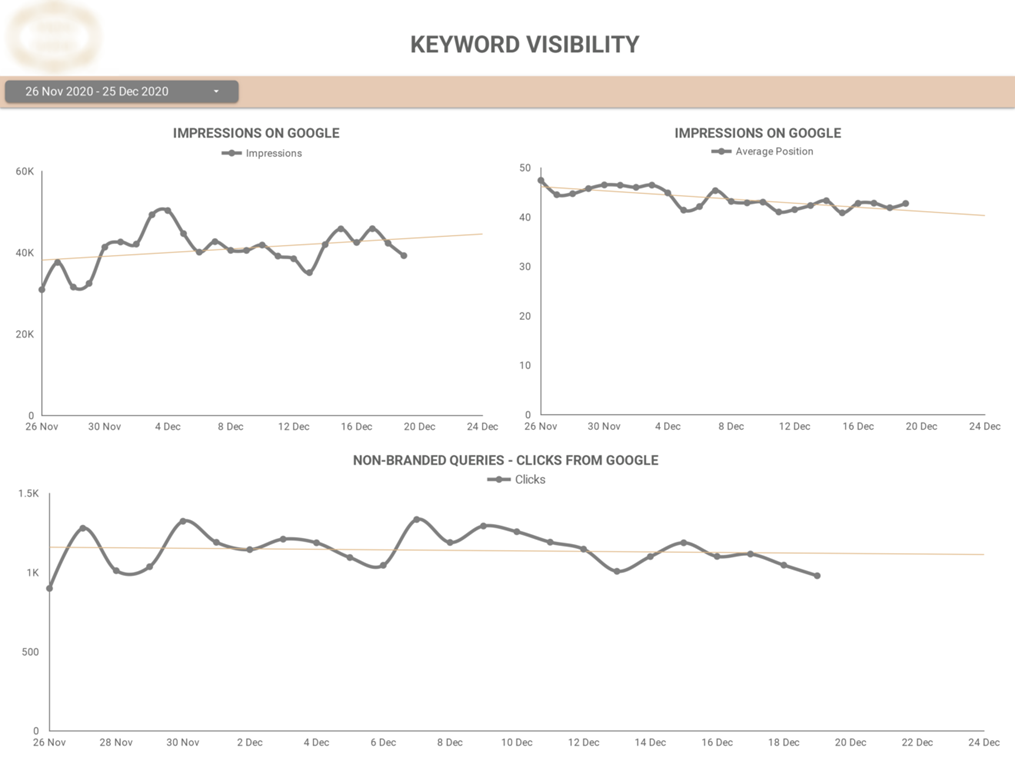
This dashboard lets you see the trend of your website’s impressions, SERP ranking, and clicks over time.

This dashboard gives a detailed yet high-level view of your website’s overall SEO performance.

Microsoft Power Platform

Everything you Need to Know

Of the endless possible ways to try and maximise the value of your data, only one is the very best. We’ll show you exactly what it looks like.

To discuss your project and the many ways we can help bring your data to life please contact:

Call

+44 7846 623693

eugene.lebedev@vidi-corp.com

Or complete the form below