With interactive e-commerce dashboards, Power BI can transform e-shop data into insightful visualizations. It integrates with various data sources, enabling comprehensive data consolidation. Users can also track sales, monitor inventory, and analyze customer behavior in real-time.
Power BI’s advanced analytics features, such as DAX (Data Analysis Expressions) and machine learning, offer deep insights into sales trends, customer preferences, and operational efficiency.
Additionally, its intuitive interface allows for easy customization and sharing of reports, facilitating data-driven decision-making and enhancing overall business performance.
Case Study: Shopify Insights
We have analyzed the sales data for a well-known brand and provided various insights. Let’s walk through it together to explore the KPIs and uncover insights from the data.
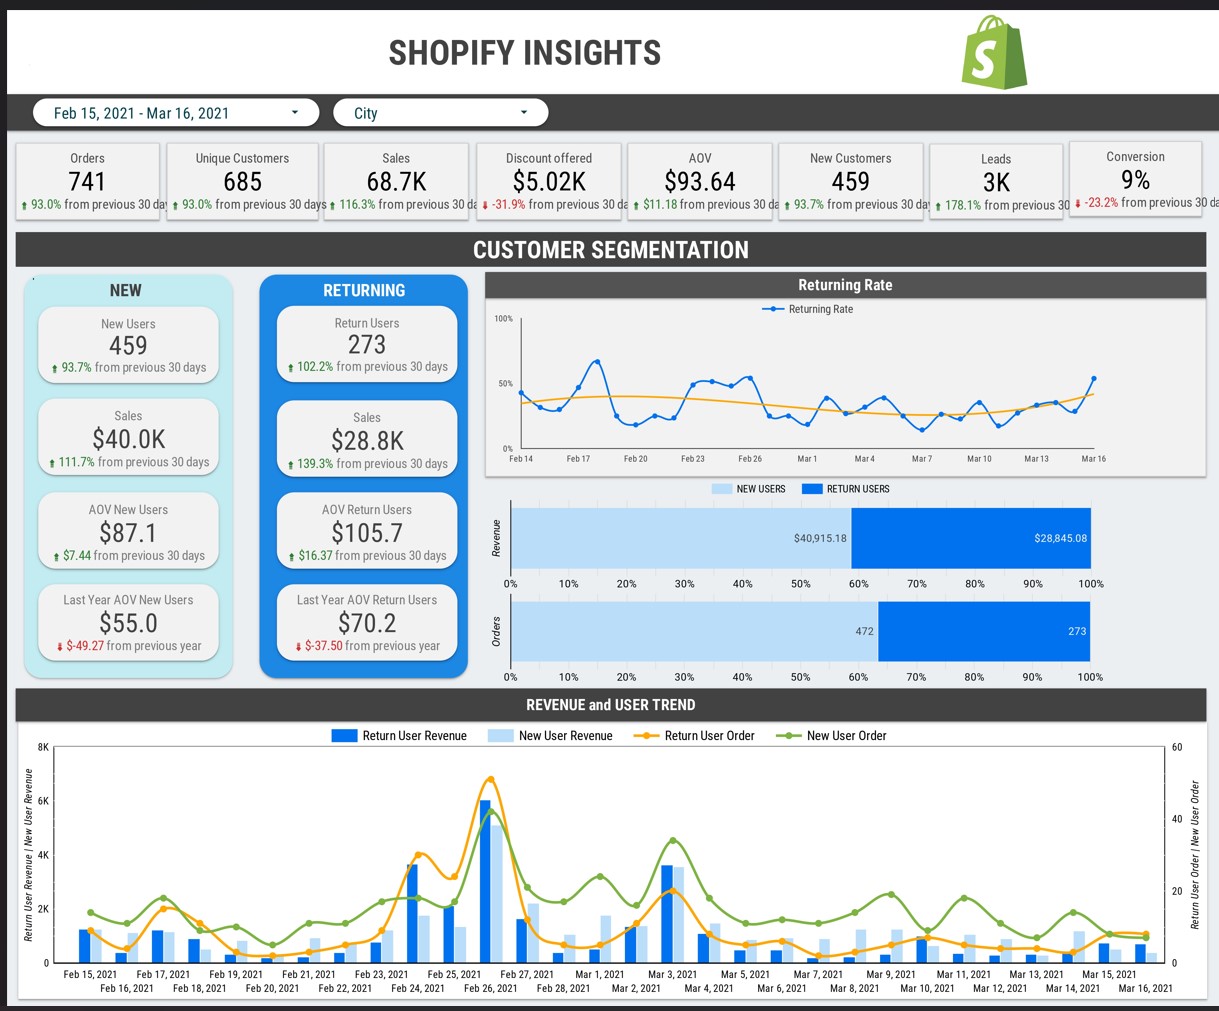
This view highlights various KPIs, including Orders, Unique Customers, Sales, Discounts Offered, Average Order Value (AOV), New Customers, Leads, and Conversions.
Order: Number of orders within the selected time frame and the percentage change compared to the data from the previous 30 days.
Unique Customers: Unique customers within the selected time frame and the percentage change compared to the data from the previous 30 days.
Sales: Total sales at company level within the selected time frame and the percentage change compared to the data from the previous 30 days.
Discounts Offered: Total Discount offered by company within the selected time frame and the percentage change compared to the data from the previous 30 days.
Average Order Value (AOV): Average order value within the selected time frame and the percentage change compared to the data from the previous 30 days.
New Customers: New customers added within the selected time frame and the percentage change compared to the data from the previous 30 days.
Leads : Number of leads within the selected time frame and the percentage change compared to the data from the previous 30 days.
Conversions: Number of Conversions within the selected time frame and the percentage change compared to the data from the previous 30 days.
We have a customer segment that outlines various KPIs related to customers, including New and Returning users.
New: New users are those who made their first purchase.
Return:Returning users are those who made a subsequent purchase.
Additionally, we have KPIs that classify these users based on revenue and the number of orders.
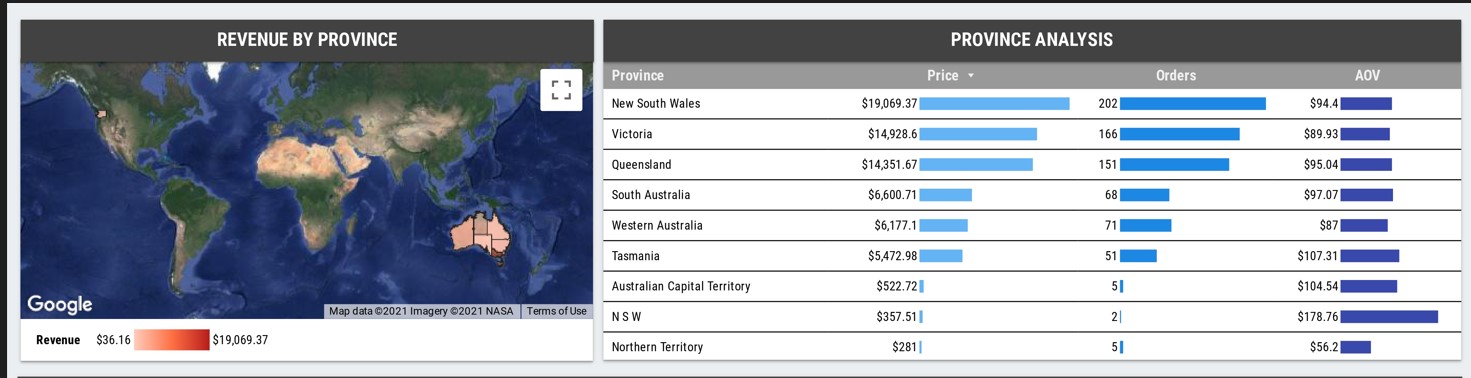
This view presents various KPIs such as revenue, orders, and Average Order Value (AOV) by geographical location. In this case study It displays data by province according to business requirements, allowing the business to identify which provinces generate more sales than others.
A map visualization helps in identifying sales in each province and table visuals helps in detailing the performance of each province in terms of Price, Orders, and Average Order Value (AOV).
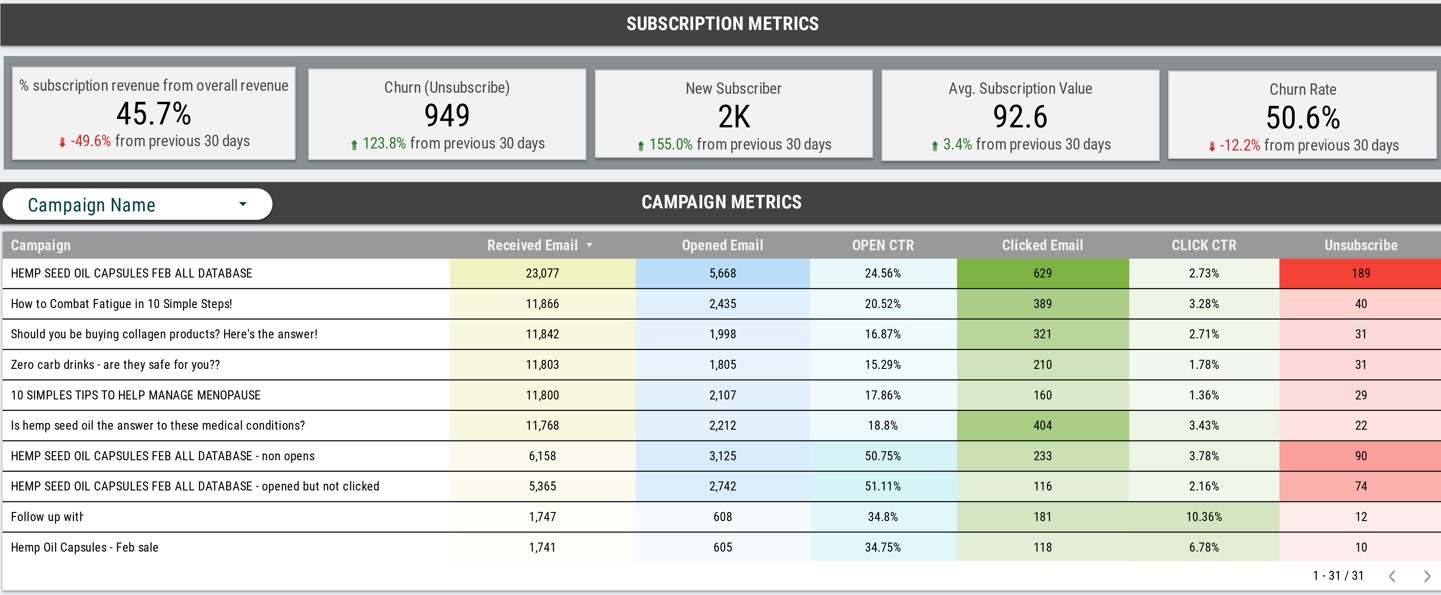
This view represents the subscription metrics. Subscription numbers provide a steady revenue stream, enhance customer retention, predict future income, and offer insights into customer preferences, aiding in better inventory management and personalized marketing strategies.
New Subscriber:Number of new subscribers added within the selected time frame and the percentage change compared to the data from the previous 30 days..
Avg Subscription Value : Average subscription value within the selected time frame and the percentage change compared to the data from the previous 30 days.
Churn: Number of subscribers who canceled their subscription within the selected time frame and the percentage change compared to the data from the previous 30 days.
Churn Rate: Rate of churn within the selected time frame and the percentage change compared to the data from the previous 30 days.
% of subscribers from overall revenue: Percent of subscribers revenue from the overall revenue of the company within the selected time frame and the percentage change compared to the data from the previous 30 days.
We also have a table detailing campaign metrics. Campaigning in e-commerce focuses on targeted marketing to boost traffic, sales, and engagement. Business users can view KPIs for all campaigns or select a specific campaign from the dropdown menu. The table provides insights into metrics such as the number of emails received, opened, open CTR (Click-Through Rate), clicked emails, clicked CTR, and unsubscribes.
Click-Through Rate (CTR):It measures the percentage of users who click on a campaign link.
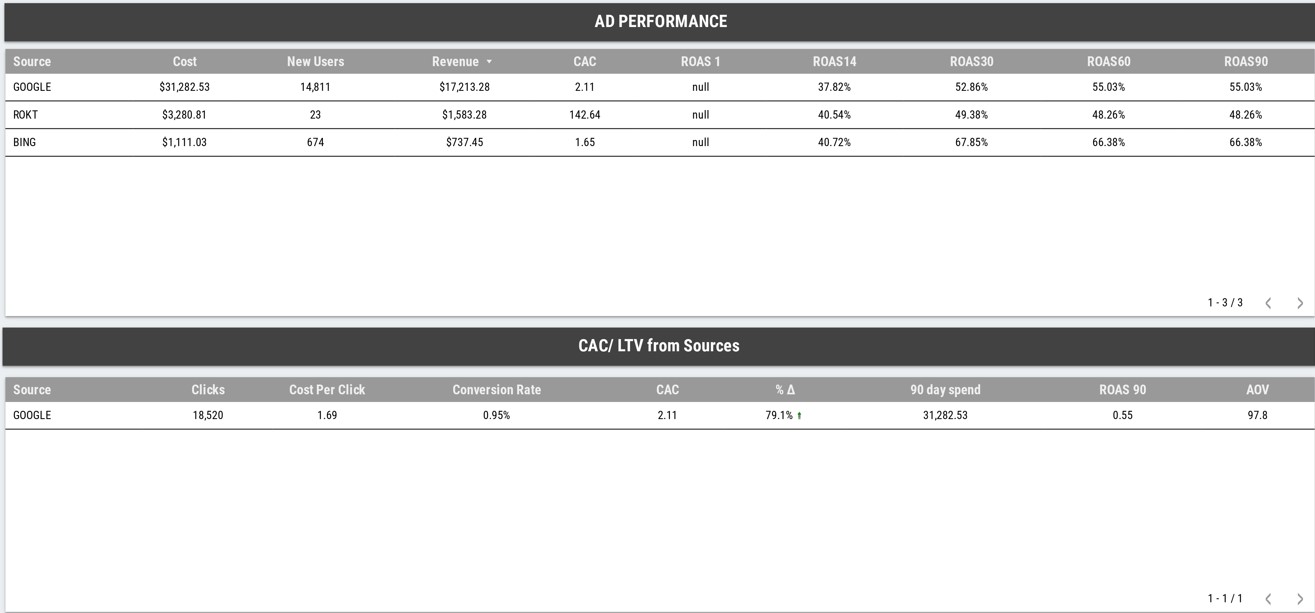
This view provides insights into ad performance and CAC/LTV from various sources.CAC (Customer Acquisition Cost) is the cost of acquiring a new customer through marketing and sales efforts where LTV (Customer Lifetime Value is the total revenue a business expects to earn from a customer over their entire relationship.
Ad Performance:Ad performance summarizes revenue and leads generated from different advertising investments.
CAC/LTV from sources: CAC/LTV analysis helps identify metrics such as clicks, cost per click, conversion rate, and other KPIs across different data sources
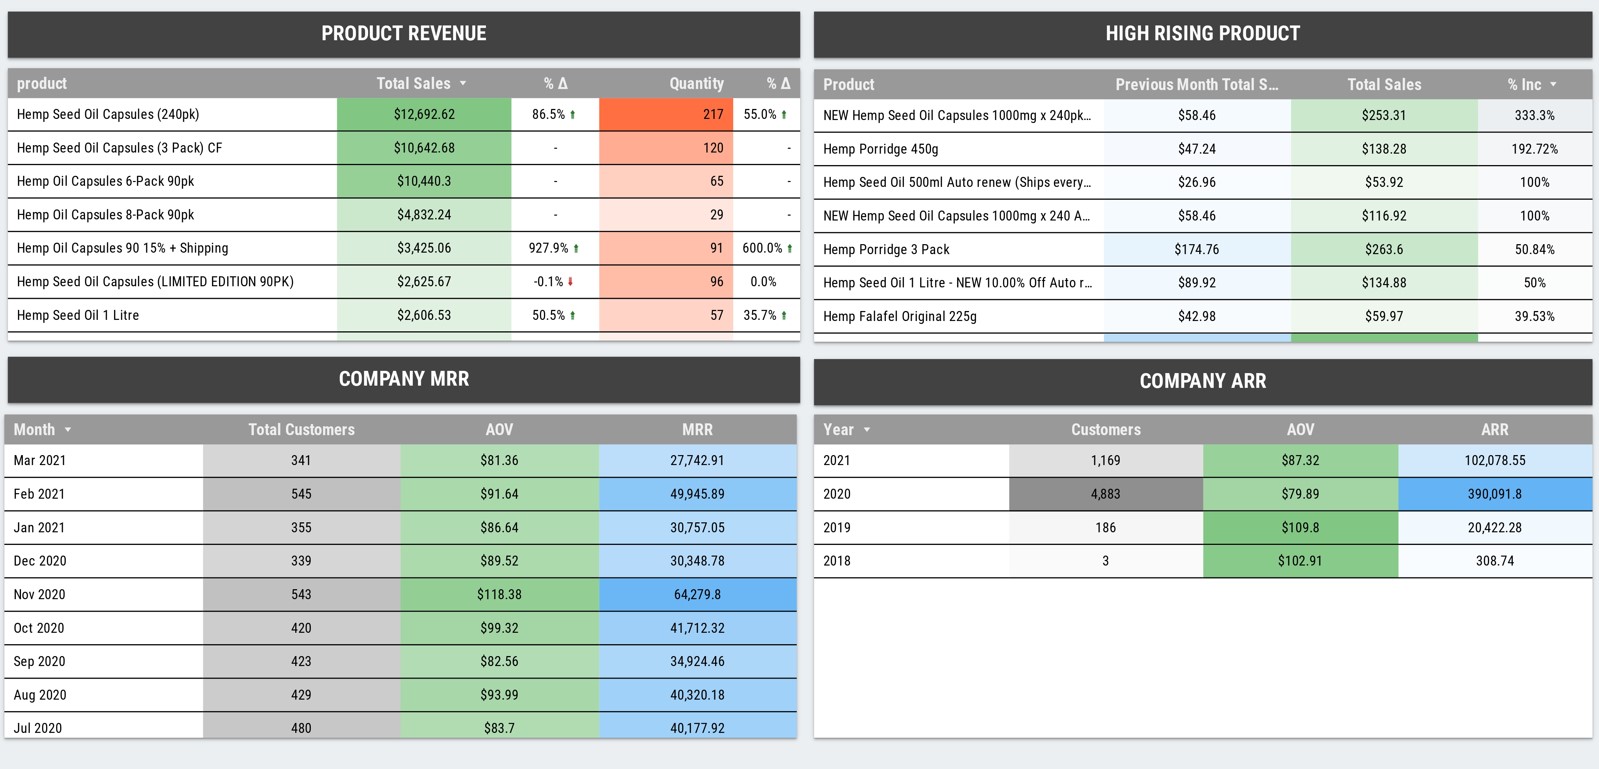
This view displays four key KPIs in table format. Before getting into the details of KPIs let’s understand the definition of MRR and ARR.
Product Revenue: Shows total sales and quantity sold for each product, including changes from the previous time frame.
High-Rising Product: Identifies products with a significant sales increase compared to the previous month, potentially marking them as premium items.
Company MRR: Details the company’s Monthly Recurring Revenue (MRR) over the last 9 months, along with total customers and Average Order Value (AOV).
Company ARR: Provides the company’s Annual Recurring Revenue (ARR) for each year, along with total customers and AOV.
MRR represents regular monthly income and it helps track short-term revenue trends.
ARR reflects steady annual income and it offers an annualized view of recurring revenue for future financial forecasting.
Conclusion
Overall we can conclude that, Analyzing sales data with Power BI enhances decision-making by providing clear insights through interactive dashboards and reports.
It helps identify trends, track performance, and optimize strategies, leading to improved sales, better customer understanding, and more informed business decisions, ultimately driving growth and efficiency.