
Telecom data analytics is the process of analysing data generated by telecom operators to understand performance across revenue, customers, and network operations. It uses information from billing systems, CRM platforms, OSS/BSS environments, ERP systems, and network infrastructure to examine what is happening in the business and why. This analysis forms the foundation for practical telecom analytics use cases, such as churn management, revenue optimisation, fraud detection, and network performance improvement.
As a telecom data analytics company, we delivered 1,000+ custom BI analytics solutions for telecom operators and service providers. This includes consolidating data from CRM, ERP, billing, and network systems, designing efficient data models, and building custom dashboards. The focus is always on clarity, consistency, performance, and ensuring the numbers can be trusted.
In this article, we explain what telecom big data analytics is, why it matters, and how it works in practice. We also cover the main types of telecom analytics, explore real-world telecom analytics use cases, outline key business benefits, discuss implementation challenges, and examine future trends shaping the telecom industry.
Telecom big data analytics is the structured use of extremely large, fast-moving, and diverse datasets to improve network performance, customer management, and business decision-making in the telecommunications industry. Unlike traditional reporting, it focuses on processing complex data at scale, often in real time.
Telecom operators generate massive amounts of data every second from call detail records (CDRs), billing systems, CRM platforms, network equipment, mobile apps, IoT devices, and customer interactions. This data cannot be effectively managed using standard databases alone. It requires distributed computing systems, cloud platforms, and advanced processing frameworks.
Telecom big data analytics is defined by three core characteristics:
Telecommunication data analytics is no longer optional. Telecom providers operate in a high-volume, low-margin environment where small inefficiencies quickly translate into significant financial impact. With complex pricing models, recurring revenue structures, network infrastructure costs, and competitive pressure, leadership needs precise and timely insights to make confident decisions.
Data analytics is important because it connects financial performance, customer behaviour, and operational metrics into one structured view. Instead of reviewing disconnected reports, executives gain real-time visibility into revenue drivers, cost structures, churn risks, and performance trends. This enables faster corrective action, better resource allocation, and more predictable growth.
A strong example of this impact is our work with the CFO of Neterra Telecom. The Power BI dashboards we built delivered measurable business outcomes and contributed to his Ernst & Young “Transformation of the Financial Function” CFO award in 2024.
The insights identified a €50k one-off cost-saving opportunity and unlocked €10k–€20k in additional monthly recurring revenue. The solution also fully automated reporting, removing the need for a full-time business analyst and significantly improving financial transparency.
This example illustrates why telecommunication data analytics matters. When implemented correctly, it does not just improve reporting. It drives cost savings, revenue growth, operational efficiency, and executive-level transformation.
Below are practical telecom analytics use cases that demonstrate how data can be applied across commercial, operational, and network functions to drive measurable business impact.
Telecom providers manage complex customer relationships across multiple plans, add-ons, and usage-based services. Without clear visibility into customer-level behaviour, it is difficult to identify upgrade opportunities or intervene before churn risk increases. Sales teams often lack structured insights into how customers evolve over time.
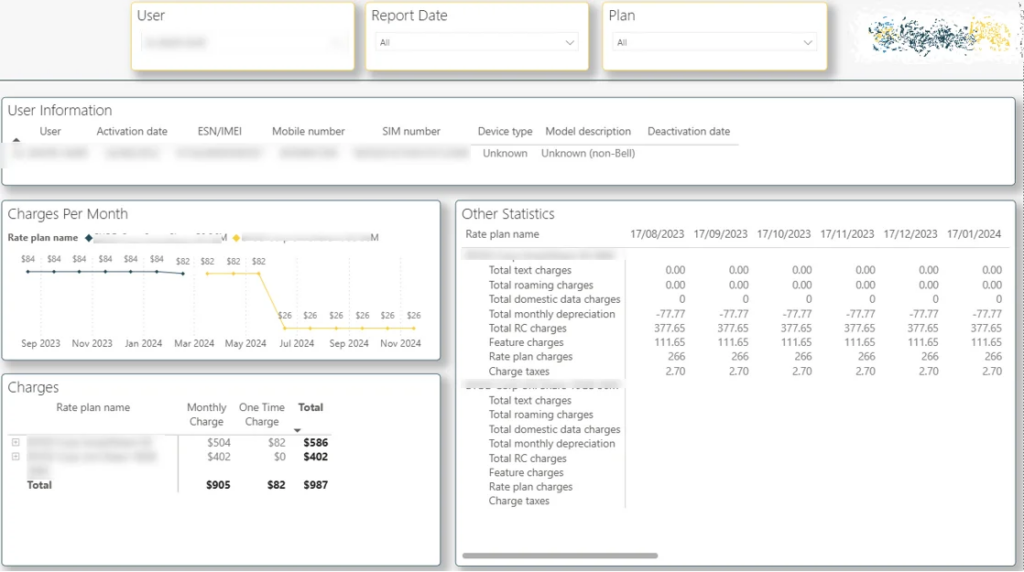
Our Power BI experts built a revenue optimisation dashboard for a wireless services company. The dashboard allows users to filter down to an individual customer and review their full commercial profile in one place.
The dashboard tracks historical plan subscriptions and highlights plan changes over time. It breaks down monthly recurring charges and one-off fees by plan, and separately visualises charges for individual services. This provides a structured view of spend patterns, product mix, and revenue contribution at customer level.
Sales teams used the dashboard to identify customers who are strong candidates for plan upgrades based on spend and service usage.
By reviewing structured customer insights before outreach, account managers made timely and targeted upgrade offers. This improved upsell effectiveness and increases average revenue per user without adding operational complexity.
Telecommunication companies sell physical devices such as smartphones, routers, headphones, and accessories alongside their core services. Hardware margins depend on pricing, purchasing discipline, and inventory control across multiple retail locations. Without structured visibility, slow-moving stock ties up cash and profitable products are not scaled fast enough.
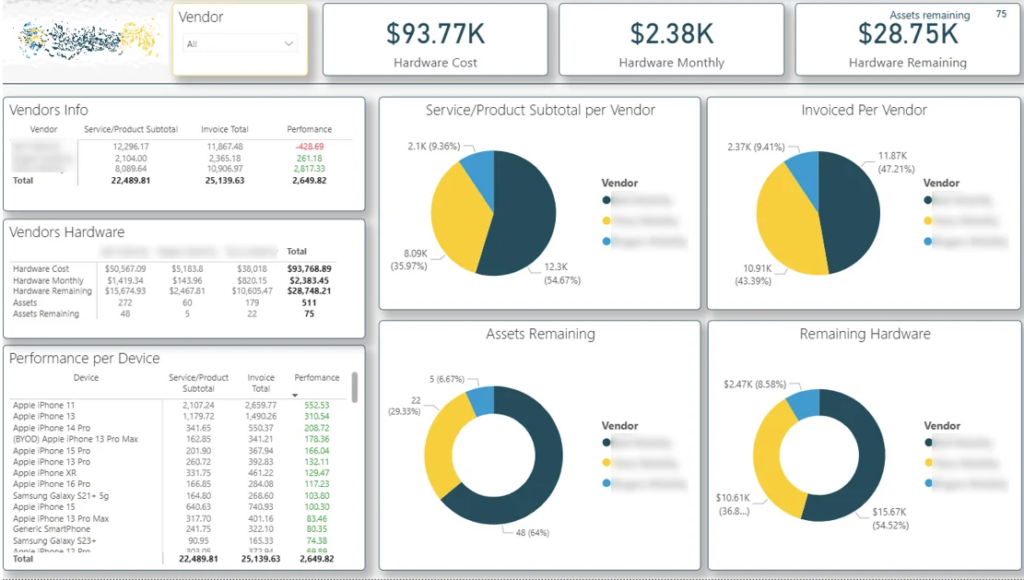
Our data visualization specialists built a sales analysis solution in Power BI for a telecom client operating three retail stores. The solution consolidates purchasing, sales, and stock data into a single performance view by store and by product category.
The solution provides a clear view of hardware performance across stores and products. It compares purchasing costs, sales revenue, and resulting margins by store to highlight profitability differences. At the same time, it tracks inventory levels, including units purchased, units remaining, and total inventory value, while breaking down revenue and cost by device type to identify high-demand products and underperforming devices.
The client used this analysis to optimise purchasing volumes and avoid overstocking slow-moving devices.
By clearly seeing which products sell fastest and generate the strongest margins, management adjusted pricing, rebalanced inventory between stores, and improved overall hardware profitability while protecting cash flow.
Customer retention is a critical focus for telecom providers, where long-term profitability depends on keeping customers engaged across plans and services. Without structured lifecycle visibility, early warning signs of churn often go unnoticed. This puts recurring revenue and customer lifetime value at risk.
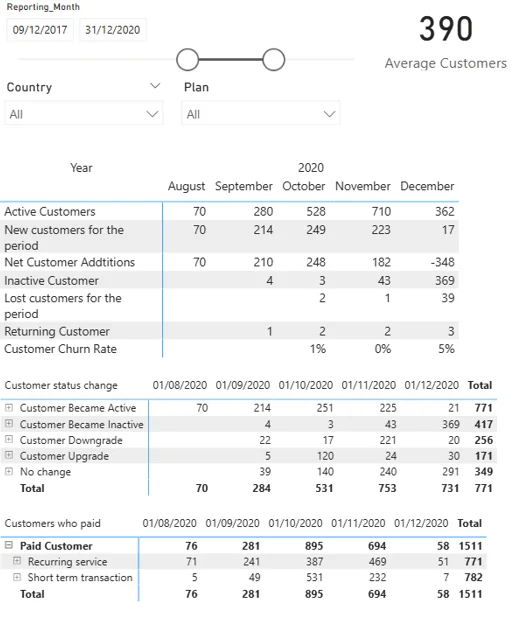
Our BI specialists built a customer retention analysis solution in Power BI for a telecom provider. The solution consolidates subscription, transaction, and customer lifecycle data into a single view that combines high-level trends with customer-level drilldowns.
The analysis tracks active, new, inactive, and returning customers on a monthly basis. It monitors churn rate, subscription movements, and plan changes, including upgrades and downgrades. It also distinguishes between recurring subscription revenue and short-term, one-off transactions, while allowing users to drill down into individual customers to see exactly who changed plans and when.
The client used this analysis to proactively manage churn and protect recurring revenue. By identifying customers who downgrade, reduce activity, or become inactive, teams can intervene early with targeted retention or upsell campaigns. This turns retention management into a structured, data-driven process rather than a reactive response.
When telecommunication companies sell to B2B clients, visibility into contracted services and spending patterns becomes essential. Enterprise accounts are typically larger, involve multiple services, and offer significant upsell potential. Without structured analysis, service gaps and expansion opportunities remain hidden within complex account structures.
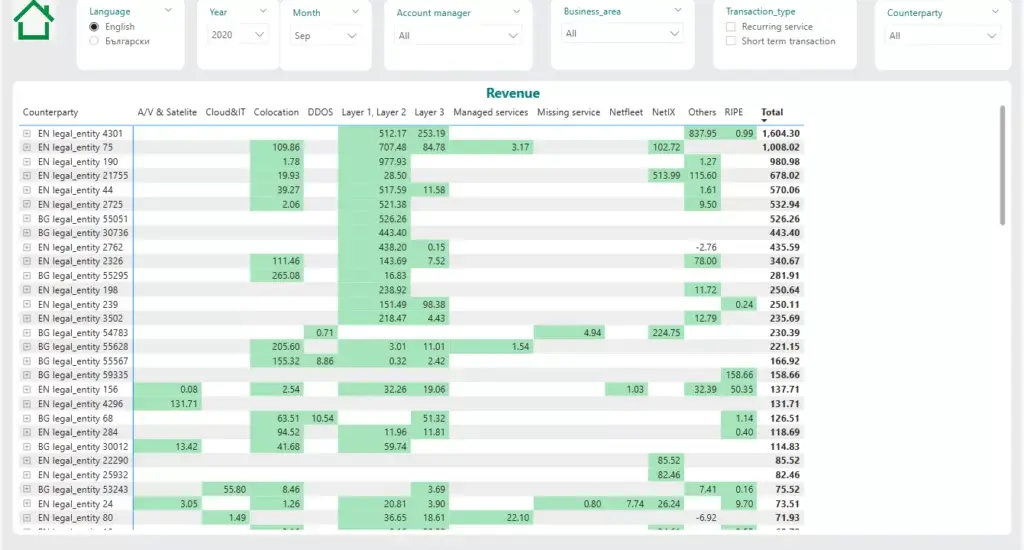
Our team built a B2B service portfolio analysis solution that consolidates contract data, billing information, and service usage into a client-level view tailored for account managers and sales leadership.
The analysis provides service-level visibility by client, showing exactly which services each B2B customer is paying for. It highlights service adoption gaps across the client base, compares account revenue contributions, and structures contracts in a way that makes cross-sell and upsell opportunities easy to identify.
The client used this analysis to proactively expand existing accounts rather than relying solely on new customer acquisition. This dashboard helped sales teams to see which clients are not using complementary services and approach them with targeted offers. This improved account penetration, increased average contract value, and strengthened long-term B2B relationships.
For telecom providers serving B2B clients, understanding total contract value is not enough. Revenue stability depends on how recurring charges evolve over time and how short-term transactions fluctuate across months and seasons. Without structured comparisons, changes in purchasing behaviour can go unnoticed until revenue is impacted.
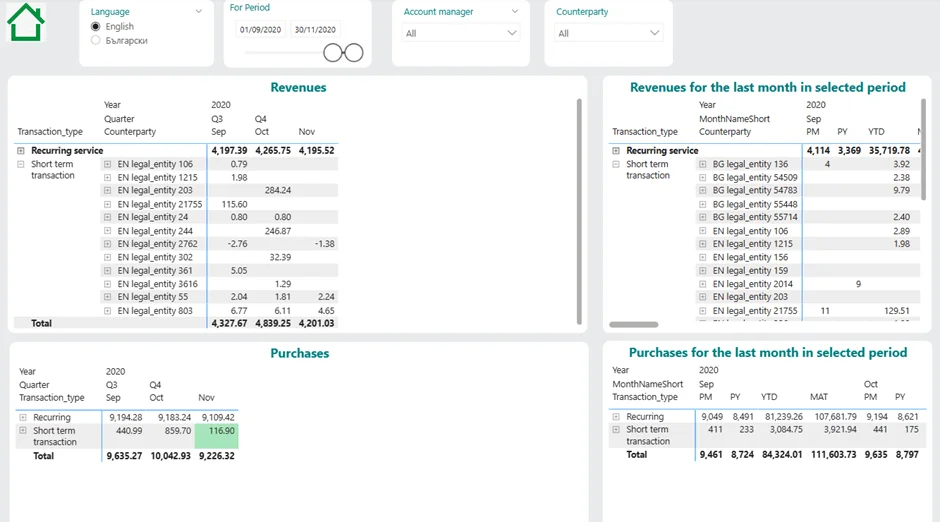
Our data visualization experts built a B2B revenue and spend analysis solution in Power BI that breaks down customer spend at a granular level. The solution consolidates recurring subscription charges and short-term transactions into a single client-level performance view.
The analysis compares performance across the current month, previous month, prior year, and year-to-date. This makes it easy to track growth trends, identify seasonality patterns, and detect unusual changes in spending behaviour. Account managers can immediately see which clients are expanding, stabilising, or reducing their spend.
This solution gave the client a structured view of how each B2B account generated revenue over time.
Sales and finance teams could clearly see which clients were growing, which were stable, and which were reducing their spend. By comparing month-over-month and year-over-year performance, they quickly detected early warning signs and emerging expansion opportunities. This allowed the team to act at the right moment, protect recurring revenue, and drive account growth based on measurable spending patterns rather than intuition.
Monthly recurring revenue is one of the most important performance indicators for telecom companies because it reflects the stability and predictability of future income. Without structured tracking, it becomes difficult to understand whether revenue growth is sustainable or driven by short-term fluctuations.
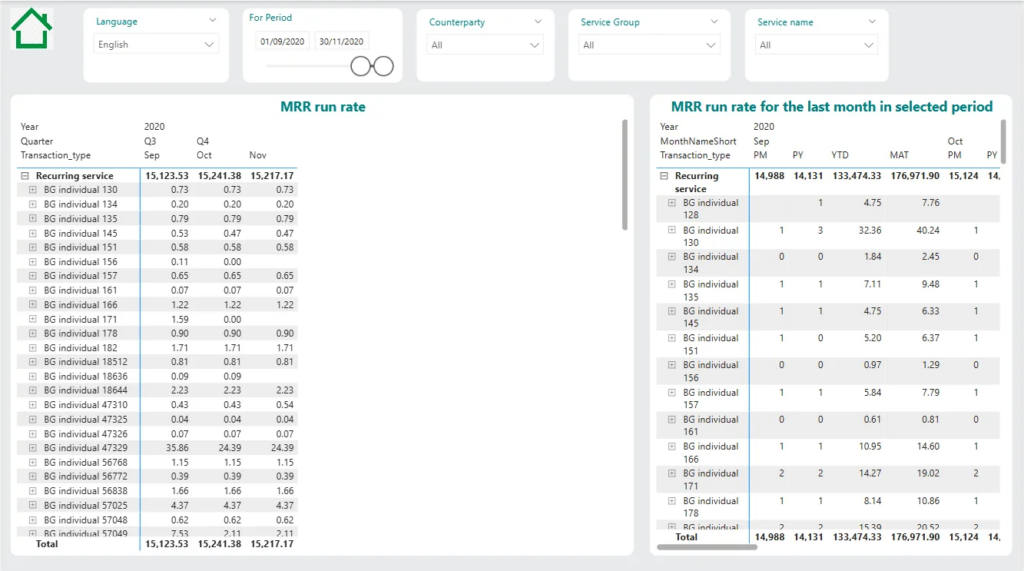
Our data analysts built an MRR analysis dashboard to monitor recurring revenue trends over time. The solution consolidated subscription data into a clear month-by-month performance view.
The analysis showed total monthly recurring revenue and highlighted how it changed month over month. It clearly flagged increases and decreases in MRR and allowed users to drill down into the specific customers responsible for those changes, including upgrades, downgrades, and churn events.
The client used this analysis to monitor revenue momentum and quickly investigate unexpected fluctuations. By identifying which customers upgraded, downgraded, or churned, the team was able to take targeted action to protect and grow recurring revenue in a structured and timely way.
Telecom providers operating across multiple cities, regions, or retail branches need clear visibility into how each location performs. This is important because regional differences in demand, competition, and customer behaviour directly impact revenue, churn, and profitability. Without structured location-level analysis, leadership cannot identify underperforming areas early or scale successful strategies across high-performing regions.
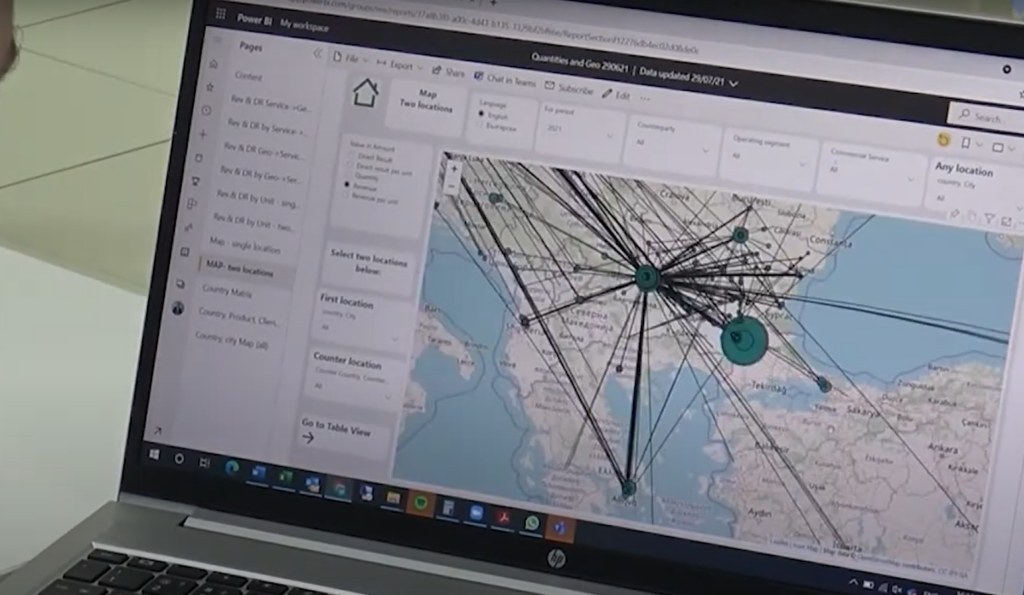
Location-level analysis evaluates key metrics such as total revenue, monthly recurring revenue, active customers, churn rate, service adoption, and hardware sales by region or store. It compares performance across current month, previous month, prior year, and year-to-date to detect growth trends, seasonality, and unexpected slowdowns. The analysis can also segment data by customer type, product category, or sales channel within each location.
By clearly understanding which locations drive growth and which lag behind, telecom companies can allocate marketing budgets, staffing, and promotional campaigns more effectively. Regional managers can take corrective action earlier, while leadership can replicate successful strategies across branches. This improves accountability, optimises resource allocation, and supports more balanced and sustainable growth across the network.
Telecom companies process millions of transactions daily, including calls, data usage, roaming activity, device purchases, and subscription changes. This scale makes the industry highly vulnerable to fraud, including subscription fraud, SIM swap fraud, identity theft, and abnormal usage patterns. Fraud is important to address because it directly impacts revenue, increases operational costs, and damages customer trust if not detected early.
Fraud detection analysis evaluates unusual patterns in usage, billing behaviour, payment history, device changes, and account modifications. It monitors sudden spikes in international calls, abnormal data consumption, multiple SIM swaps, repeated failed payments, or mismatches between customer identity data and usage behaviour. The analysis can also flag high-risk accounts based on historical fraud indicators and behavioural anomalies.
By identifying suspicious activity in near real time, telecom providers can block fraudulent transactions before financial losses escalate. This reduces revenue leakage, lowers chargeback and investigation costs, and protects legitimate customers from service disruption. Structured fraud detection also improves compliance and strengthens overall operational resilience.
Telecom companies invest heavily in customer acquisition, subsidies, and promotional offers. Without understanding the long-term value of each customer, it becomes difficult to determine how much to spend on acquisition, retention, or upselling. This is important because over-investing in low-value customers reduces profitability, while under-investing in high-value segments limits growth potential.
Lifetime value prediction analyses historical revenue, subscription tenure, usage patterns, service mix, upgrade frequency, churn probability, and payment behaviour. It segments customers based on expected future revenue contribution and estimates how much value each customer or segment is likely to generate over their lifecycle. The model can also incorporate contract length, add-on services, and historical retention trends.
By identifying high-value and low-value customer segments, telecom providers can allocate marketing and retention budgets more strategically. Customers with high lifetime value can receive premium support and targeted upsell offers, while acquisition campaigns can focus on profiles that resemble the most profitable segments. This improves return on marketing spend, increases overall profitability, and supports more sustainable long-term growth.
Telecom providers depend on stable network infrastructure and field equipment to deliver uninterrupted service. Even short periods of downtime can result in customer complaints, SLA penalties, and revenue loss. This makes predictive maintenance essential, as reacting only after equipment fails increases costs and disrupts service delivery.
Predictive analytics allows telecom companies to monitor signal strength, traffic load, temperature fluctuations, error logs, and other performance indicators in real time. By combining historical failure data with current equipment conditions, providers can detect anomalies and early warning signs that typically precede breakdowns. This enables targeted interventions such as replacing worn components, optimising network configurations, or scheduling preventive servicing before a failure occurs.
As a result, telecom companies reduce unplanned downtime and minimise emergency repair costs. Maintenance can be scheduled during off-peak hours, improving resource allocation and protecting service continuity. This proactive approach extends equipment lifespan, lowers operational expenses, and strengthens overall network reliability while reducing customer dissatisfaction.
Telecom markets evolve quickly, and without data analytics, launching new plans becomes a guessing game. Data-driven product development is critical because pricing, bundles, and service features directly influence customer acquisition, retention, and long-term profitability.
Data analytics enables telecom providers to evaluate customer usage patterns, service adoption rates, churn drivers, and pricing sensitivity at scale. It highlights which features are most valued, which add-ons generate incremental revenue, and where customers downgrade or disengage. By analysing behavioural trends, support interactions, and segment-level performance, analytics uncovers unmet needs that traditional product planning may overlook.
By embedding analytics into the product development process, telecom companies design plans aligned with measurable customer demand rather than assumptions. This improves product-market fit, increases adoption rates, reduces the risk of underperforming launches, and strengthens competitive positioning over time.
Billing is one of the most critical functions in telecom operations. Even small errors in invoicing, rating, or discount application can lead to revenue leakage, customer disputes, and regulatory risks. Given the complexity of telecom pricing models such as recurring subscriptions, usage-based charges, roaming fees, bundles, and one-off services, billing analytics becomes essential for maintaining financial accuracy and control.
Billing analytics examines invoice data, rating logic, payment behaviour, discount structures, tax calculations, and revenue recognition patterns. It identifies inconsistencies such as underbilling, overbilling, duplicate charges, incorrect tariff application, or mismatched contract terms. It can also monitor ageing receivables, failed payments, credit notes, and dispute trends to detect systemic issues early.
With structured billing analysis, telecom providers reduce revenue leakage, improve invoice accuracy, and shorten the cash collection cycle. Finance teams gain visibility into billing performance by customer segment, product, and region. This strengthens financial control, improves customer trust, and ensures recurring revenue is fully captured and correctly reported.
Telecom providers operate in highly competitive markets where generic campaigns lead to low conversion rates and wasted budgets. Without data analytics, marketing teams rely on broad assumptions rather than customer-specific insights. Targeted marketing is critical because acquisition costs are high, and retaining or upselling existing customers is often more profitable than acquiring new ones.
Data analytics enables telecom companies to segment customers based on usage patterns, spending behaviour, contract type, location, device ownership, and churn risk. It identifies high-value segments, price-sensitive users, customers eligible for upgrades, and those most likely to respond to specific offers. By analysing historical campaign performance, analytics also highlights which channels and messages drive the strongest return on investment.
With targeted marketing, telecom providers deliver personalised offers instead of mass promotions. This improves campaign conversion rates, increases average revenue per user, reduces churn, and optimises marketing spend. Over time, data-driven targeting turns marketing from a cost centre into a measurable revenue growth driver.
Telecom providers must deliver consistent network performance despite growing data consumption and fluctuating traffic patterns. Without data analytics, network issues are often addressed only after congestion or outages occur. Network optimization is critical because service quality directly impacts customer satisfaction, churn rates, and regulatory compliance.
Data analytics enables telecom companies to monitor traffic load, bandwidth utilisation, latency, packet loss, and signal strength across regions and time periods. It identifies congestion hotspots, underutilised infrastructure, and performance bottlenecks. By analysing historical and real-time network data, providers can forecast demand spikes, optimise routing, and rebalance network capacity before service quality declines.
With network optimization driven by analytics, telecom companies improve uptime, reduce service disruptions, and allocate infrastructure investments more strategically. This results in stronger customer experience, lower churn, and more efficient capital expenditure planning.
Telecom providers manage complex operations across network infrastructure, customer service, billing, logistics, and field teams. Without data analytics, operational inefficiencies remain hidden within disconnected systems and manual processes. Operational analysis is critical because even small inefficiencies at scale can significantly impact cost structure, service quality, and profitability.
Operational analytics evaluates key performance indicators such as service activation times, ticket resolution rates, billing accuracy, field technician productivity, equipment utilisation, and process turnaround times. It identifies bottlenecks, delays, resource imbalances, and recurring operational errors. By combining data from ERP systems, CRM platforms, and network logs, telecom companies gain a unified view of operational performance.
With structured operational analysis, telecom providers streamline workflows, reduce manual intervention, and improve cross-department coordination. This lowers operating costs, increases service reliability, and enables faster response to operational issues. Over time, data-driven operational management improves efficiency, scalability, and overall business resilience.
Customer experience directly influences retention, upsell potential, and brand reputation in the telecom industry. With multiple touchpoints across call centres, retail stores, mobile apps, and online portals, service quality can vary significantly. Without data analytics, customer dissatisfaction often becomes visible only after complaints increase or churn occurs.
Customer experience analytics evaluates service response times, ticket resolution rates, call centre performance, complaint categories, network quality metrics, and customer satisfaction scores. It connects operational data with behavioural signals such as declining usage, late payments, or repeated support interactions. Sentiment analysis from surveys and feedback forms can further highlight pain points across regions or customer segments.
By using analytics to monitor and improve customer experience, telecom providers identify service gaps before they escalate. This reduces churn, improves first-contact resolution rates, and increases customer lifetime value. Over time, structured customer experience analysis strengthens loyalty, enhances brand perception, and supports sustainable revenue growth.
Telecom operators manage large and complex cost structures, including network infrastructure expenses, vendor contracts, interconnection fees, spectrum costs, field operations, and administrative spending. Without structured expense reporting analytics, it becomes difficult to understand where money is being spent, which costs are rising, and where inefficiencies exist.
Expense reporting analytics analyses cost data from ERP systems, procurement platforms, vendor invoices, and accounting records. It categorises expenses by department, cost centre, region, vendor, and service type. The analysis tracks trends over time, compares actual spend against budgets, and highlights unusual cost spikes or recurring overspending. It can also identify duplicate payments, contract pricing inconsistencies, and underutilised services.
With clear expense visibility, finance teams strengthen cost control and improve budgeting accuracy. Leadership can evaluate vendor performance, renegotiate contracts, and reallocate resources based on measurable spending patterns. This reduces unnecessary costs, improves margin control, and ensures capital and operational expenses are aligned with business priorities.
Telecom analytics improves how operators manage revenue, customers, networks, and internal processes. Instead of relying on assumptions or delayed reports, companies use structured data to make faster and more accurate decisions. The result is stronger financial performance and better service delivery.
Revenue Growth
By analysing customer spend, service adoption, and pricing performance, telecom providers identify clear upsell and cross-sell opportunities. Teams focus on high-value accounts, optimise tariffs, and increase average revenue per user. This protects recurring income and supports sustainable growth.
Lower Churn
Churn analysis highlights early warning signs such as declining usage, repeated complaints, or plan downgrades. Retention teams can intervene before customers leave. This improves customer lifetime value and reduces the cost of replacing lost subscribers.
Better Customer Experience
Analytics connects support data, network performance metrics, and customer feedback into one structured view. Companies identify service gaps, slow response times, and recurring issues early. This reduces complaints and strengthens customer loyalty.
Stronger Network Performance
Telecom operators monitor traffic load, congestion, signal strength, and latency in real time. This helps them rebalance capacity, plan infrastructure investments, and reduce outages. Improved reliability directly impacts customer satisfaction and brand reputation.
Higher Operational Efficiency
When data from CRM, billing, ERP, and network systems is consolidated, operational bottlenecks become visible. Teams reduce manual reporting, streamline workflows, and improve coordination across departments. This lowers operating costs and improves execution speed.
Reduced Fraud and Risk
Usage anomalies, suspicious transactions, and billing inconsistencies can be detected quickly through structured analysis. Early detection reduces financial losses and protects customer trust. It also strengthens compliance and internal controls.
Telecom analytics offers strong business benefits, but implementation is rarely straightforward. Telecom providers operate with massive datasets, complex system landscapes, and strict regulatory requirements. Understanding the most common challenges helps companies plan their analytics initiatives more effectively and avoid costly delays.
Large Data Volume
Large data volume in the telecommunication industry offers a great opportunity because this makes the analysis more conclusive. If a large volume of data supports the identified patterns, decision makers can act with more confidence.
On the other hand, analysing large data volumes is a challenge on a technical level. The graphs produced as a result of analysis may take a long time to load leading to bad user experience and long development cycles. We solved this problem in our project with Neterra Telecommunications using a variety of measures:
Many Data Sources in Silos
Even though telcos often have an ERP for their transactional and customer data, a lot of data is still siloed. For example, many telecom companies have a need to analyse marketing data together with the data from ERP.
If you find that your data is siloed in many different data sources, aggregating it in a single place is an important step towards comprehensive analytics
You can usually extract the data automatically from your data sources by using data engineering services. Your data sources likely have APIs which means it is possible to write code that sends API requests, receives data and inserts it into a database like SQL Server.
Data Quality
Issues In real-world telecom data analytics projects data often requires substantial cleaning and transformation. This is perfectly normal and does not necessarily mean that your company isn’t ready for analytics.
Common data issues involve missing values in certain columns, inconsistent naming conventions, conflicting data types, etc.
We usually transform the data in either SQL or Power Query. These tools allow us to specify the transformation steps applied to your data every time the data is refreshed in your analytics reports.
Security and Privacy Risks
Telecom providers handle highly sensitive information, including personal details, billing data, and location records. This makes them attractive targets for cyberattacks. At the same time, strict data protection regulations require careful handling of customer information.
Strong encryption, role-based access controls, data masking, and monitoring of unusual access patterns are necessary to protect data integrity. Security must be embedded into the analytics architecture from the beginning.
Even if you know what analysis you want to create, you need to choose the right technologies to enable you to create it. You will find our recommendations for technologies to use below:
Technologies for Data Visualization and Descriptive Analytics
You would typically use these technologies for creating management reports that highlight current and historical performance. You would use them to create charts and tables that analyse your data and present the results in a visual form.
Power BI is our personal favorite being the leading software in the Business Intelligence market. It supports the analysis of large data volumes (millions of rows) which is so important for telecommunication analytics. It also integrates well with other Microsoft tools like Sharepoint and OneDrive so if your telco is using many other Microsoft tools, Power BI might be a natural choice.
Tableau is the main competitor of Power BI and it is also capable of analysing large data volumes. It is a bit more common for businesses outside of the Microsoft ecosystem and has superior data visualization capabilities. Tableau is slightly more expansive than Power BI though so make sure you are prepared for the licensing costs.
Feel free to read our guide for a detailed comparison of Tableau vs Power BI.
We definitely do not recommend using Excel for your descriptive data analytics since it is only capable of loading up to 1 million rows per tab. This is often insufficient for the data volumes in the telecommunication industry and leads to heavy files that are slow to run.
Technologies for Predictive Analytics
Some simple predictive analytics techniques such as linear regression are possible to apply in Power BI or Tableau. However, larger scale predictive analytics in the telecom industry usually requires machine learning algorithms to complete the project.
Python is probably the most common tool of choice for predictive analytics which is great for large data volumes. Several Python packages such as Scikit-learn and Numpy that can be used to create advanced machine learning models predicting your financial performance or customer churn.
If you prefer a lower-code tool to create your machine learning models, you might want to consider SAS. It allows you to create the same models but offers a drag and drop functionality to create them and you can write code to customize those.
Technologies for Data Warehousing
Apart from data analytics technologies, you might also need some supporting data infrastructure. You would typically use a data warehouse technology to store large amounts of data and aggregate data from multiple sources.
Azure SQL Server is a great choice for businesses that primarily use Microsoft technologies.
Azure SQL Server databases integrate easily with Microsoft Fabric which enables companies to share data sets easily between teams and access AI support chat bot called co-pilot.
Google Big Query is an alternative to Azure SQL Server which also supports storing large volumes of data. It might be a more suitable solution for pulling the data from other google data sources such as Google Ads and Analytics.
Telecom analytics is moving toward faster, smarter, and more automated decision-making. As networks grow and customer expectations rise, data analytics in the telecom industry is becoming a core part of daily operations rather than just a reporting tool.
One major shift is real-time analysis. With 5G and IoT generating continuous data streams, telecom providers rely on telecom network analytics to monitor traffic, detect congestion, and maintain service quality instantly. This allows operators to prevent issues before customers notice them.
Another key trend is the use of predictive models. Modern telecom data analytics now supports churn prediction, fraud detection, and predictive maintenance. Instead of reacting to problems, companies can anticipate risks and act early.
Cloud infrastructure is also reshaping the industry. Scalable platforms make it easier to manage large volumes of telco data and connect CRM, billing, ERP, and network systems into one unified environment. This strengthens telecom business analytics and improves visibility across the organisation.
Overall, the future of analytics in the telecom industry is centred on real-time insights, automation, and integration. Providers that invest in modern telecom analytics capabilities will improve performance, reduce costs, and stay competitive in a rapidly evolving market.
Telecom big data analytics is no longer optional. In an industry built on recurring revenue, complex pricing structures, and large-scale infrastructure, even small inefficiencies can have a measurable financial impact. Structured telecom analytics gives leadership clear, consistent insight into revenue drivers, churn risks, operational bottlenecks, and network performance.
From revenue optimisation and churn management to telecom network analytics and operational control, telecom analytics use cases span every core function of a telecom organisation. When CRM, billing, ERP, and network data are unified into a single source of truth, decision-making becomes faster, more accurate, and aligned across departments.
If you are looking to improve revenue control, reduce churn, optimise network performance, or automate reporting, our team can help. We design custom telecom data analytics solutions tailored to your systems, processes, and leadership needs.Contact us to discuss your telecom analytics project and discover how structured, scalable data solutions can drive measurable business impact!
![]()
![]()
![]()