 Power BI vs Tableau is a long-time rivalry! Both of them have been the 2 leading software products for the last decade. As a result, when companies choose BI software, they often choose between Power BI and Tableau.
Many business choose wrong and end up migrating from Tableau to Power BI or the other way round later. If you want to avoid those migration projects in the future, it is important to understand how Tableau compares to Power BI.
Every year Gartner makes a magic quadrant and every year the situation is pretty much the same. Microsoft Power BI is the top software for business intelligence followed by Tableau. However, there is more to this story. For some companies Power BI is a better fit whereas for some Tableau would bring more efficiency.
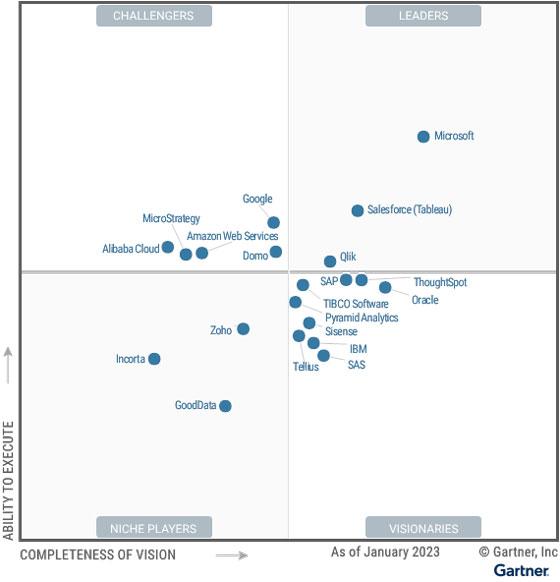
If you don’t want to watch the video we have attached above, the graph offers a great representation of where Tableau and Power BI sits among competitors.
In this article, we’ll compare the two industry-leading data visualisation tools, delving into their key features and functionalities, user experience, pricing, integration, and strengths and weaknesses.
Let’s start with the big and important criteria. After we cover the big things, we will continue by comparing the 2 based on the functionality inside.
| Power BI | Tableau | |
| Launch Year | 2015 | 2003 |
| Number of Connectors | 215 | 95 |
| Supported Operational Systems | Windows | Windows, Mac, Linux |
| Cost of License Needed To Develop Reports | FREE | $70 per month |
| Cost of License To Share Reports | $10 per month | $15 per month |
Tableau, founded in 2003, has established itself as a leading data visualisation tool since its inception. As you can see, it is much older than Power BI. This basically means that Tableau had more time to evolve and add functionality. As a result, the number of ways you can customise your data visualisation is higher if you use Tableau.
Tableau has 92 certified connectors at the time of writing this article. This means that there are 92 data sources to which you can connect effortlessly. Saying that, many Tableau developers also use Alteryx which is a third-party connector tool. Alteryx connects to 90 more data sources but comes at a hefty cost of $5,000. So it makes sense that when it comes to Tableau vs Alteryx, it becomes more cost-effective.
Tableau Desktop is a software that you need to download in order to build Tableau reports. This software is compatible with Windows, Mac, Linux.
If you want to build reports in Tableau, you need a Tableau Creator license which costs $70 per month. There is a 14-day free trial for this license so that you can explore the interface of Tableau a little bit.
Anyone who needs to view reports in Tableau needs a Tableau viewer license which costs $15 per user per month. If you have 100 report viewers, your costs will be $1500 per month.
Power BI was developed by Microsoft in 2015 which is a lot later than Tableau. As a result, the number of ways you can customise your data visualisation is a bit more limited in Power BI. Saying that, Power BI has been evolving very quickly and it already has far more customisation options in comparison to Qlik or Google Data Studio.
Power BI natively connects to 215 data sources which is a lot more than Tableau. Saying that, a lot of those data sources are other Microsoft services including:
Power BI reports are created in a desktop application called Power BI Desktop. This application is only available on Windows so if your organisation is running on Mac laptops, Power BI might not be the best software for you. You can still access it from Mac if you use a Windows virtual machine, but this is just more difficult.
If you want to build reports in Power BI, you don’t need any license. You can simply use Power BI Desktop which is free to download. You can then take your time exploring the software before you decide to pay for it.
Anyone who needs to view Power BI reports that are shared with them needs to have a Power BI Pro license which costs $10 per user per month. If you have 100 users, this will cost you $1,000 per month. Another thing worth saying is that if your company already has Microsoft Office 365 E5 licenses, Power BI will be included into it already so it will come at no additional cost to you! Power BI pricing vs Tableau can be a significant either way depending on what you are looking for but Microsoft will always have the upper hand due to the level of adoption across businesses.
Comparing Tableau and Power BI pricing and licensing models are significant considerations for organisations when choosing between Tableau and Power BI. Tableau offers different licensing options, including Tableau Desktop for individual use, Tableau Server for collaboration and sharing, and Tableau Online for cloud-based deployment. The pricing structure is based on a per-user or per-server basis, with the minimum cost being $15 and the cost can vary depending on the deployment model.
Power BI, on the other hand, offers a tiered pricing model with different plans, including Power BI Desktop (free), Power BI Pro, and Power BI Premium. Power BI Pro is suitable for individual users and small teams, while Power BI Premium is designed for enterprise-scale deployments with enhanced performance and advanced features. The minimum cost is $10 per user per month, making it a budget friendly option for small-scale businesses.
Now that we have compared the 2 tools on a high level, let’s look into them in more detail. Which functionalities are available in Tableau that are not available in Power BI and vice versa? The next section of the article covers this topic exactly!
Before we jump into individual features, here is a quick summary of the rest of the article.
Tableau’s strengths lie in its support of Mac and Linux, extensive visualisation options, and advanced flexibility in setting data refresh schedule. Tableau’s visual appeal and ease of use make it a favorite among data analysts and business users.
As for relative weaknesses, it is a standalone tool which makes it harder to integrate into a company software ecosystem. It is also a little bit more expensive than Power BI and offers a little bit less data transformation and AI capabilities.
Power BI’s strength lies in its integration with the Microsoft ecosystem, making it an attractive choice for organisations heavily reliant on Microsoft tools. Its data modeling and preparation capabilities, coupled with AI features, make it suitable for teams working on enterprise-scale projects. Power BI’s pricing structure and options cater to a wide range of budgets, allowing organisations to scale their deployments as needed.
However, you have less options to customise your data visuals with Power BI as compared to Tableau. Power BI is also not available for Mac and Linux users.
Before you start analysing the data, you need to transform it to a convenient format to work with. If you can perform data transformations with less effort, this is going to save a lot of time for you during your projects. On the other hand, if some data transformations are not available, this will make projects take longer since you would have to look for workarounds.
In Tableau data transformation are performed in a separate tool called Tableau Prep. If you have a Tableau creator license, this means that you don’t need to pay extra for Tableau Prep.
In Power BI, you would perform data transformations inside of Power Query which is a tool inside of Power BI. By the way, Power Query is also available inside of Excel so if you are an advanced Excel user, you might already be familiar with it.
There are some data transformations that are available in Power Query but not available in Tableau Prep. For example, it is not possible to transpose rows so you have to use a workaround.
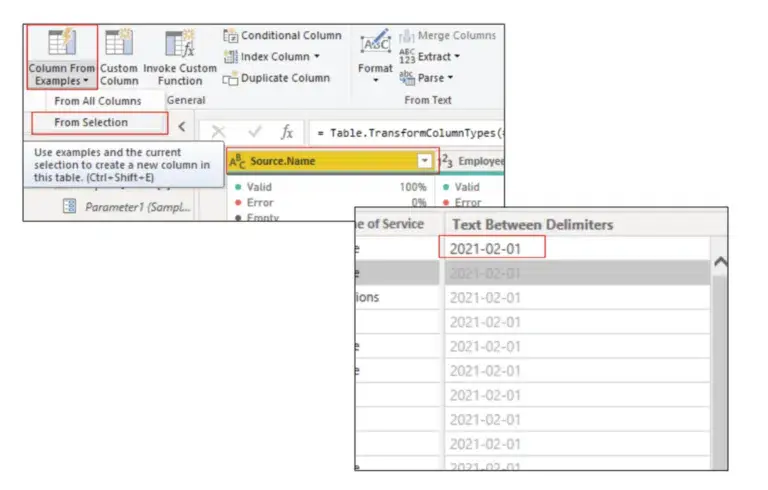
Power Query also makes it easier to create calculated columns. With Power Query you can click “Add a column from examples” and you can type what you want your values to be. Based on your input Power Query will generate a formula to make the values as per description. This is functionality is also unavailable inside of Tableau Prep.
Here is a great article demonstrating how to prepare data in Power BI vs Tableau. This article shows screenshots of how to apply data transformations in Alteryx vs Tableau vs Power BI.
Because some Power Query features are unavailable inside Tableau Prep, I would say that Power BI has more advanced data transformation functionality.
Real time means different things for different people. Some dashboard users would consider one refresh a day as real time. Let’s discuss how close to real time you can bring your Power BI reports vs Tableau reports.
To give a fair comparison, it is important to say that Power BI and Tableau offer a variety of connectivity modes. If you want to read more about types of connectivity modes, check out this article.
With import mode Tableau vs Power BI would physically extract the data and store it within the tool. This connectivity mode is the one which is most commonly used for creating dashboards so don’t disregard it. Power BI can refresh the data up to 8 times per day if you have a Power BI Pro license. You can also pay extra for a Power BI Premium license which allows you to refresh the data up to 48 times per day. With Tableau Server you can schedule refresh up to once per hour.
You can make your data refresh virtually real time by using Direct Query in Power BI or Live Connection in Tableau.
After all the research, I would say that Tableau and Power BI have equal capabilities for analysing large volumes of data. Whichever tool you go for, you will need to understand that simply choosing Power BI or Tableau is not enough to analyse Big Data. Your ability to analyse big data will depend a lot more on your underlying data architecture and your developers using good practices.
A lot of blogs that I read say that Power BI can only handle up to 10 GB of data while Tableau can handle billions of rows of data. However, none of them refer to any features that back up this point and no one tells where the 10 GB number comes from. Let’s clarify that!
10 GB limit doesn’t mean that if you have more than 10GB of data you can’t use Power BI. Here is what it actually means:
Once you extract data using Power BI using Import mode, it compresses data significantly and then stores it inside of a Power BI dataset. Therefore, a 100 GB dataset can be compressed by Power BI and still fit inside of the 10 GB dataset limit.
If you want to analyse billions of rows of data inside of Power BI, you also can do it but you need a Power BI Premium license. With Power BI premium you can push this limit to 400 GB per dataset. Here is the official Microsoft documentation about growing your dataset beyond 10 GB in size.
Apart from compressing data, Power BI has other features that enable developers to work with large datasets. For example you can set up incremental refresh where instead of refreshing the whole table, you just import new rows of data.
Finally, I was able to find a blog from Kyle Hale where he was able to query one trillion rows of data into Power BI. I believe his case study shows that you can work with huge volumes of data if your data architecture is right and if you use good practices. You can read more about it here.
As for Tableau, it has a reputation for being really good at working with large volumes of data. But is it all hype?
Well, not really. Just like with Power BI, there are features that enable developers to work with large datasets and there are some limitations too.
Tableau also compressed data significantly when you use Import storage mode. It also offers functionality to refresh data incrementally which would only import new rows of data instead of refreshing the whole dataset.
Just like with Power BI, there are limitations for how much data Tableau can store within a dataset. The limitation per data source is 15 GB under standard license and 25 GB under advanced management license. Here is the official Tableau documentation about the data size limits.
Can Tableau handle billions rows of data? The answer is yes. Here is a testimonial from Hanesbrands where they described how they built Tableau solutions that analyse billions of rows. I was also able to find evidence that some users analyse trillions of rows inside of Tableau.
Both Tableau and Power BI have some AI features integrated into them. However, which tool is more advanced in integrating AI?
First of all, both Tableau and Power Bi have capabilities for integrating R and Python within themselves. This already opens a lot of possibilities for developers to build predictive analytics solutions.
There are also lots of built-in AI features in both Tableau and Power BI. This is where we can see some difference between the two.
The biggest difference comes from the recent announcement of Microsoft Fabric. Microsoft demonstrated co-pilot which enables users to create dashboards with natural language. This is a feature which is not available in Tableau yet.
On a smaller scale, both Tableau and Power BI enable users to create individual charts using natural language. Power BI Q&A feature allows users to write which chart they want to see and then Power BI automatically creates it. Tableau has a similar feature called Ask Data which works exactly the same way.
What about sentiment analysis of your text data? Power BI is ahead of Tableau in this regard in my opinion. Tableau enables sentiment analysis through integration with Python using a plugin called TabPy. Power BI also can use Python but in addition to that, it has in-built sentiment analysis algorithms which leverage Azure cognitive services. This article from visualBI explains the difference between Power BI and Tableau in a lot of detail.
Data Visualisation If you want to design beautiful reports, you can do this with both Tableau and Power BI. Below you will find some designs that we created for our clients using Tableau and Power BI.
Most of functionality for customising the data visuals is going to be shared between Power BI and Tableau. However, there are some differences.
In my experience, Tableau offers more ways of customising the data visualisations. This is especially noticeable with geographic data. For example, with Tableau you can use 2 types of conditional formatting at the same time: points on the map and colors for the areas. This is something that Power BI can not achieve.
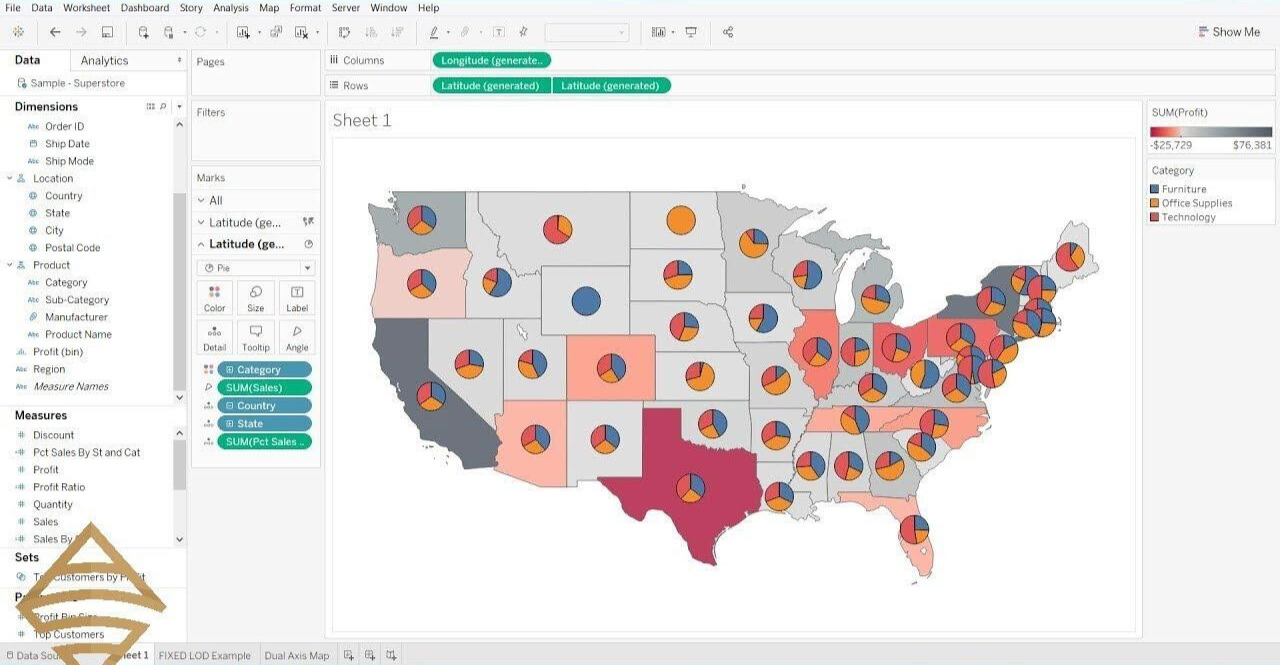
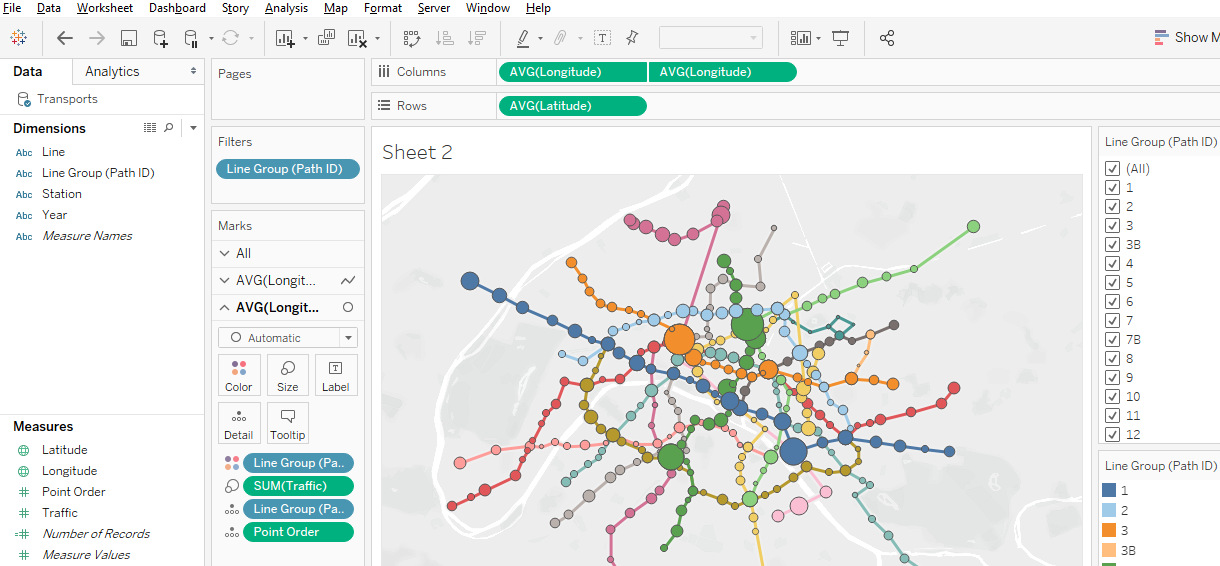
Tableau is also really good at creating maps where dots are connected which is useful for industries like logistics and aviation. For example, you can use these maps to visualise the volume of passengers that travel between cities in the US. You can also make the lines between cities thicker if the number of passengers is more. This is something you would struggle to create with Power BI.
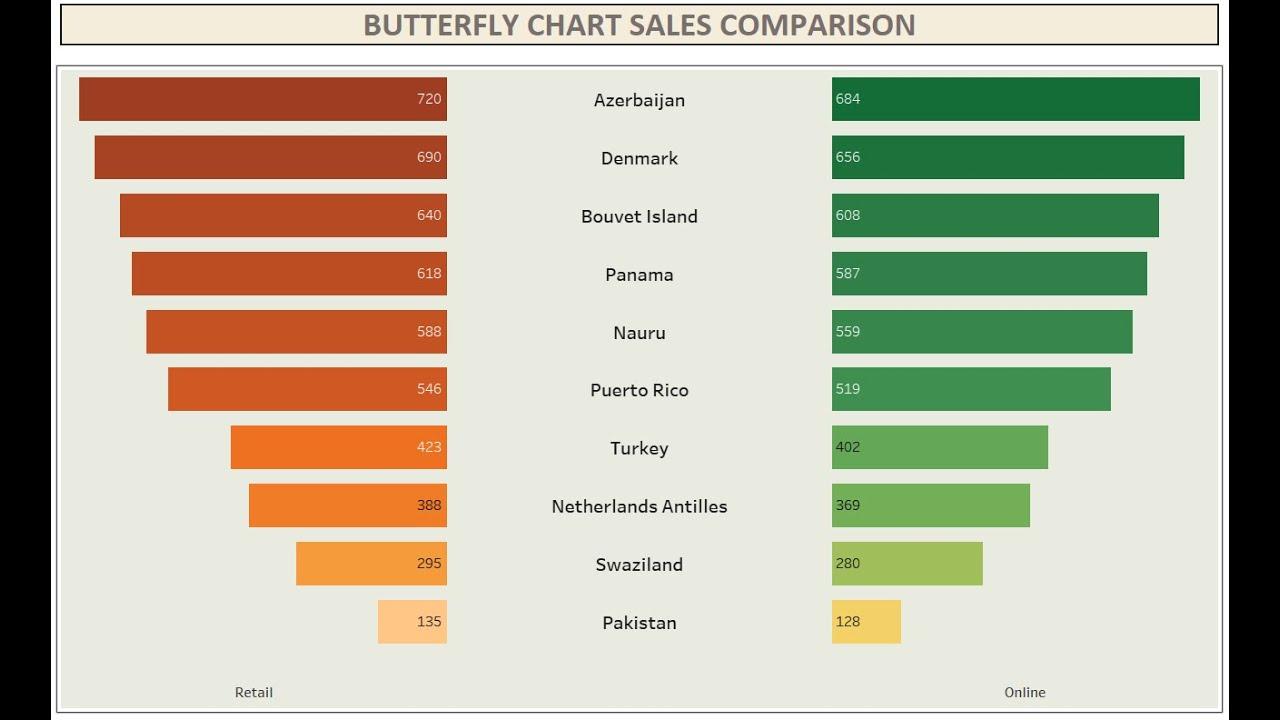
There are also some advantages of Tableau over Power BI when it comes to bar charts. Tableau offers some advance bar chart options like butterfly chart below.
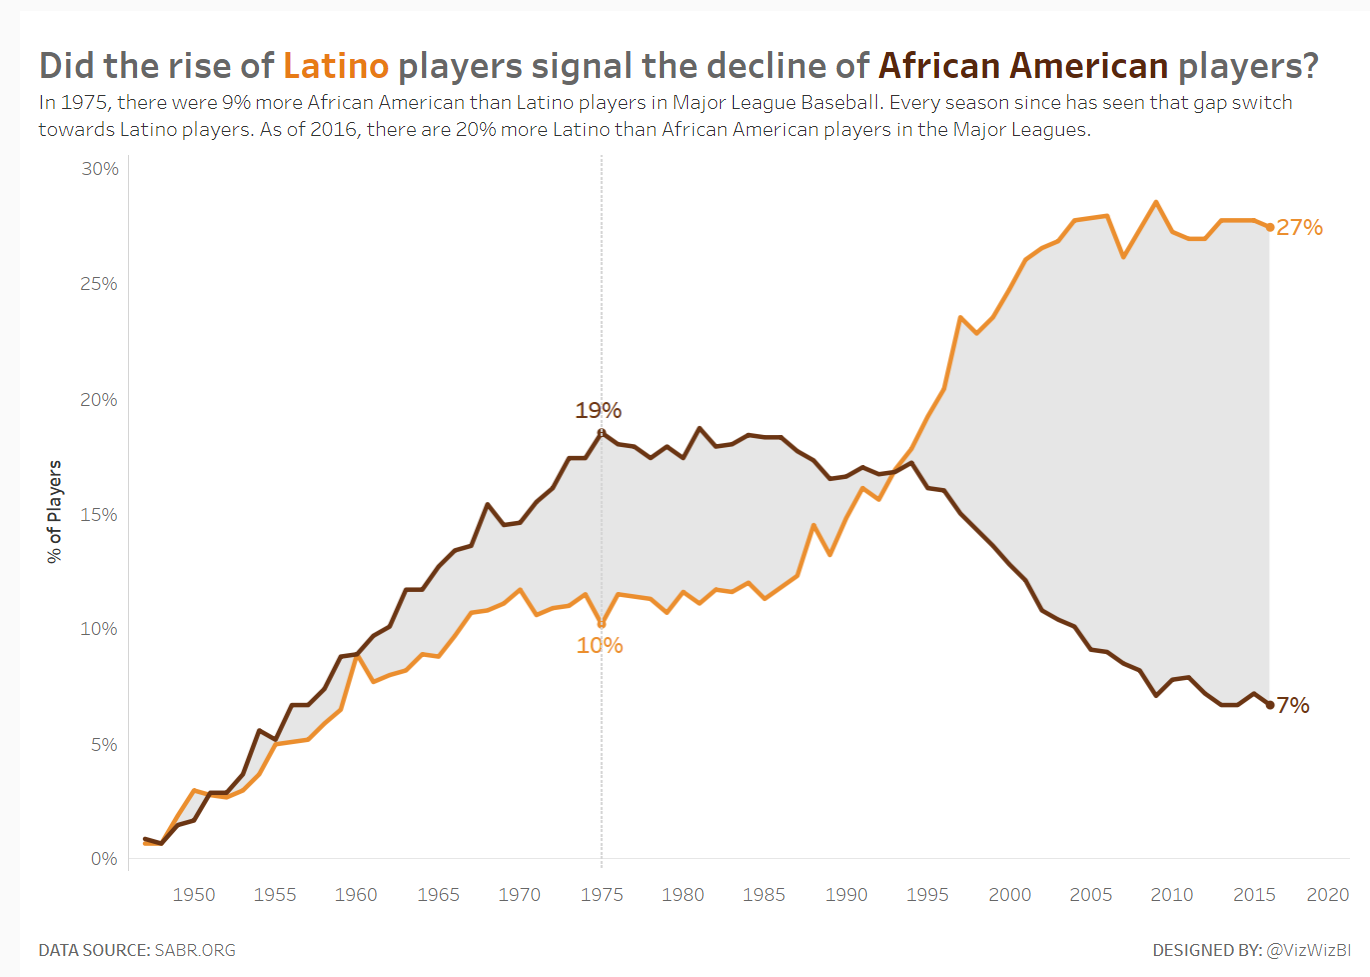
You can also see advantages of Tableau when it comes to line charts. For example, you can colour the area before the 2 lines in Tableau which is something that you can not achieve in Power BI.
To summarise, I would say that Tableau is superior to Power BI when it comes to number of customisation options available. At the same time, Microsoft are doing a lot of updates to Power BI and I can say for the last 4 years they made a lot of similar customisation options available. Saying that, Microsoft still have some catching up to do with Tableau in terms of customisation options available.
Instead of giving you my subjective opinion on which one is easier to learn, I will present you with objective reviews from Tableau and Power BI customers on G2.
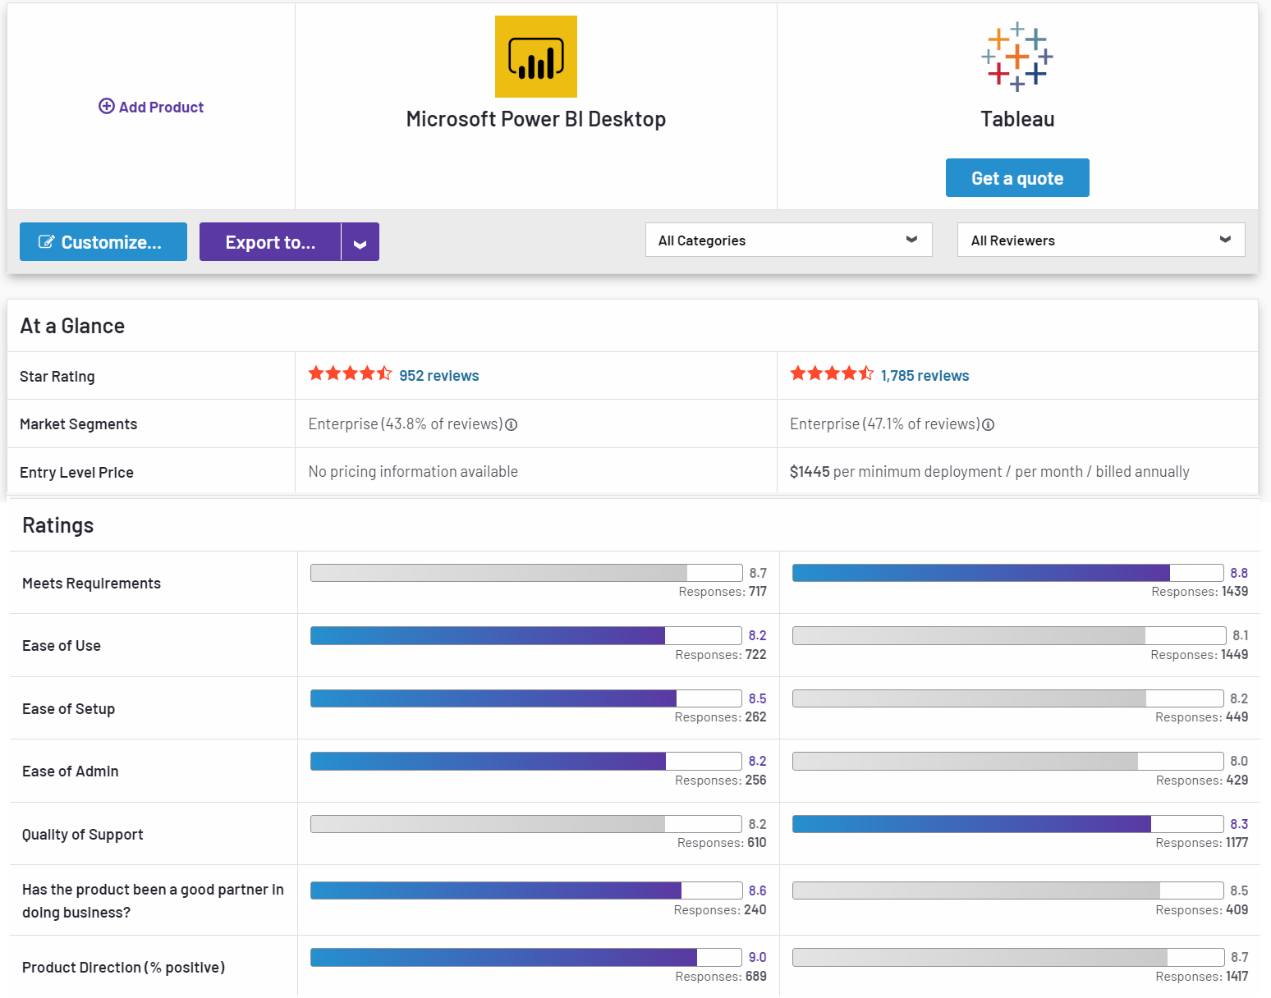
As you can see, users are finding Power BI slightly easier to use and set up as compared to Tableau. However, at the same time Tableau has almost 2 times more reviews that Power BI which skews the results a little bit.
I also want to share the feedback from our clients. A lot of they are saying that Tableau has so much functionality that it sometimes becomes overwhelming for new users. At the same time, some of our clients are saying that they feel Power BI has less functionality, but it is easier to navigate.
Finally, some areas of Power BI are also available in Excel. For example, Power Query is also available inside of Excel. If you used Power Pivot add-on in Excel to customise your pivot tables, you will also be somewhat familiar with DAX. DAX is one of fundamental blocks of Power BI. Therefore, when advance Excel users open Power BI for the first time, they find some interface instantly familiar.
Choosing between Tableau and Power BI ultimately depends on the needs and requirements of the organisation.
It is recommended that users consider factors such as ease of use, pricing, data integration requirements, advanced analytics needs, and the existing technology landscape before making a decision. Taking advantage of free trials or demos can also help users experience the tools first hand and evaluate their suitability for specific use cases. Ultimately, both Tableau and Power BI are powerful tools that enable organisations to unlock insights from their data and make data-driven decisions.
![]()
![]()
![]()