SEMrush Dashboards

SEMrush provides all kinds of SEO data, tools, and insights in abundance, and the best way to make the most of SEMrush is by utilizing dashboards.

Every business, especially yours, has unique SEO needs and therefore needs SEO Dashboards that are unique to their businesses.

Generic reports might give you a glimpse of how you’re doing, but true progress comes from focusing on what matters most to your business.

In other words, if you want to start seeing real, measurable results for your SEO efforts, then it’s time to adopt a custom dashboard that tracks the metrics that directly impact your specific goals.

Good thing Custom SEMrush dashboards are part of the solutions Vidi offers.

Questions a SEMrush Dashboard can Answer

Better Questions lead to better answers which then translates to better strategy and ultimately better results i.e. improved website traffic, higher rankings, and stronger conversions.

A well-designed SEMrush dashboard can answer the questions that are most critical to your business’s success, such as:

  • Which keywords are driving the most traffic to my site?
  • How does my website rank for target keywords compared to competitors?
  • What are the top pages on my site and their performance metrics?
  • What is my website’s conversion rate?
  • How effective are my backlink strategies?
  • What is the trend of my website’s visibility and search engine rankings over time?

And so much more.

Now, to truly understand how these insights morph into real results, let’s look at an example of a SEMrush dashboard we built for a previous client.

Case Study: Tracking SEO Metrics in our Custom SEMrush Dashboard

SEMrush Dashboards
The Keyword Performance dashboard above tracks metrics like:
  • Impressions: The number of times your website appeared in search results for a given query.
  • Clicks: The number of times users clicked on your website in search results.
  • Click-Through Rate (CTR): The percentage of users who clicked on your website after seeing it in search results. (Calculated by Clicks / Impressions)
  • Average Position: The average ranking of your website for all keywords tracked.

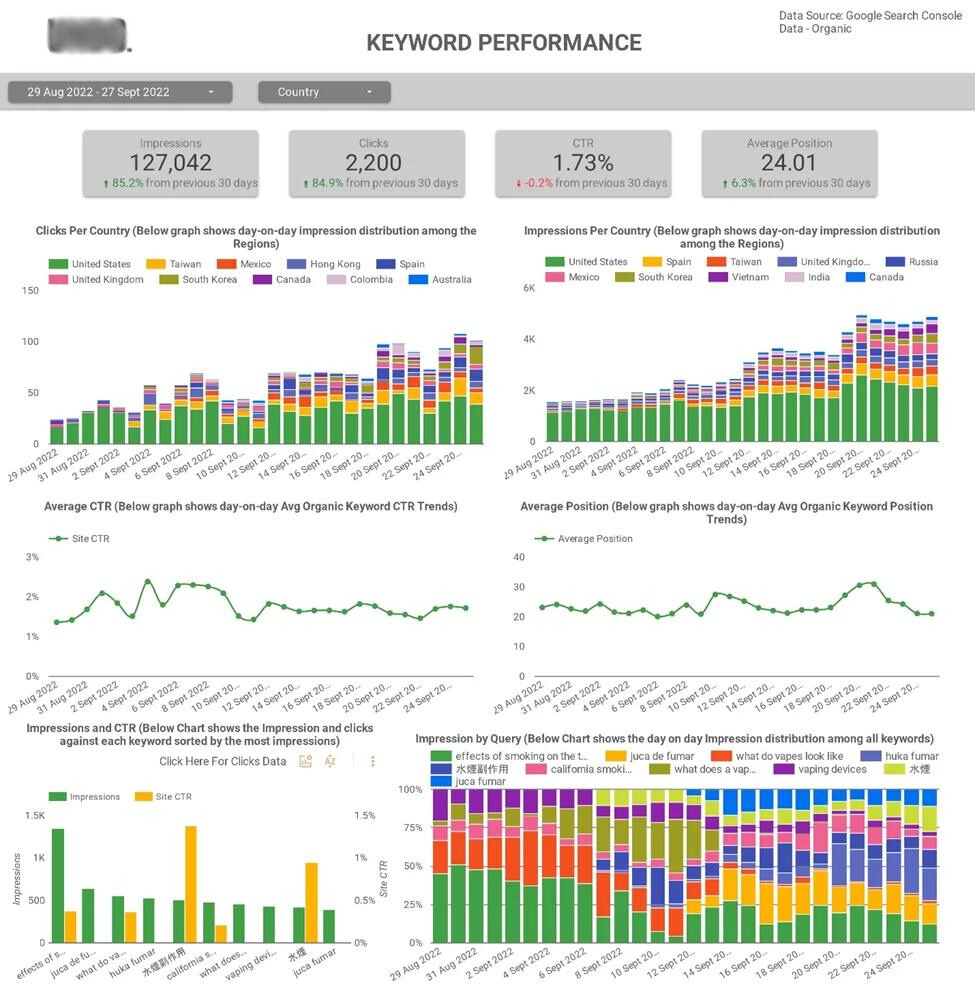
The Dashboard allows you to track all these metrics by date and/ or country.

It further answers questions around:
  • Organic search traffic trends (Impression Trend graph)
  • The keywords driving the most traffic to our website (Impression by Query chart)
  • Average ranking of our website for organic keywords (Average Position graph)
  • Click-through-rate trend (CTR Trend graph)

The insights gotten from the dashboard point you to areas of your SEO strategy that are working (and not working) i.e. it allows you to see how your website’s performance has changed/ improved over time and which keywords are driving the most impressions to your site.

You can use all this information to finetune your SEO strategy for better results.

There’s more!

SEMrush Dashboards

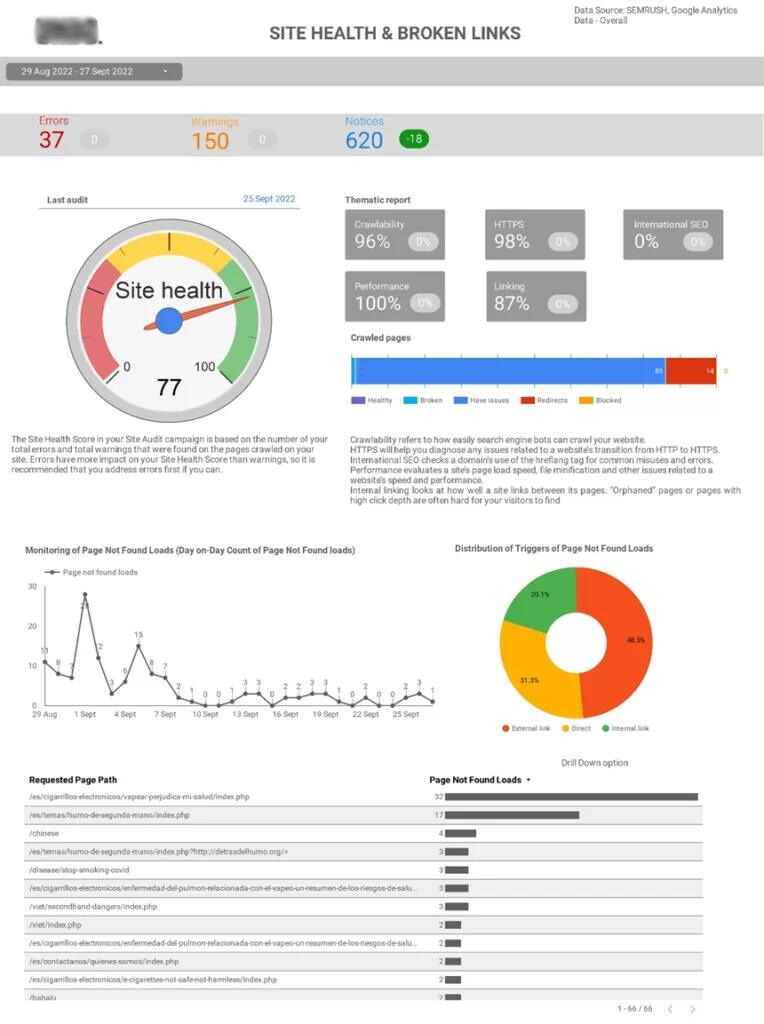
Measuring and tracking your site health and broken links can be very important because it’s part of the things that are considered when search engine algorithms look for pages to rank.

The site health and broken links dashboard helps you track a handful of metrics:
  • Site Health Score: overall indicator of the health of your website based on factors like crawl errors, broken links, and technical SEO issues.
  • Crawlability: Measures how easily search engine bots can crawl and index your website’s pages.
  • HTTPS: Indicates whether your website uses a secure HTTPS connection.
  • International SEO: Checks if your website is friendly to visitors from different countries (languages, currencies, etc.).
  • Performance: Evaluates factors that can affect website loading speed, such as image size, code efficiency, and page minification.
  • Linking: Measures how well your website pages are connected to each other (identifies any lost or unconnected pages).
  • Page Not Found Errors: Tracks the number of pages that return a “404 Not Found” error when accessed.

The dashboard highlights areas where your website needs improvement, provides warnings and errors to address, and helps you track changes in your Site Health Score and other metrics to see the impact of your SEO efforts.

All of these insights guide your SEO strategy in the right direction and help you achieve measurable results.

SEMrush Dashboards

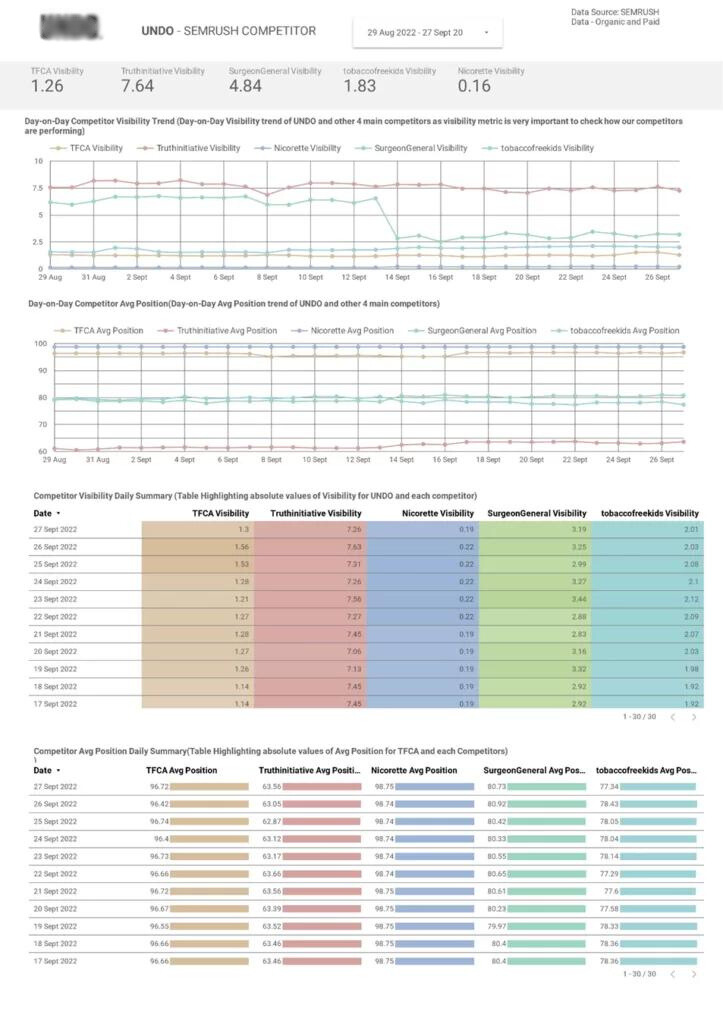
The Competitor Visibility dashboard helps you track key metrics related to your website’s organic search presence compared to your competitors. With it, you can track metrics like:

  • Visibility Score: This score estimates how well your website ranks for organic keywords across search engines.
  • Average Position: This metric shows the average ranking of a competitor’s website across all tracked keywords.

This dashboard helps you understand how your website stacks up against your competition in organic search.

You can see how your website’s Visibility Score and average ranking for organic keywords compare to your top competitors and monitor how your website’s visibility and your competitor’s visibility change over time (Day-on-Day Competitor Visibility Trend Graph).

The insights from this dashboard help you benchmark your progress against competitors over time and adapt your SEO tactics based on competitor behavior.

These dashboards are only examples of what’s possible with SEMrush and our professional dashboard services.

We can build a custom SEMrush dashboard just for your business, tracking the important things you need to know improve your SEO.

KPIs to Track on a SEMrush Dashboard

This is a non-exhaustive list of some important KPIs we can help you track on your SEMrush Dashboard:

  • Organic Traffic: Number of visitors arriving through organic search.
  • Organic Keyword Rankings: Positions of target keywords in search results.
  • Backlinks: The number and quality of links pointing to your website
  • Competitor Analysis: SEO performance comparison against competitors.
  • Top Pages: Best-performing pages in terms of traffic and engagement.
  • Site Health: Overall health score indicating potential technical issues.
  • Visibility Trends: Changes in search engine visibility over time.
  • Bounce Rate: Percentage of visitors who leave the site after viewing one page.
  • Conversion Rate: Percentage of visitors who complete a desired action.
  • Average Session Duration: Average time spent by visitors on the site.
  • Domain Rating: Overall strength and authority of your domain based on backlinks