
Eugene Lebedev is a Power BI consultant by background. Before founding Vidi Corp in 2021 he created Power BI reporting for Autodesk. His Power Bi reports were used by VPs of Finance and C-suite of Autodesk. As part of Vidi Corp, Eugene created dashboards for Google, Teleperformance, Delta Airlines and 200+ clients worldwide.
Transforming your data, so you can conquer your business goals. Specialists in – Data Analysis, Power BI, Google Data Studio, Tableau.
Power Query has powerful functionality tools that allow users to sort and transform their datasets, making them usable and easy to analyze.
If you’ve just started learning Power BI, Power Query is one of the most important things for you to learn. It’s where all the data transformation happens, and this is where you can make the data easy for you to work with so it doesn’t take much time for you to produce data visualization. Note that the goal of this video is to show you all the different functionality within Power Query, how it’s grouped together, and how you can easily find it when working. By the end of this video, you will be able to use the data transformation steps shown and other Power Query functionality tools to report your data.
In the steps below, you’ll learn about the various functionalities in Power Query and how you can apply them to your dataset.
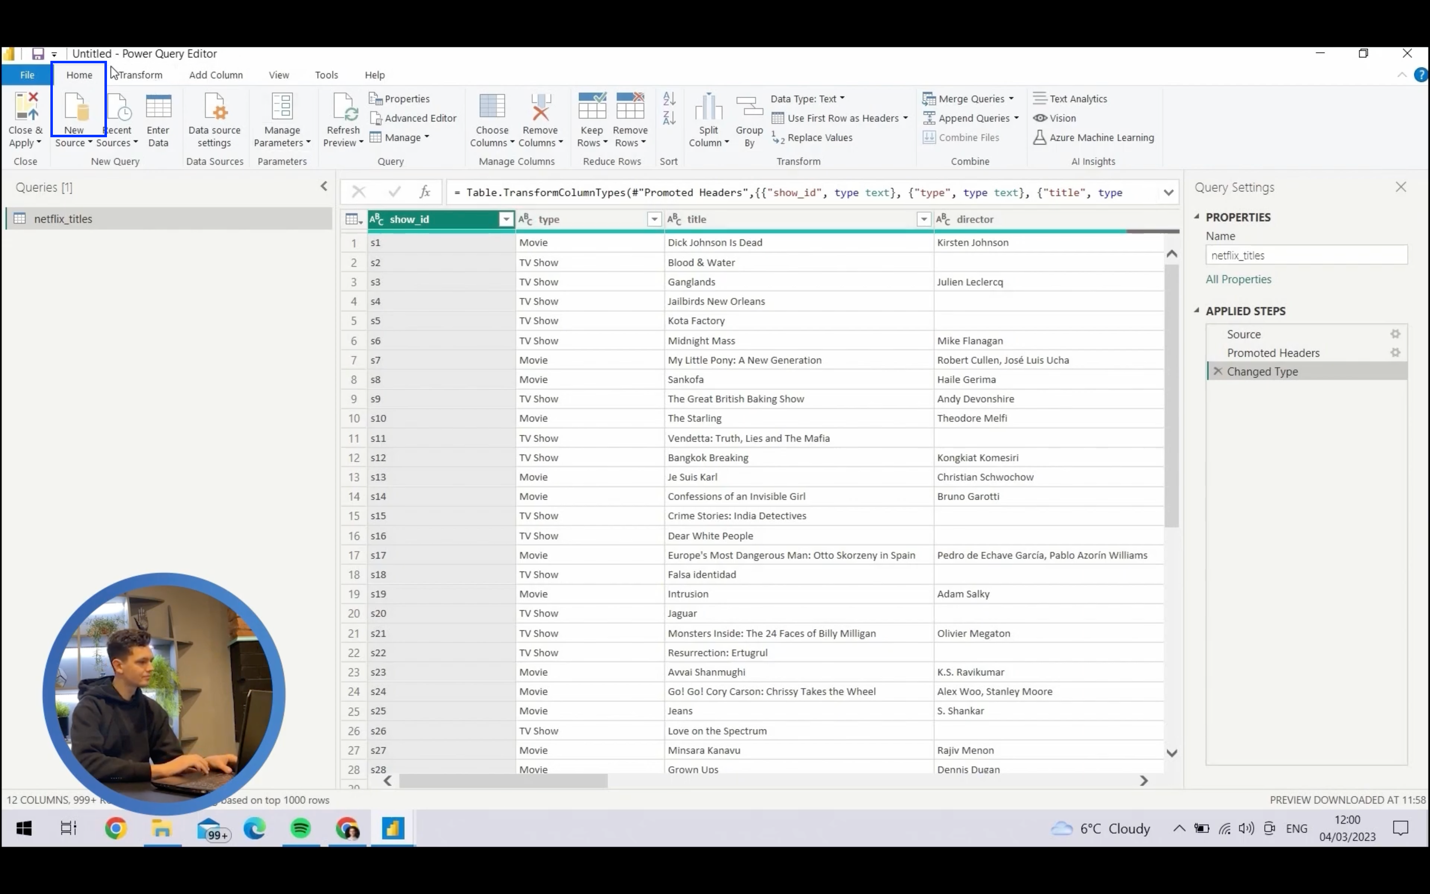
You need to navigate to Power Query, and you can do it in multiple ways within Power BI. If you open your Power BI file, you can either click “Get Data”.
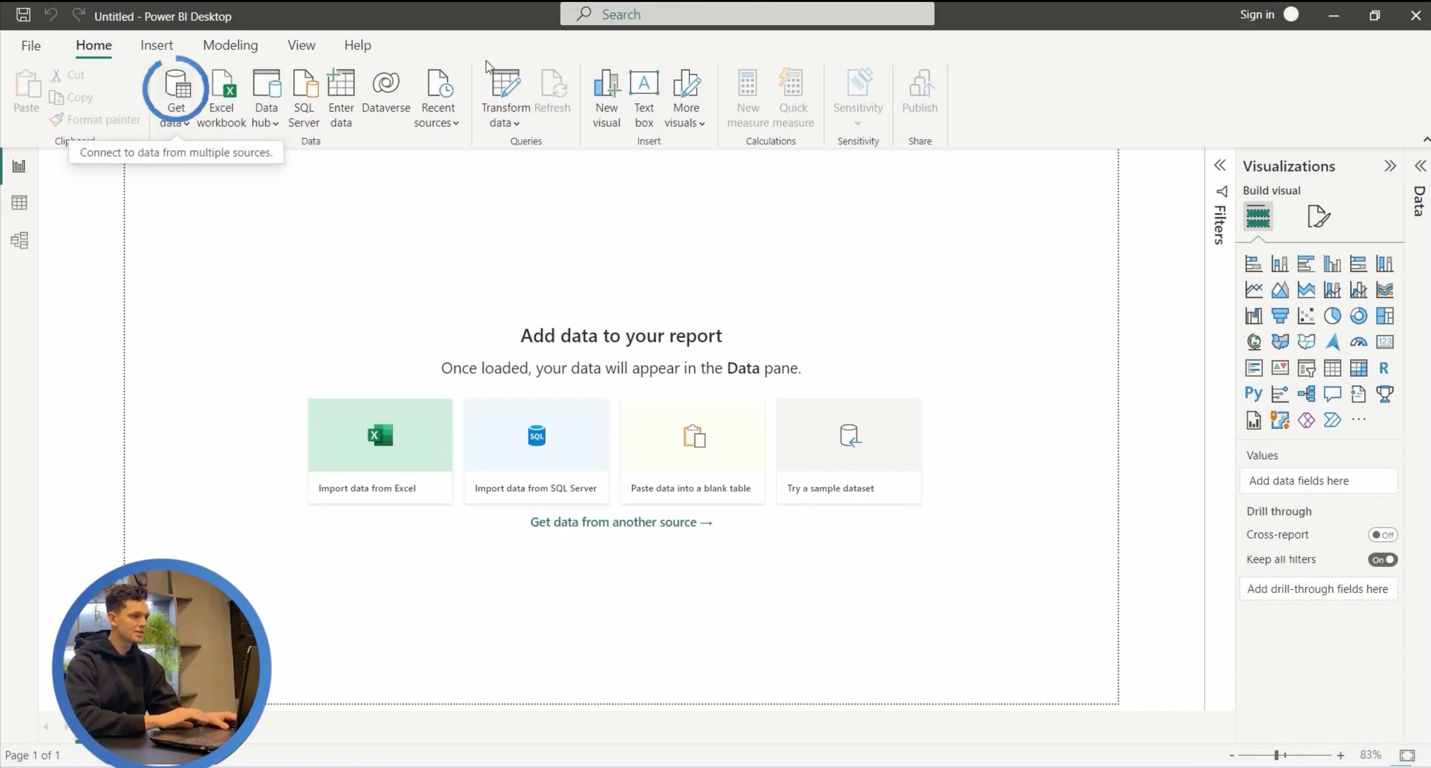
or “Transform Data”
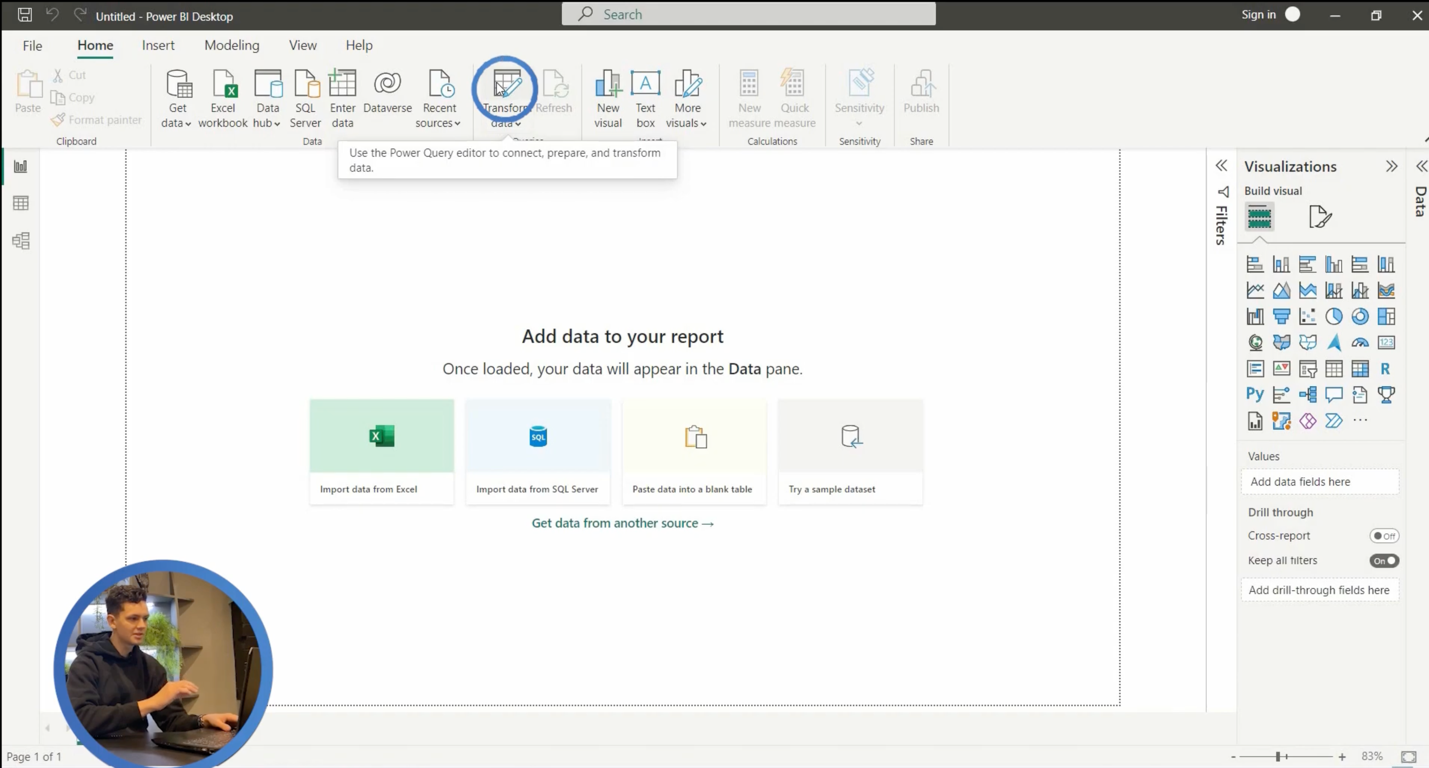
If your data is already loaded into Power BI. However, what we are going to do is click “Get Data,” and now Power BI is going to give us a list of data sources it can work with. We’re going to be using the Text/CSV connector and that’s what we’ll click.
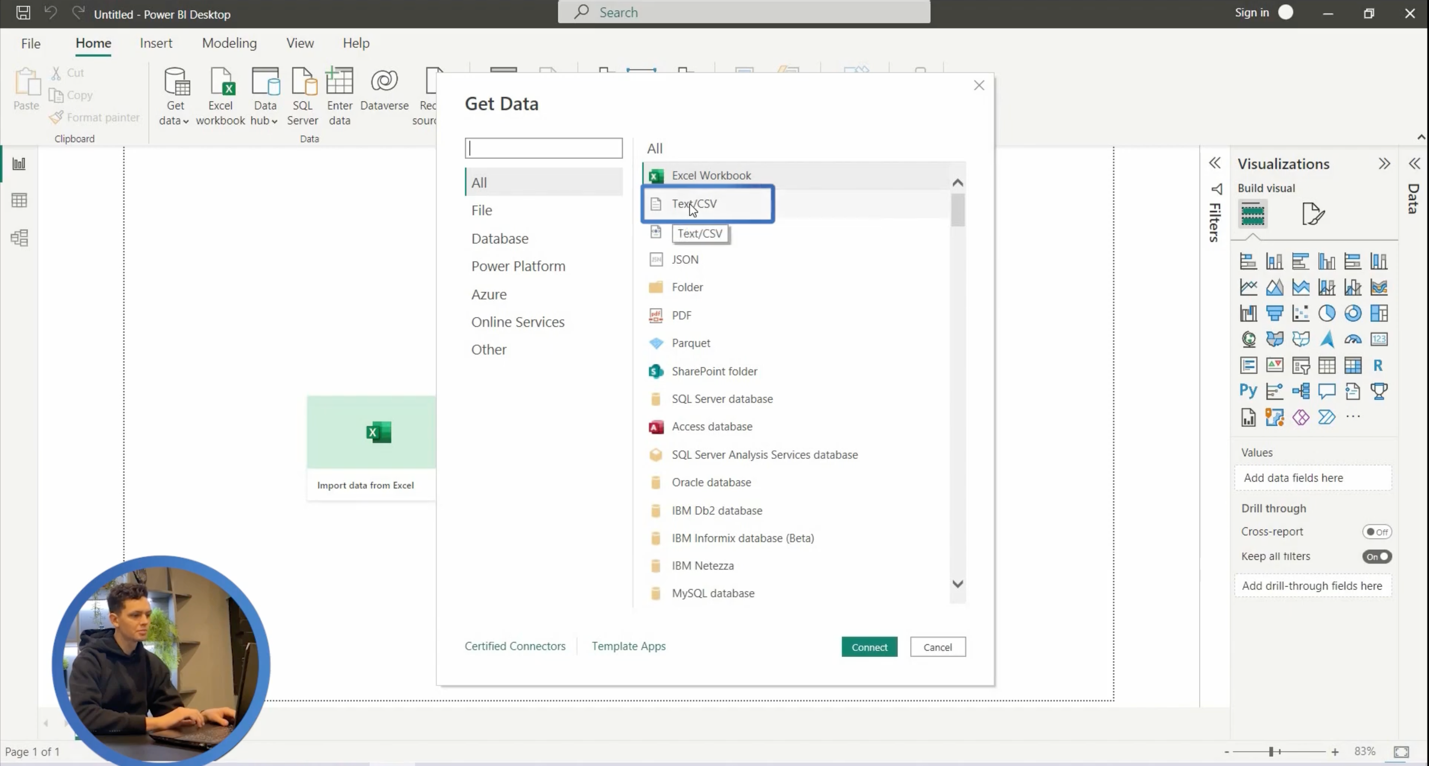
Netflix titles in our dataset. We are using the Kaggle Dataset solution to get this as it enables users to get any datasets they need to use. It’s public and free to download.
https://www.kaggle.com/datasets/shivamb/netflix-shows
Now, we are going to click the “Netflix titles” and load it to our Power BI file. And this is going to be the window that gives us a preview of our data. However, instead of loading it, we’re going to transform the data, and this will take us to Power Query.
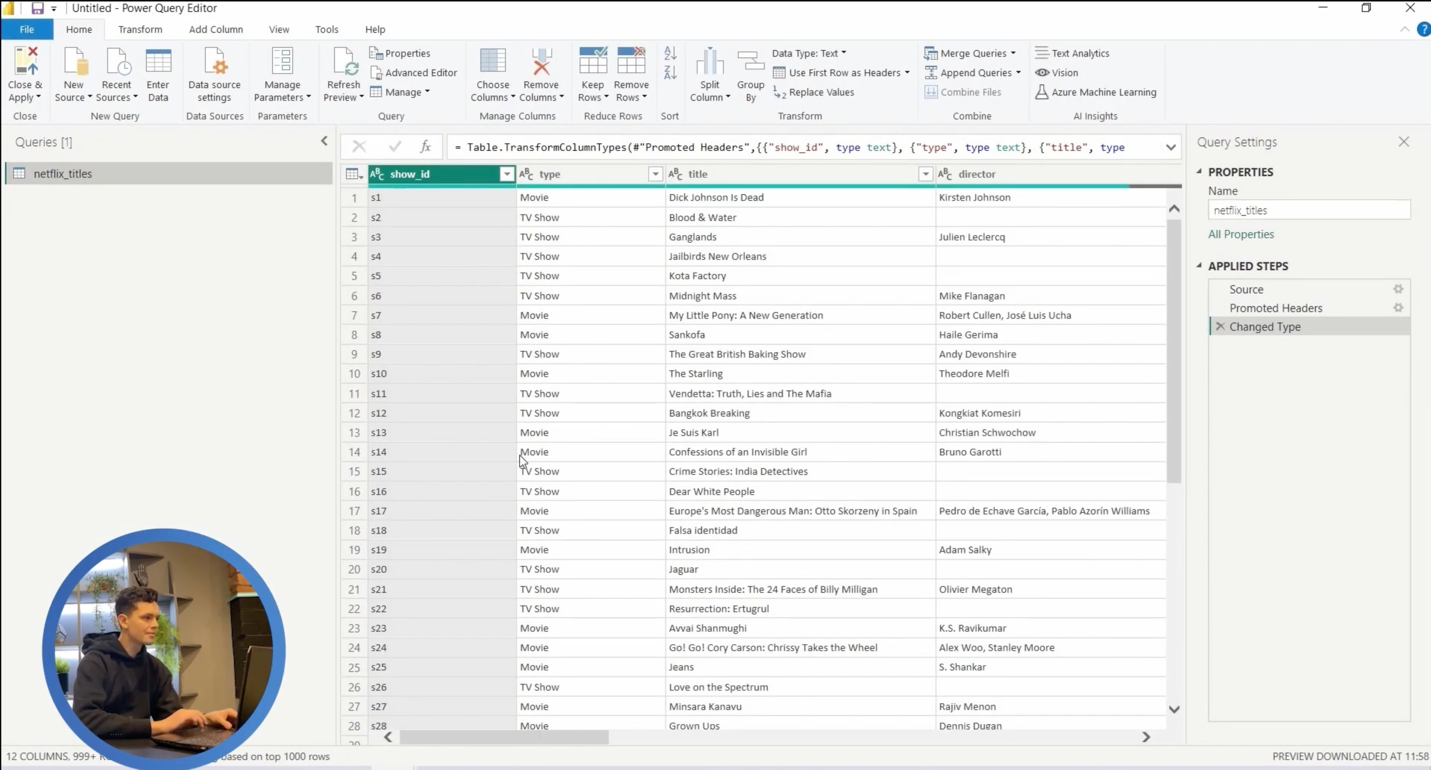
So, this is where all the work will be done in this video tutorial.
Before we go on, let’s see all the different menus and different sections of the screen that you need to understand.
Note the section on the left showing you queries. Under it, you will find all the tables you’ve loaded. In the middle, you will find a preview of all the data, and you can scroll horizontally or vertically to get a feel for what your data looks like.
The section on the right has Query Settings, Properties, and Applied Steps.
Yes, this is to maintain the first character in upper case as it is with “Seasons”. Consistency is important. Now, click OK,” and it’s replaced as shown on the screen.
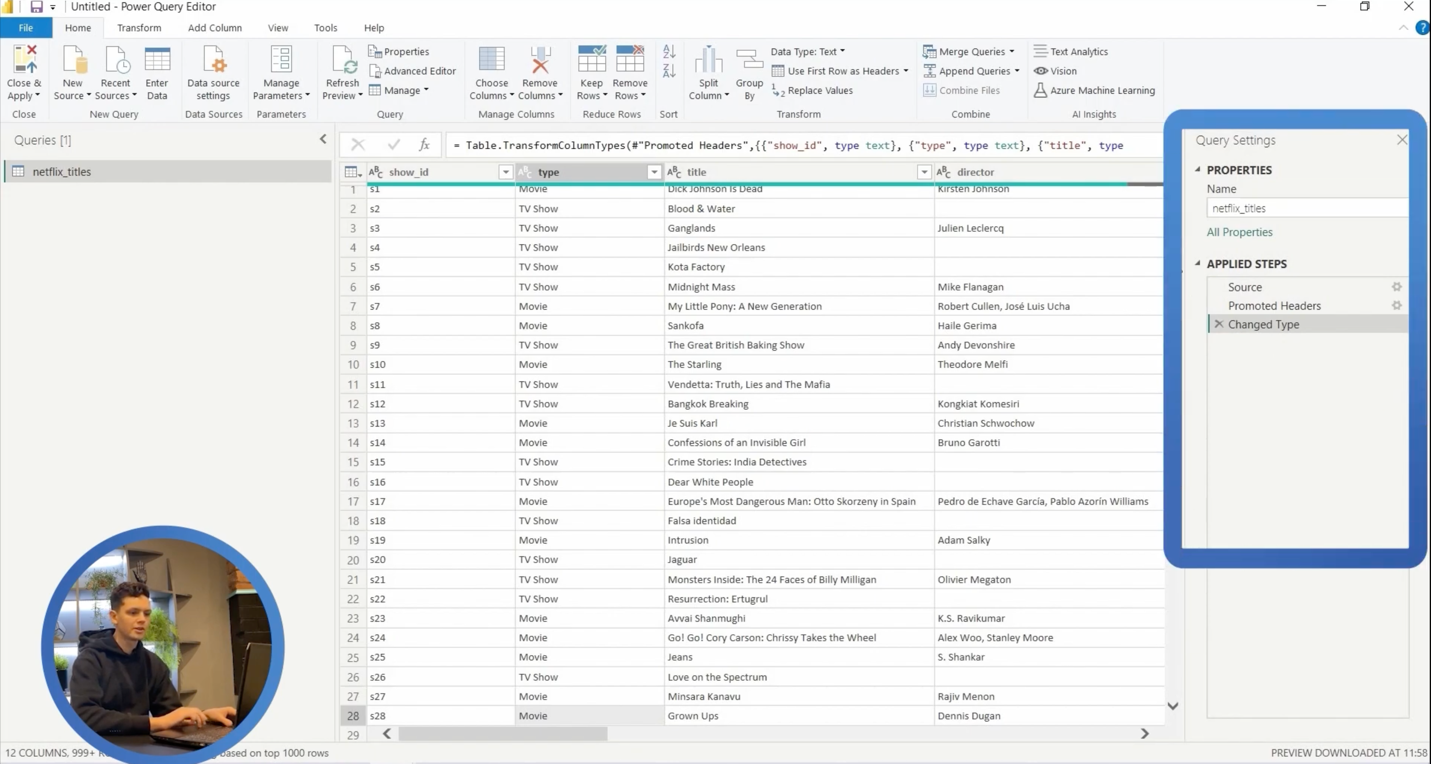
For instance, “Applied Steps” will show you the different steps that you have applied to transform your data. You can click ‘Source’ under “Applied Steps” and other options to go back and see what happened to your data as you transformed it.
Then, we’ve got the top menu bar section, which we categorize as ribbon. These sections group data transformation functionality together.
In this category, there are “home”, “transform”, “add column”, “view”, “tools” and “help”.
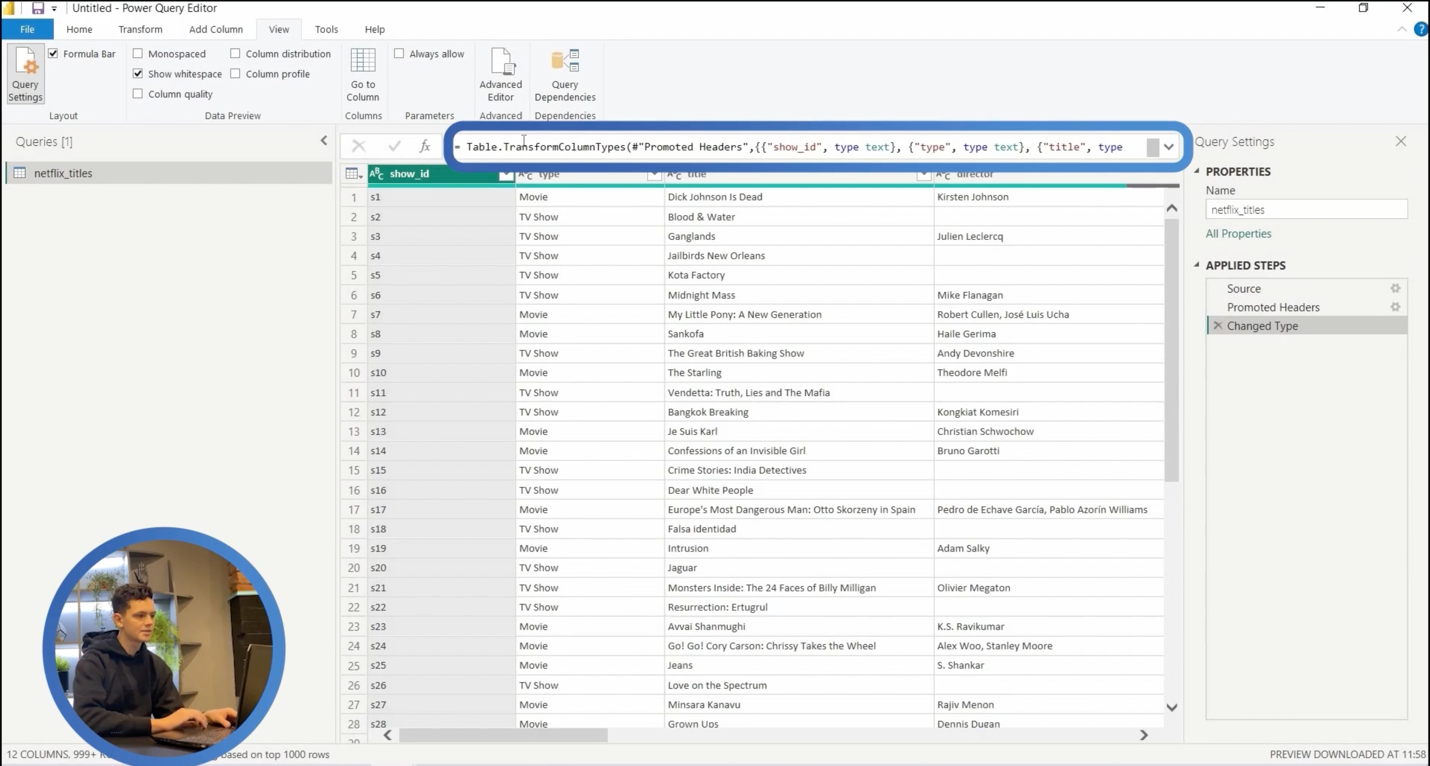
Under the “View” section, we can control what we see inside Power Query. For example, we can control whether we want to see the formula bar, and this shows us the text—you know, the actual formulas. The formulas in the Power Query are done in a programming language called “M”. You rarely use this language, but it’s useful to know that it exists.
Another thing is where you see column quality, where it shows you whether you’ve got any blanks or errors in your data. Then there’s the column distribution to see. For example, we can see movies versus TV shows. We also have a column profile, which is sort of like a column distribution but gives you a more detailed view.
Now, let’s go back to the home section on the ribbon to explain some of the functionality.
To see how you can optimise your reporting with Power Query, make an enquiry here.
On the left is where you control what tables you’ve got in your file. That’s not our priority, so let’s focus on the sections by the right.
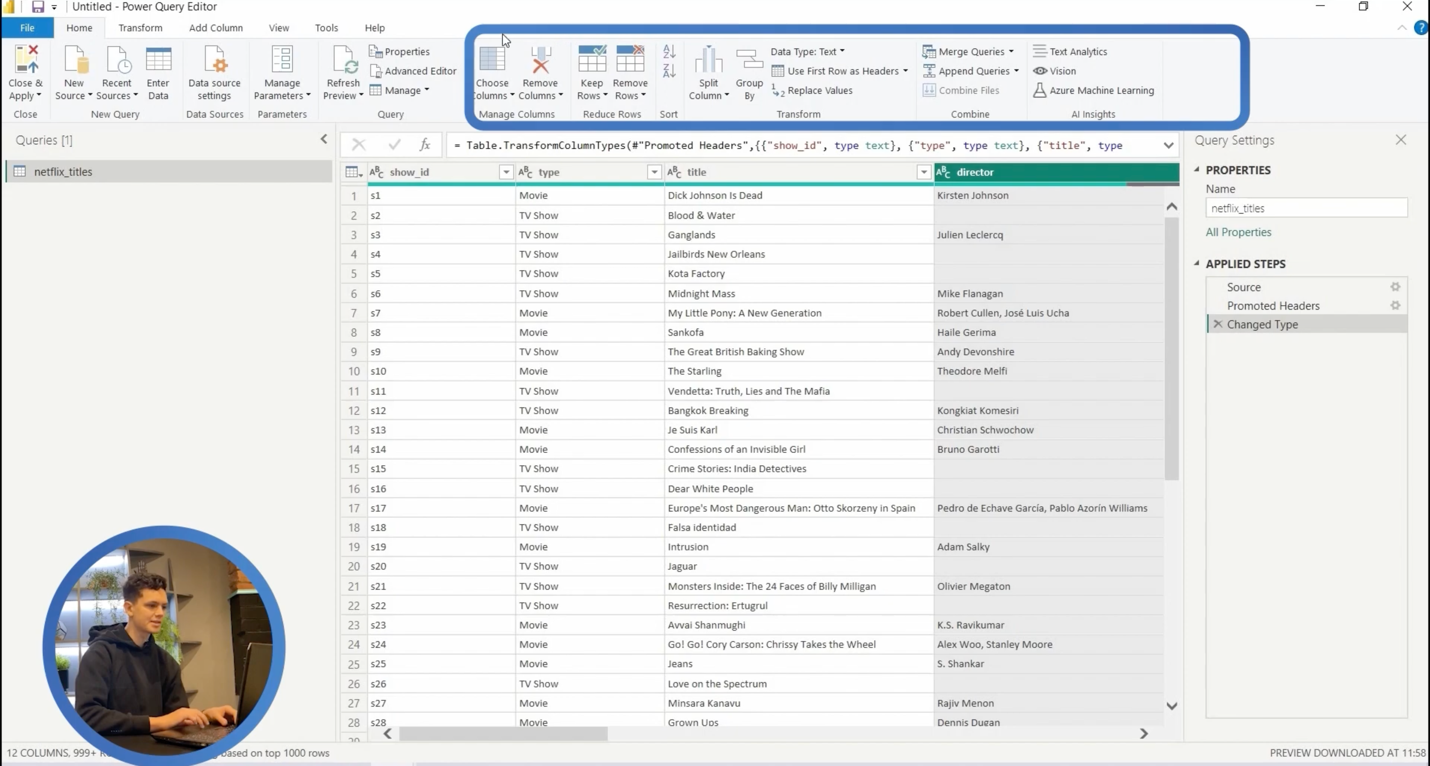
The first thing you can do is “Choose columns” to load into your Power BI files.
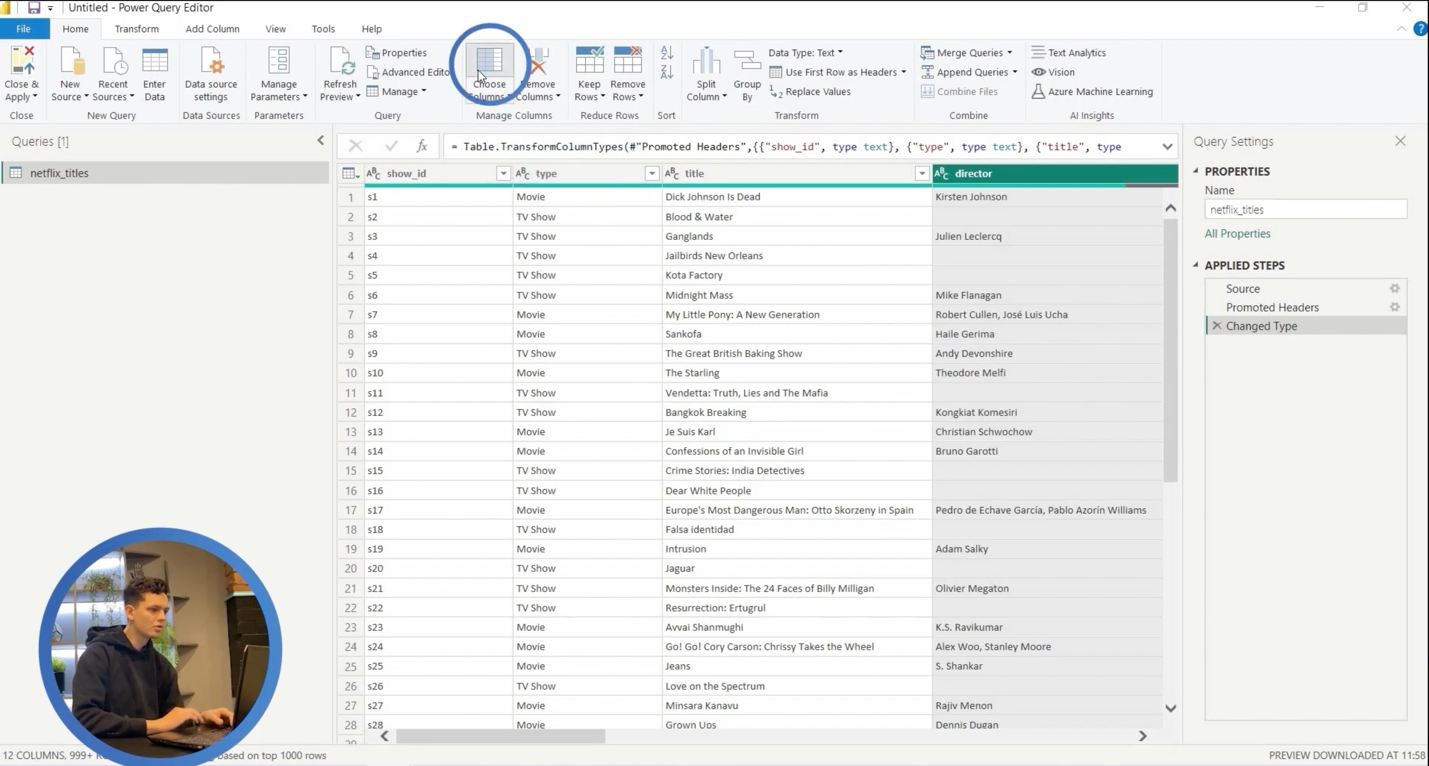
Essentially, this gives you the chance to delete the columns you don’t need. For example, if you decide that you don’t need cast, description, or rating, you can unselect them and click “OK,” and those columns would no longer be in our datasets.
Notice that a new step was added, ‘Removed columns’. This is the step that deletes our columns. We can delete this step so that we can just go back. The alternative to that is to select which columns to remove. Here, I have selected the director column and clicked “Remove column.” With this, you can select multiple columns by holding the Ctrl key and clicking on “cast”. This shows that multiple columns have been selected, and then you can click “Remove column”.
The next thing you can do is decide whether to “Keep rows” or “Remove rows”.
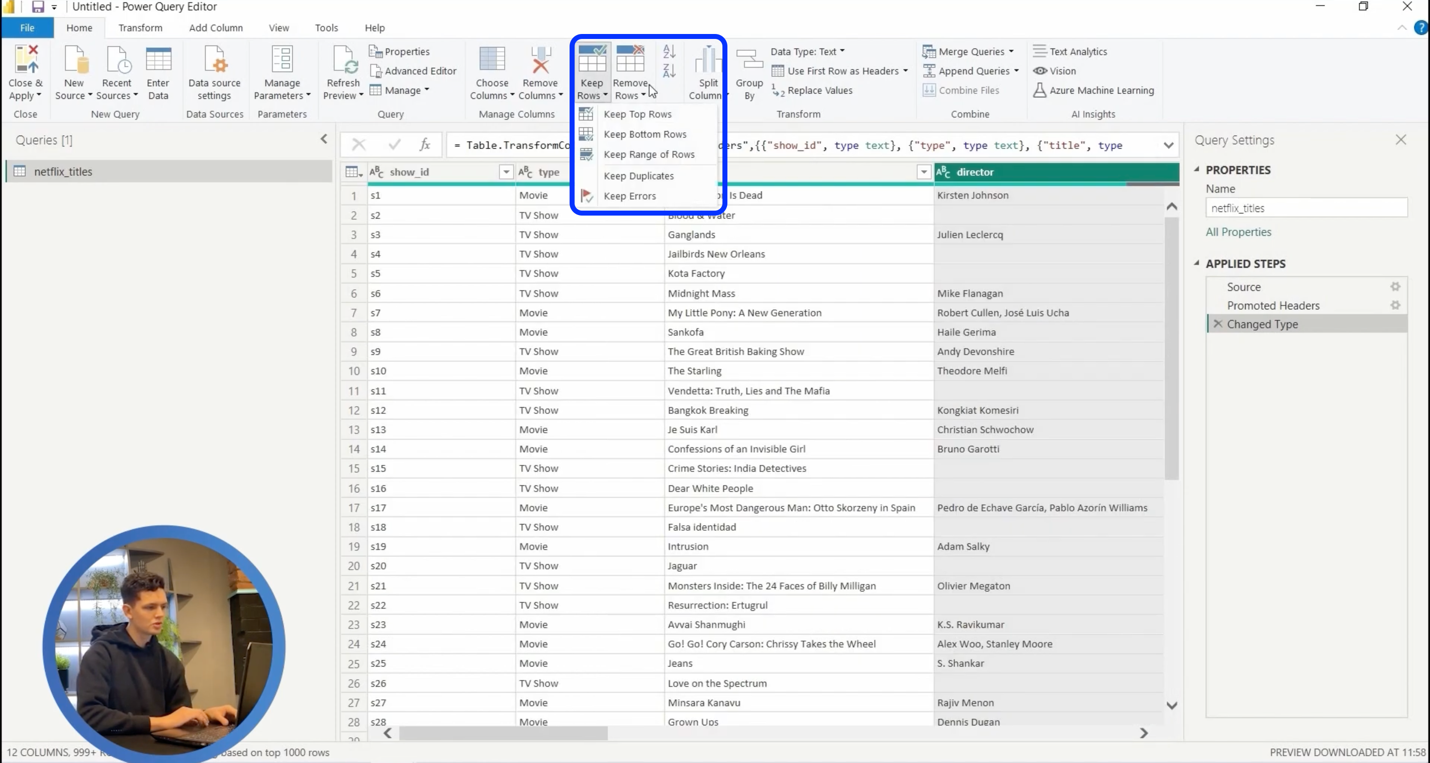
For example, under “Remove rows”, you have a drop-down menu from which you can ‘Remove errors’ or ‘Remove duplicates’ and you can decide to ‘Keep errors’ or ‘Keep duplicates’ under “Keep rows,” depending on your use case. While that may not be useful for this data, what is more important is knowing how to filter.
We’ll go to the arrow by the “director” column and then select “blank” from the list, and now click “OK”. The result is a filter icon in the column.
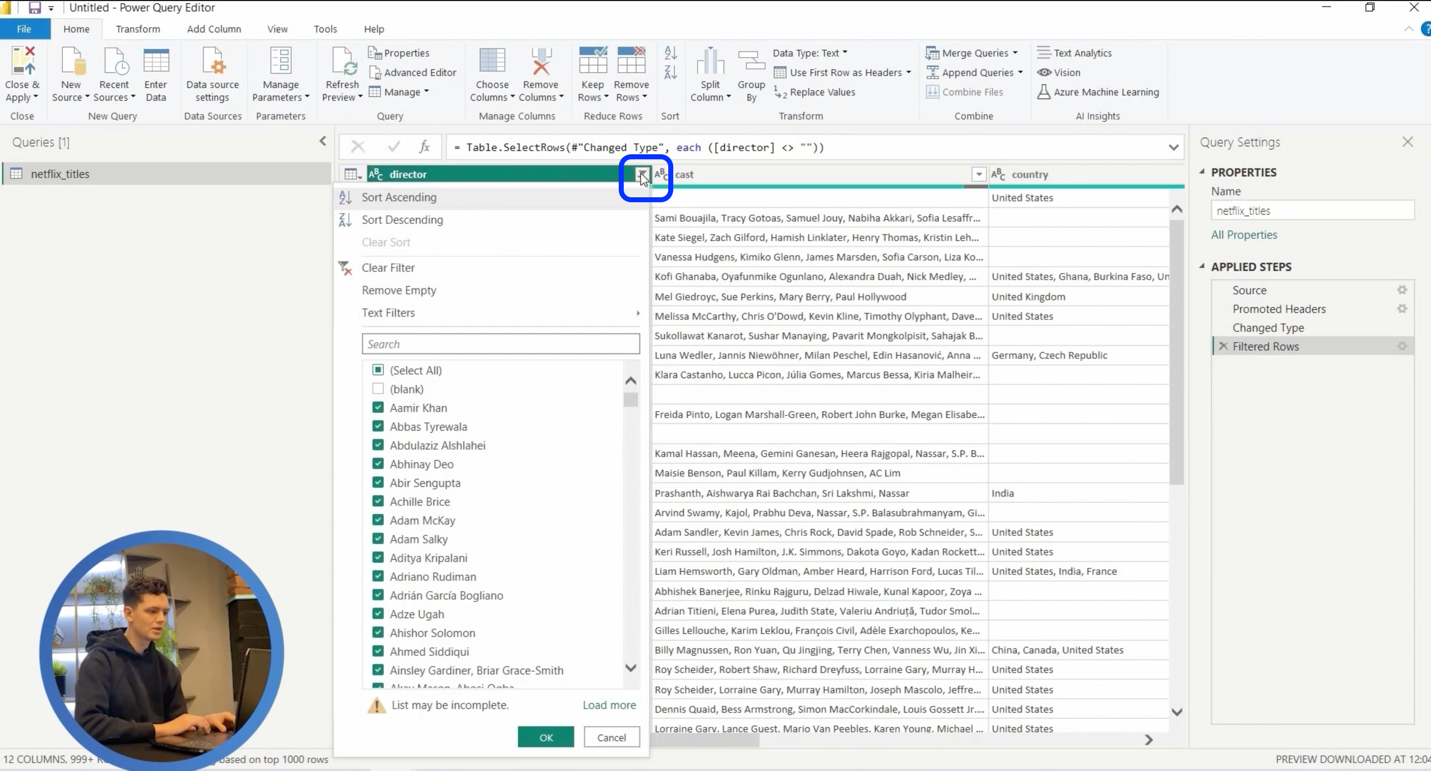
So, we can remove this filter again by clicking “Clear Filter” under the options provided as we click the filter icon.
Another functionality you can use is to “Sort out columns” alphabetically.
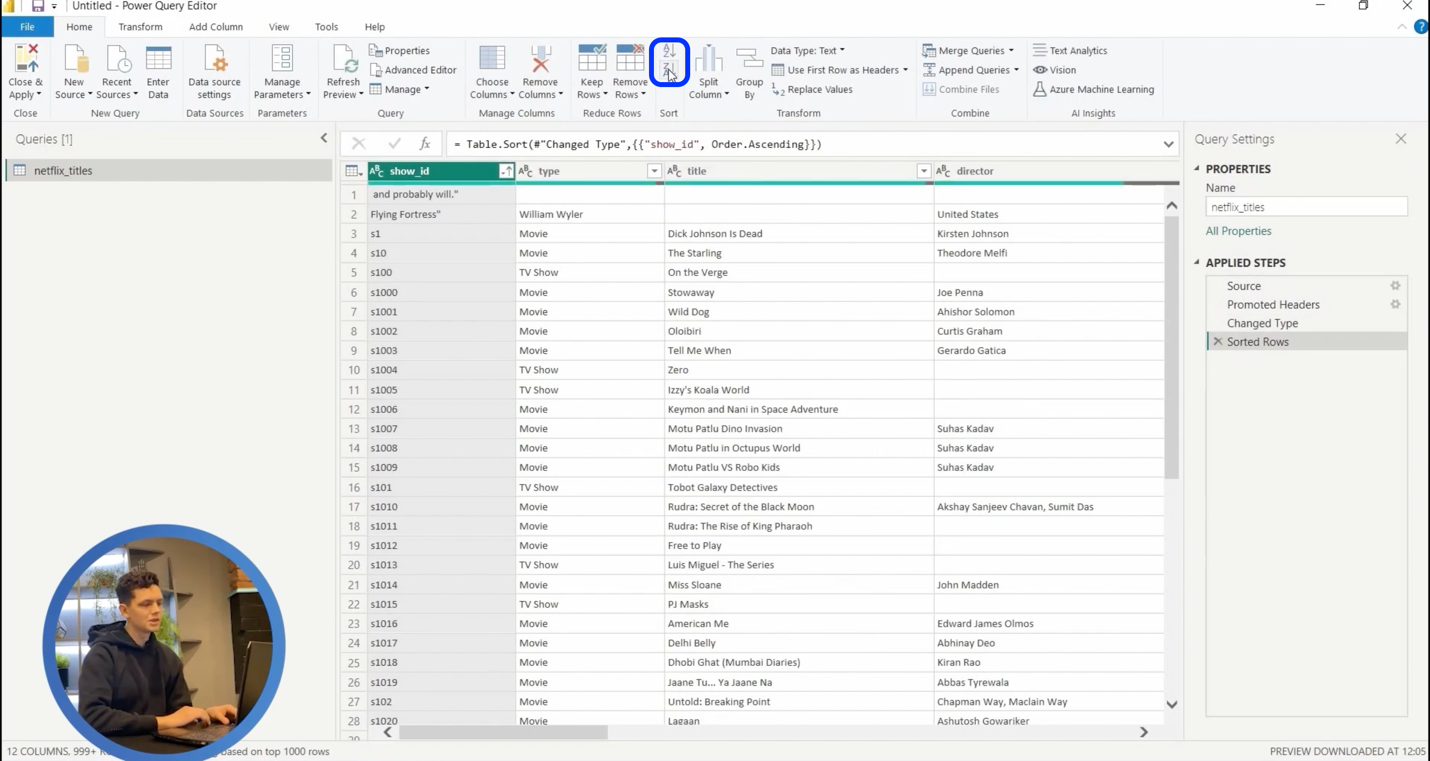
This can be done in ascending or descending order as the case may be, from the ribbon menu.
Meanwhile, if you look carefully, you will notice that there are some data problems in our dataset. The two rows at the top are not showing the expected data format. As you can see, we have the country name in the “directors” column and the date in the “cast” column. As it is a mistake, we need to remove the first two rows.
To do this, click “Remove rows” from your top menu and select “Remove top rows”.
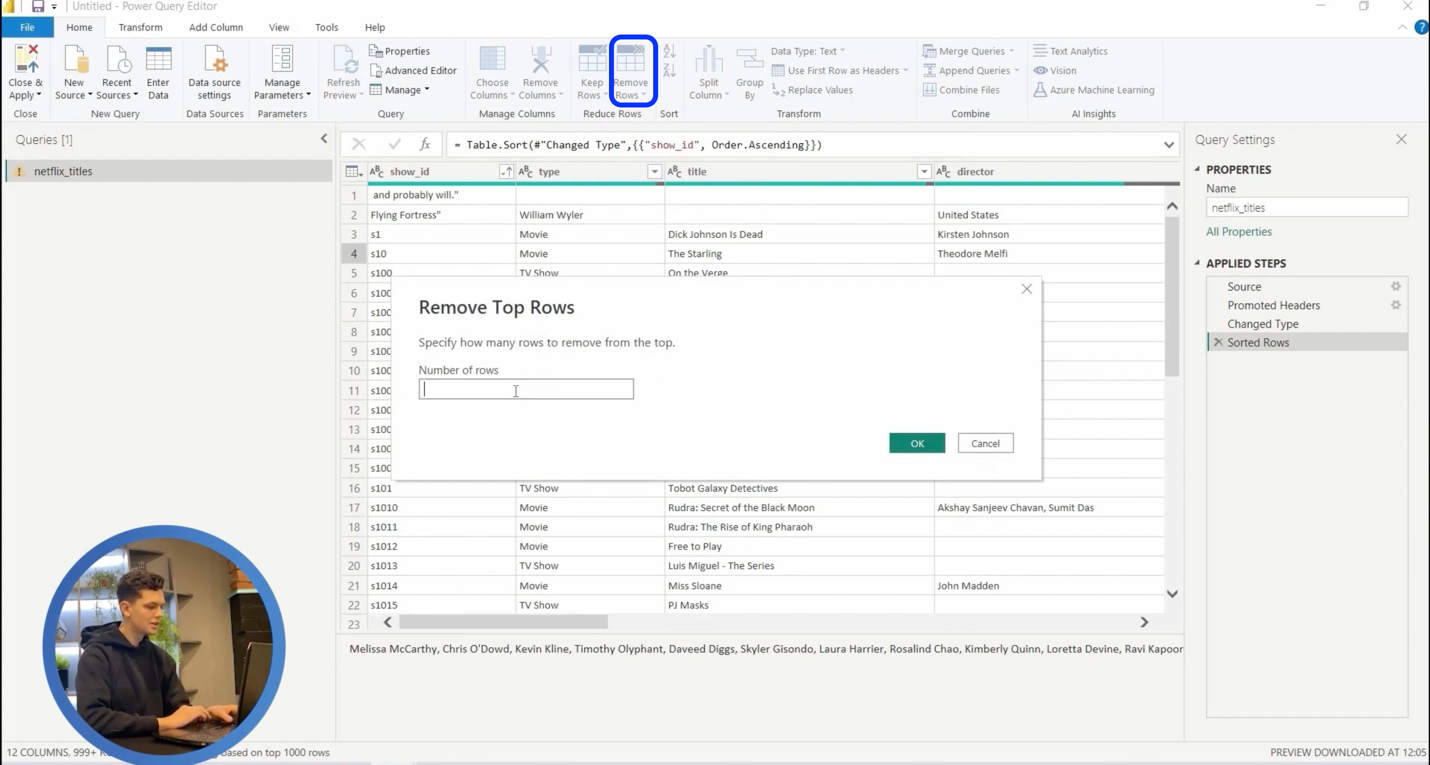
Type “2” into the box provided and click “OK.” Well, we’ve taken the noise out of our data.
Split Columns
The next functionality we are looking at is the “Split columns”.
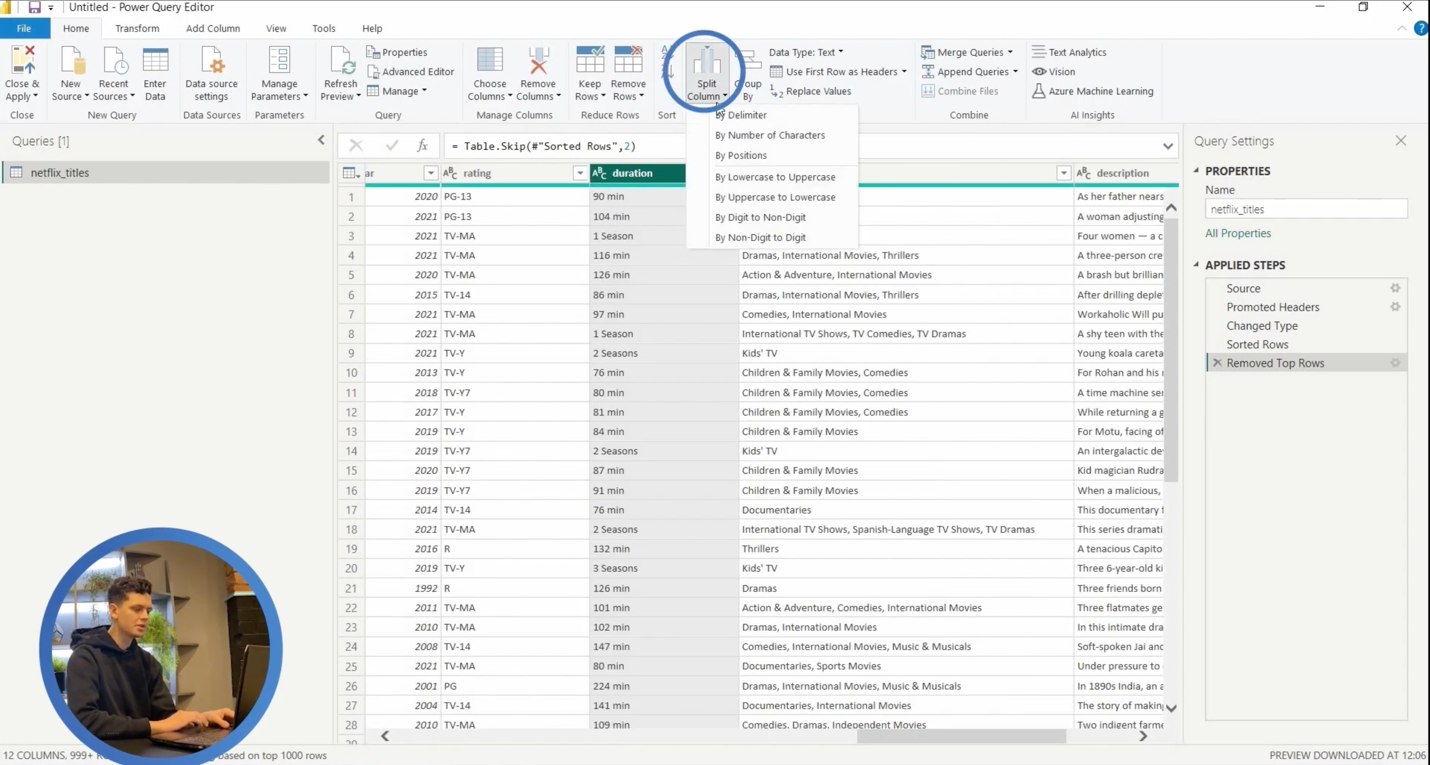
Once clicked, you’ve got options to select from to split your column based on the different kinds of conditions, whether it’s ‘By Delimiter’, ‘Number of Characters, ‘By Positions’, among others. The first three are the common ones you need to use.
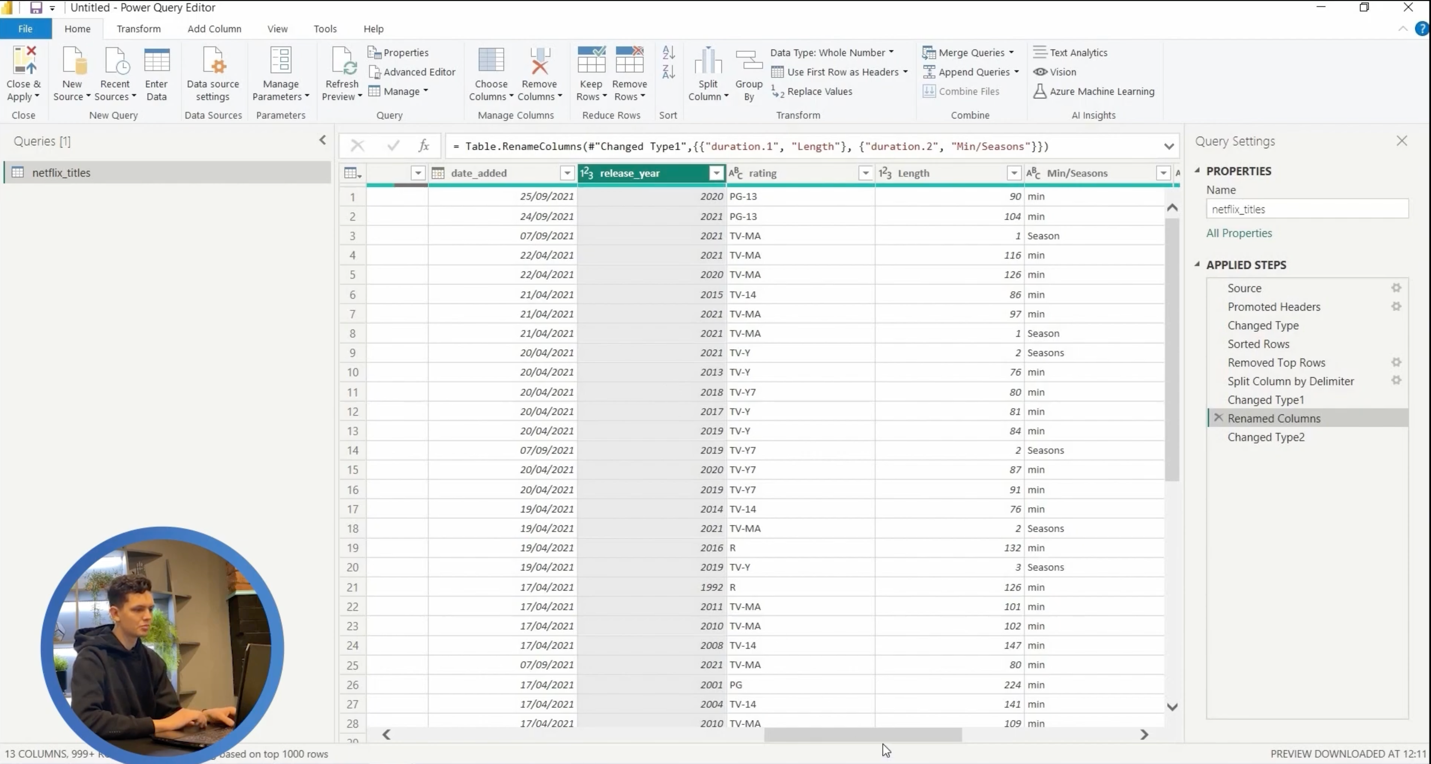
Let me walk you through a demonstration of how it works using the column labelled “Duration”. So, let’s select ‘By Delimiter’ under “Split Column”. Splitting “By Delimiter” is going to be a specific symbol—either a comma, a space, an equal sign, a tab, etc.
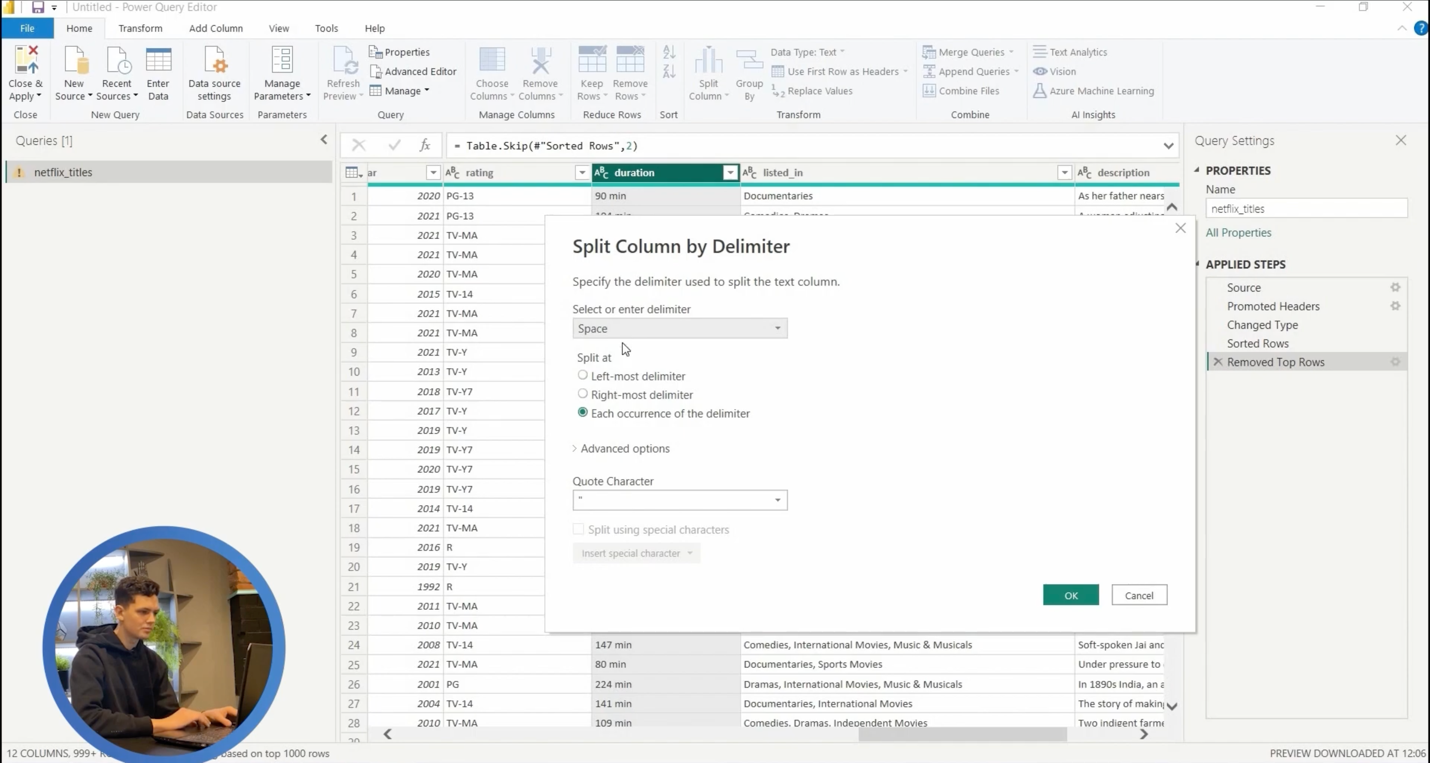
Next is selecting whether you are splitting at ‘left-most delimiter, ‘right-most delimiter’ or ‘each occurrence of the delimiter’. We have selected the last option, and then we’ll click “OK”. Yes, we now have two columns for duration—one to the left showing the number column and the other one to the right showing the text column. Now, let’s rename the one on the left ‘Length’ and the one to the right ‘Minute/season’ to make them more descriptive.
The next thing I want to show you is how to assign data types in Power Query. You can see this functionality in the top ribbon, and you can select the columns you want to assign data types to.
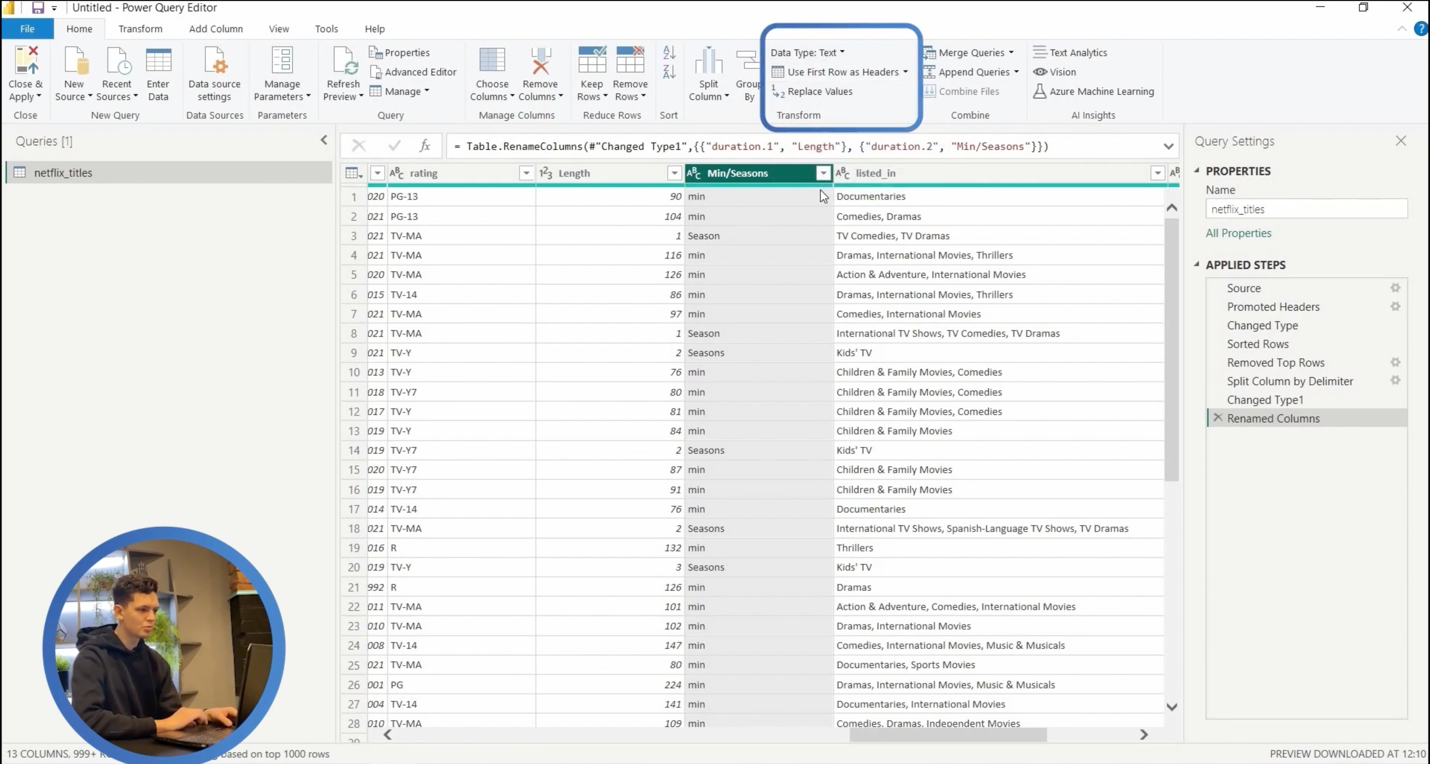
Note that your data type can be a decimal number, whole number, percentage, date/time, duration, text, etc. Let’s say you want to change the release year from a number to a text. So, select the “release year” and click “text” from your data type, and the data icon changes from number (123) to text (ABC).
Essentially, the data icon tells you whether your data is in text or a number. We’ve also got the calendar icon representing the date. Kindly note that they are going to be the most frequently seen icons within Power BI.
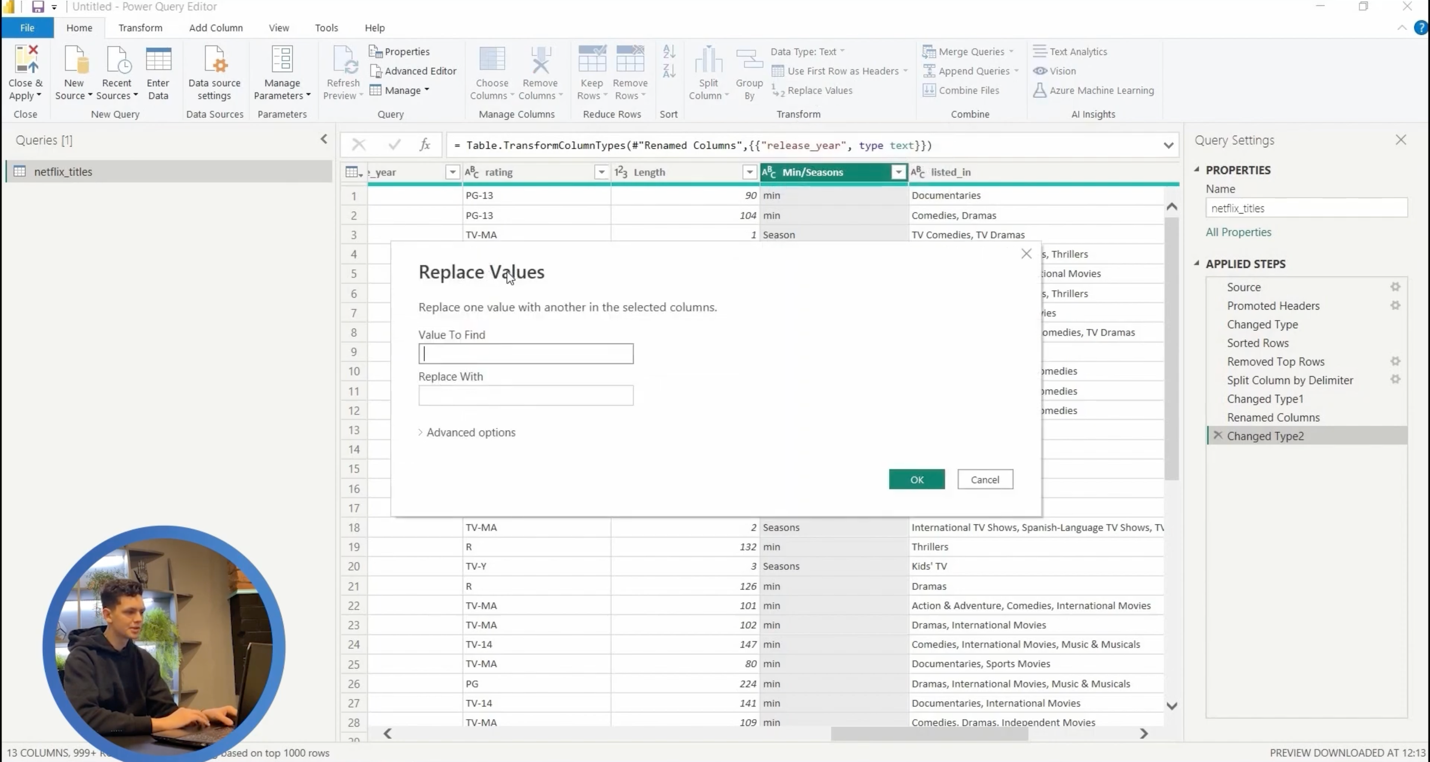
The next functionality you need to know is how to replace values. So, if you select Minute/Seasons column, and go to “Replace values” on the top ribbon, boxes will pop up with prompts labelled ‘Value to find’ and ‘Replace with’.
What we want to change in your “Minute/Seasons” column is to find ‘m’ and replace it with M.
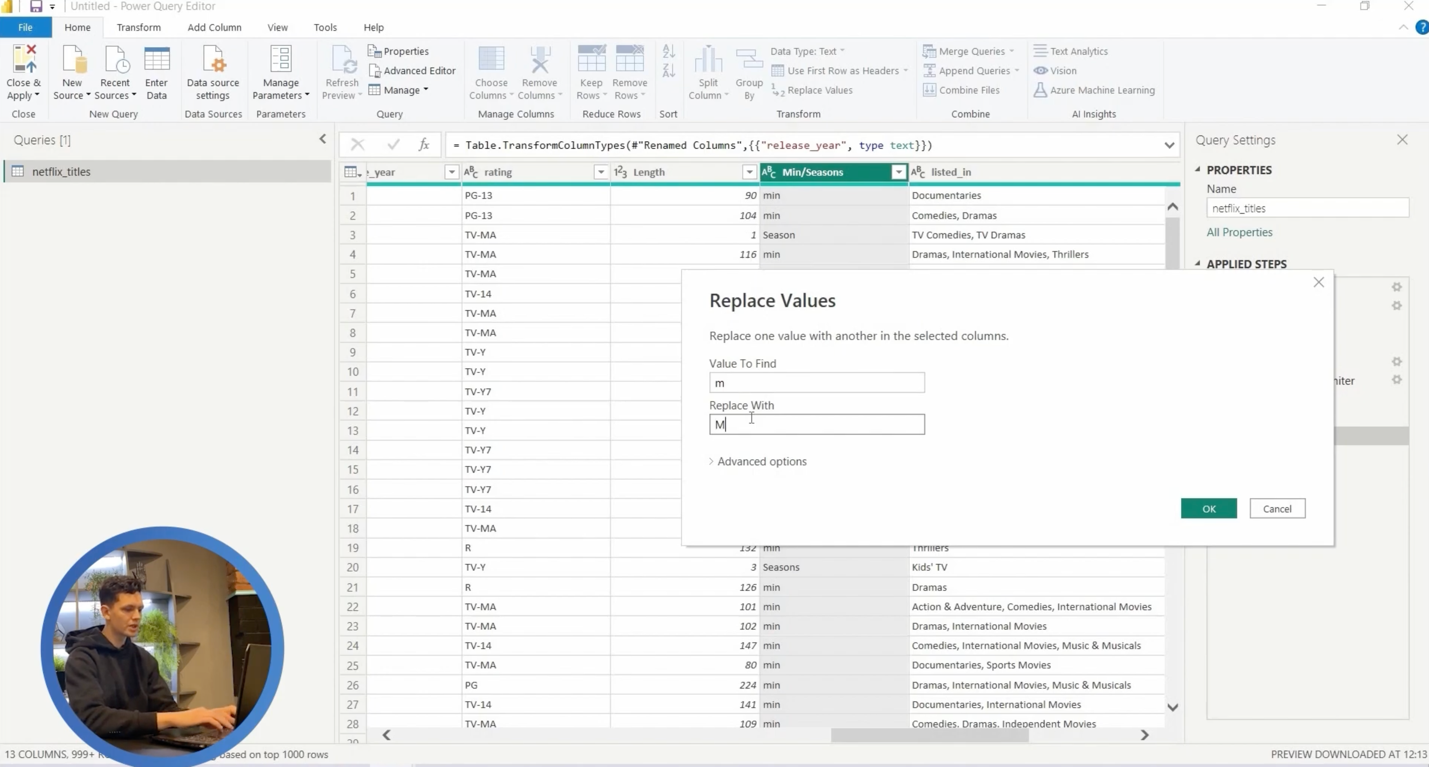
Yes, this is to maintain the first character in upper case as it is with “Seasons”. Consistency is important. Now, click OK,” and it’s replaced as shown on the screen.
What an amazing set of functionalities to work with in Power Query! One other Power BI functionality tool you should understand is the Merge Queries, Append Queries. But they are a little bit trickier and require more time to explain. Rest assured, I will do another tutorial on data transformation steps using Power Query. Stay subscribed so you don’t miss out. I hope you enjoyed this tutorial. Kindly hit the like button and the subscribe button. Turn on your notifications so you don’t miss any updates.
Meanwhile, if you have questions or inquiries about the functionality tools we have learned and applied so far, feel free to drop us a message, and my team and I will be happy to guide you.
![]()
![]()
![]()