
As a Power BI consultancy firm, we have worked with dozens of CPAs. We’ve seen many use cases of Power BI for accountants, and several recur regularly in our practice.
In our experience, Power BI is especially useful for accountants that provide fractional CFO services. Financial reporting is a big part of these services and Power BI helps to automate and improve reports.
Power BI is also valuable for internal accountants, providing high-quality reports to executives that uncover insights and support better decisions
In this article, we’ll share the top 8 ways accountancies use Power BI to improve their business processes, based on our experience.
Before we dive into use cases of Power BI for accounting practices, it is important to understand what Power BI is designed to do. Make sure you’re using Power BI for its intended purpose—not for every data task that comes to mind.
Firstly, Power BI is designed specifically for descriptive data analytics and reporting. Accountants often use Power BI to create data tables and graphs to report to analyze the financial performance of their clients.
Secondly, Power BI can automatically extract data into your data analytics reports and schedule refresh. You can use Power Query inside of Power BI to connect to your data sources in a couple of clicks and automate the data transformation steps.
If you want to know more about Power BI, please refer to our free guide.
Many accountants spend a tonne of time on manually extracting data from financial data sources. The more clients you manage, the more time you have to spend on manual data extraction. However, you can automate this process fully with Power BI.
Power BI has a native integration with 250+ data sources like Business Central, Anaplan and Dynamics which means that you can connect to them without writing any code. In practice this means that you can use the “Get Data” menu inside Power BI to select your data source and create a direct connection to tables that you want to extract. You can then press the “refresh” button or schedule refresh to update your reports.
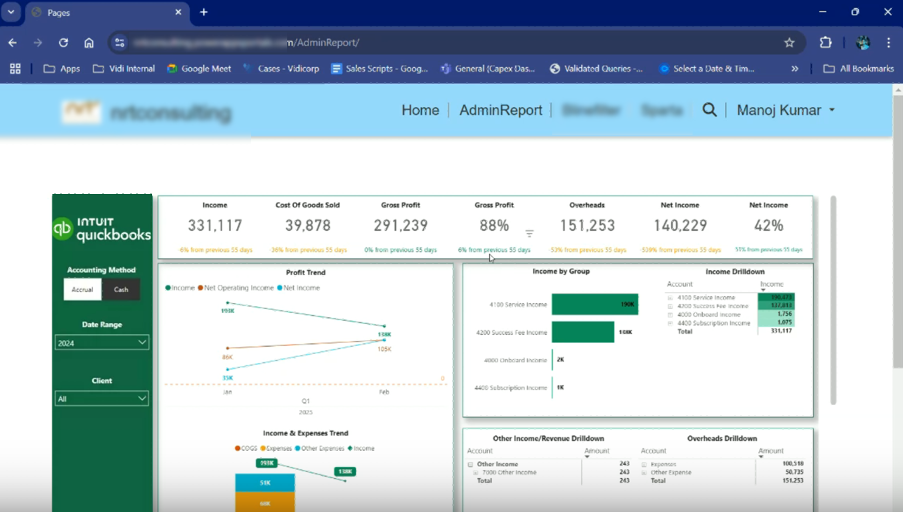
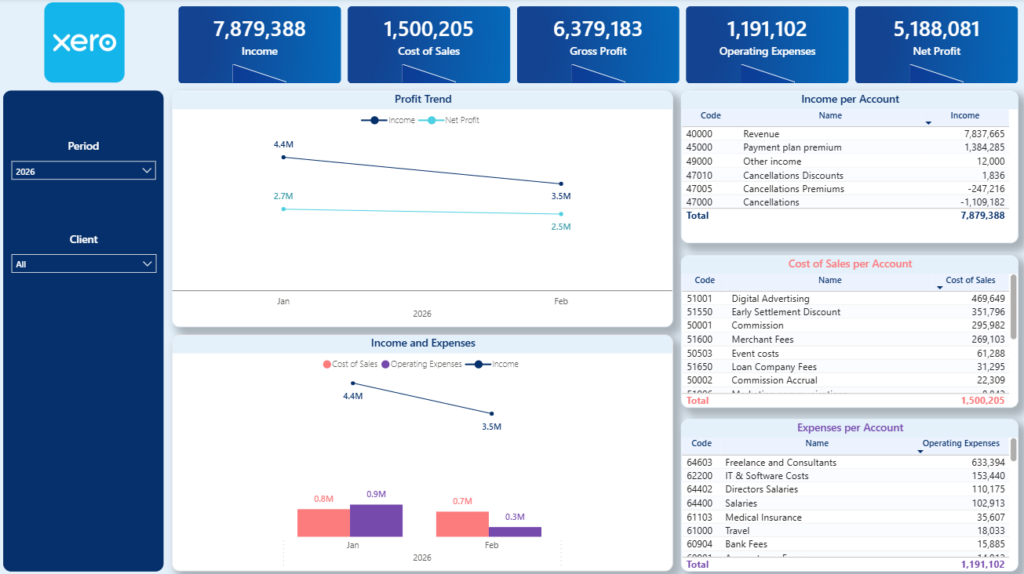
At Vidi Corp we also offer add-ons for automatically extracting the data from QuickBooks Online, Xero and Zoho Books. Those add-ons can be used to extract the data from one or multiple accounts. You can also visualise the data instantly by using our free Power BI templates.
Accountants often need to combine the data from multiple sources together to create client reports.
There are plenty of clients who have their data in multiple QuickBooks Online accounts rather than one. For example, real estate firms often have one QuickBooks Online account per property and retail businesses have one account per outlet. A Power BI QuickBooks Online integration helps to combine the data from multiple accounts together without complex data modeling.
Power BI also makes it easy to combine the data from multiple different sources e.g. the accounting system, CRM and supporting Excel sheets. You can merge and append datasets in Power Query or create a data model with multiple tables.
Maintaining financial reports is very time-consuming. Accountants perform many tasks manually when refreshing financial reports including:
These data tasks need to be performed manually for every client is very time-consuming if you have a large portfolio or accounts. The good news is that Power BI can automate every part of this manual process.
We have already discussed how to automate data extraction by connecting to your accounting software.
Accountants can then use Power Query to apply their data transformation steps like removing columns, replacing values, etc. As a result, these steps are applied every time that you automatically refresh your Power BI reports.
You can also automate other workflows around Power BI such as sending updates by email and exporting reports to PDF.
Some accountancies go a step further and create online portals where their clients can sign in and view their reports at any time.
This approach has several benefits:
Power BI has many forecasting features which accountants can use to predict sales, cash flow or other financial metrics.
Firstly, Power BI supports linear regression which is commonly used for time-series forecasting. The Auto-ML feature can be used to create linear regression models without writing any code. Alternatively, you can write DAX formulas for linear regression if you need more flexibility.
Secondly, many fractional CFOs perform financial forecasting in Excel and use Power BI to visualize the results. Power BI then makes it easy to combine actuals and forecast in a single report because of the data modelling features.
Finally, Power BI AI features such as the Key Influencer visual can help to explain the main drivers behind fluctuations in a certain metric. These AI features can instantly explain to clients why their revenue or expenses have changed without having to ask questions to accountants.
Instead of sharing static tables and graphs in Excel why not replace them with interactive Power BI reports? This massively improves the user experience and helps the clients to find more actionable insights in their data.
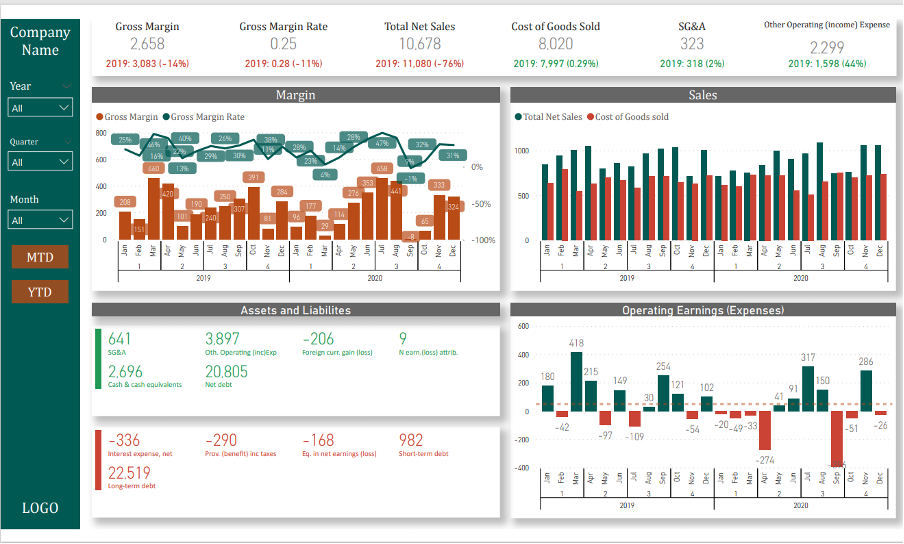
For example, all Power BI dashboards are interactive meaning that you can click one graph to filter the rest. You can experience the interactivity in the Power BI accounting dashboard above. Try clicking on a month name in the line chart to filter all the other graphs by month.
There are a tonne of other interactive Power BI features such as bookmarks, drill downs and tooltips. By using these features accountants can truly bring their financial reports to life and communicate through data very clearly.
Many accountants complain about difficulties of working with large data volumes in Excel: slow reports, files reaching 100+ MB.
Heavy Excel files are difficult to share with clients and they often crash on old laptops. Accountants can solve this problem by sharing their reports through a web platform called Power BI service. This means no more sending heavy files to clients, they can simply view reports in their browser via a link.
We also have experience in analyzing millions of rows inside Power BI. Analyzing these data volumes inside Excel would be impossible as the files would become slow and crash.
On average our clients see 4-10 hours of time savings per month when they implement Power BI. The time savings come from automating the data extraction and transformation for all the clients.
Here is a review from Stephanie Dolbek, the CEO of Angel Oak Accounting who reported saving 4 hours per month after creating automated QuickBooks Online Power BI dashboards. These dashboards automate financial reporting for 5 clients and require no monthly maintenance.
Here is another review from Michael Diamond, CFO of Leeward Management who saved 10 hours per month after automating financial reports in Power BI. These dashboards automatically pull the data from QuickBooks Online, Zoho CRM, Zoho Creator and multiple spreadsheets.
Accountants can improve report accuracy by automating data extraction and transformation in Power BI, eliminating manual errors and ensuring consistent refreshes.
For example Andy Alvarez, CPO of Modern Canabis reduced the time to prepare reports by 75% and eliminated manual entry errors. As a result, this improves the stakeholder trust in data which leads to more data-driven decisions.
You can schedule automatic data refresh of your Power BI reports up to 8 times per day under a standard Power BI Pro licence. Imagine refreshing your reports manually 8 times per day, you would need a full-time employee for that!
This is the power of automation, you can keep your financial reports updated, immediately acting on changes in your data.
For example one of our clients reported that after implementing Power BI reports with us they increased reporting frequency from monthly to daily.
Power BI helps accountants communicate more clearly through data. As a result the readers of Power BI financial reports can discover more insights from their reports and make more informed decisions.
For example, Mariyan Rangelov, CFO of Neterra Telecommunications reported that Power BI reports helped him identify a one-off cost saving opportunity worth 50k EUR and more new business opportunities worth 20k EUR per month.
We have put together a list of Power BI accounting dashboards that we often create for clients. Most of those dashboards are available to download for free from our website. Others are developed specifically upon request.
Power BI enables accountants to bring the profit and loss statements to life with interactive data visualisation. By using these reports, the clients can clearly see the trends for their P&L metrics, understand the main drivers for change, and drill down into transactions.
As many accountants know, looking into percentages and trends gives a lot more context to the P&L statements. Presenting these KPIs in a visual form in Power BI makes the client reporting process a lot more effective.
Please note: our Xero Power BI template also includes a page on Balance Sheet analysis.
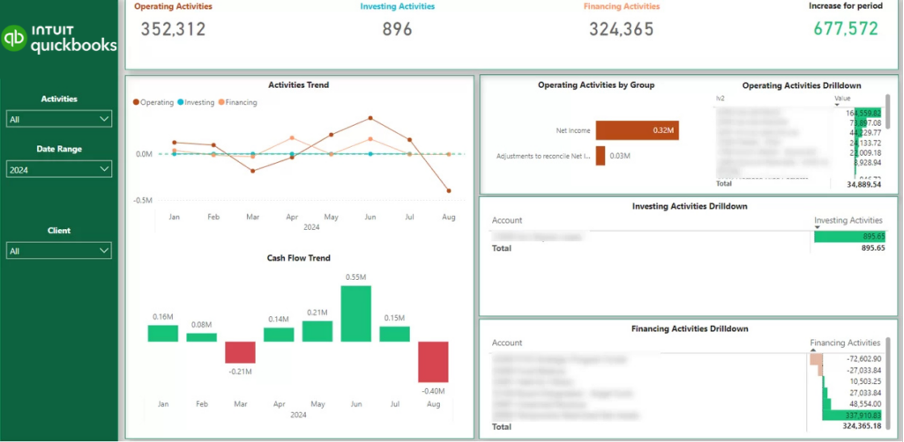
Cash is king for small businesses and many clients worry about their cash flow metrics on a regular basis. Creating cash flow analysis in Power BI helps the accountants to alleviate some of this anxiety by increasing the visibility of a company’s cash flow position. This makes clients feel like they are more in control of their cash flow since they know where they stand at any time.
Cash Flow dashboards also break down the cash inflow and outflow activities by account so the accountants can see the main contributions to net change.
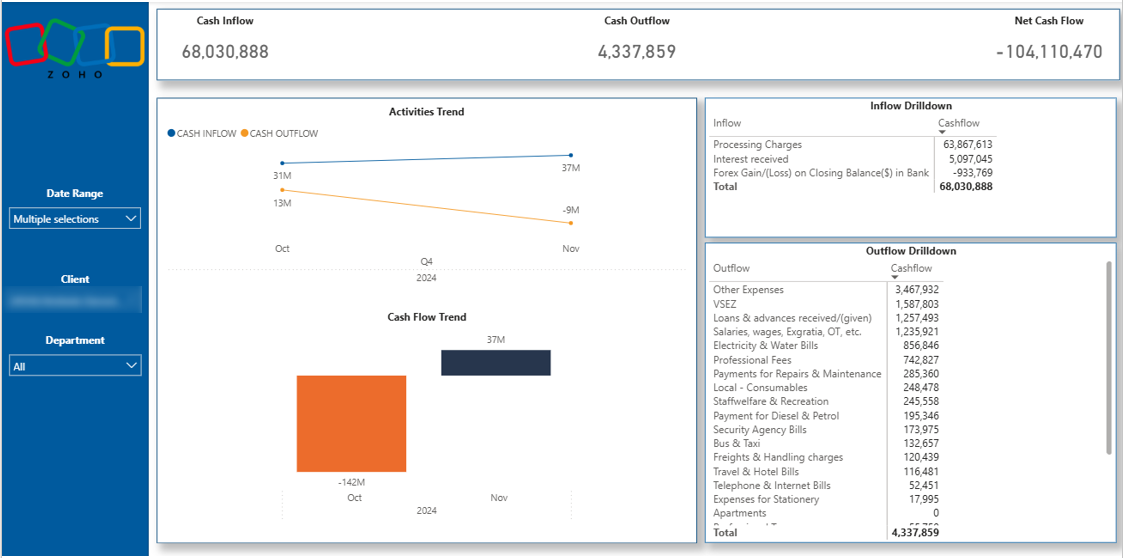
Please note: Our Zoho Books Power BI dashboard includes pages on P&L, Balance Sheet and Cash Flow, Aging Account Receivables and Outstanding Invoices analysis.
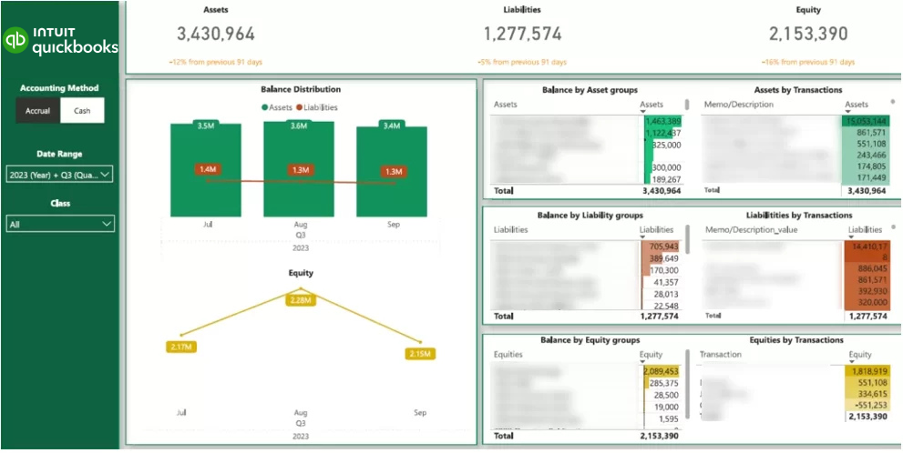
Balance sheet analysis is most important for businesses in sectors like real estate because they typically have larger assets and liabilities. It is valuable for the clients in these sectors when their accountants provide these dashboards to them because they help to keep the liabilities under control.
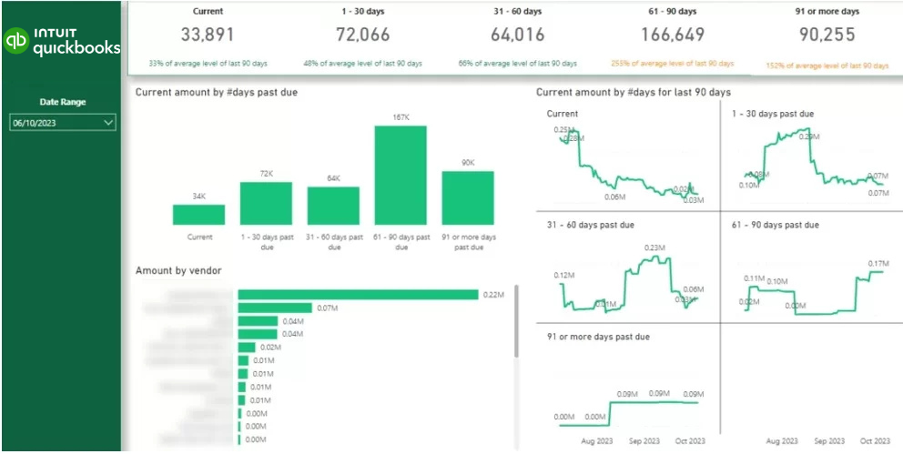
Every B2B business is worried about the speed of revenue collection. An AR Power BI report highlights which clients still owe the money to the company, how much they owe and for how long.
When accountants provide this report to their clients, it helps them to collect revenue quicker and reduce bad debt by following up on outstanding invoices promptly.
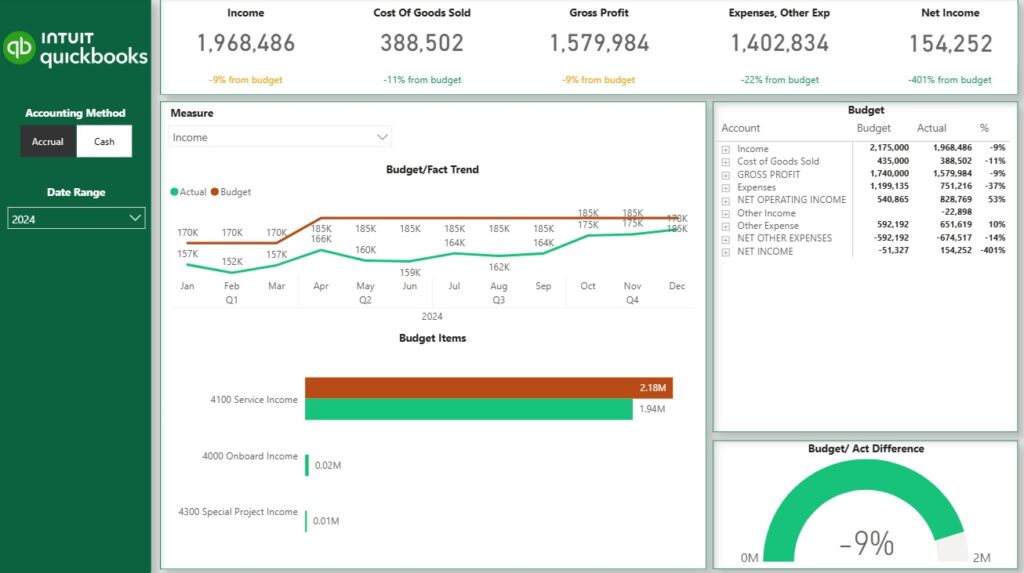
Accountants often create Power BI dashboards to compare actual sales and expenses against budgets set at the start of the year or quarter. Since budgets act as long-term targets and are usually updated annually, Power BI makes it easy to track performance against them in real time.
Another strength of Power BI for accountants is the ability to combine budgets with forecasts. Forecasts are updated more frequently—weekly or monthly—so layering them over budgets and actuals provides a dynamic view of financial performance.
We have a long guide on best Power BI practices including data modeling, visualization and governance. However, there are a few Power BI best practices that are especially relevant to accountants specifically.
Use ready-made Power BI templates to start your development. These templates already have all the formulas needed to make your numbers match. As a result you don’t have to go though all the trial and error building your data model and formulas.
For example our QuickBooks Online Power BI template already has all the P&L, Cash Flow and Balance Sheet analysis. It is far easier to install and then edit it rather than developing it from scratch.
The same goes for Power BI integrations. Coding them from scratch is a very technical task and takes a lot of time. At the same time there are already plenty of ready-made Power BI integrations that you can use right now.
Financial data is quite sensitive, especially if you are working with the data of your clients. Power BI itself is very secure but how you use it has a big impact on data security.
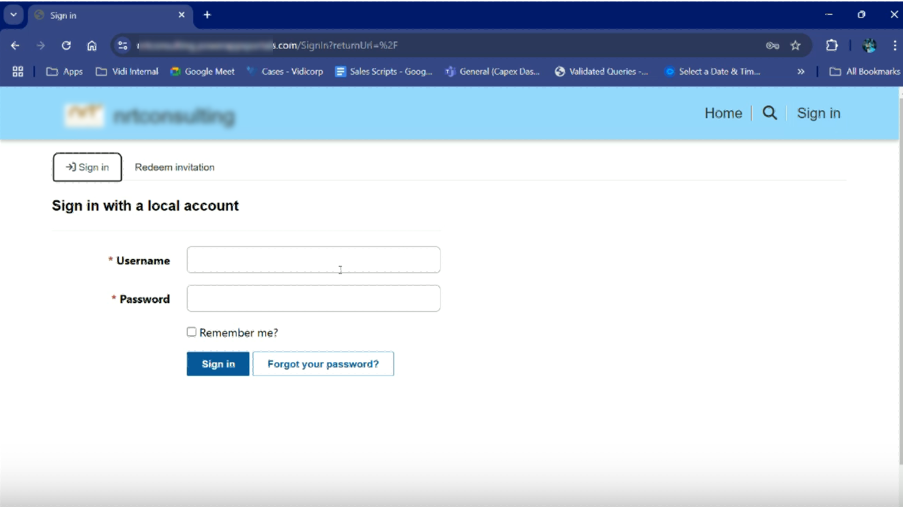
For example, if you are sharing Power BI reports using public links, those are indexed by Google and can be found by anyone through online search. Instead we recommend either investing in Power BI Pro licenses for your clients or developing a secure client portal where they can log in to access their reports.
You can also use features like row-level security to restrict the data that you are showing to each client in your Power BI reports. This way you can make sure that clients can only see the data that they are meant to see rather than the entire dataset.
The importance of Power BI for accountants is beyond exaggeration. At Vidi Corp, we have helped dozens of accounting practices to implement Power BI in their business. As a result, we have many files and scripts that we can reuse, making our work very efficient.
If you want to chat more about how to implement Power BI in your CPA practice, please contact us now!
![]()
![]()
![]()