
Eugene Lebedev is a Power BI consultant by background. Before founding Vidi Corp in 2021 he created Power BI reporting for Autodesk. His Power Bi reports were used by VPs of Finance and C-suite of Autodesk. As part of Vidi Corp, Eugene created dashboards for Google, Teleperformance, Delta Airlines and 200+ clients worldwide.
Power BI Bookmarks can help you increase the interactivity of your reports. Bookmark is a powerful tool that allows you to capture the current state of a report, such as the visuals, filters, and slicers that are selected, and save them as a “bookmark.” You can then use this bookmark to quickly open that specific state of the report. For example, you can allow your users to switch between different views of the same page with a click of a button.
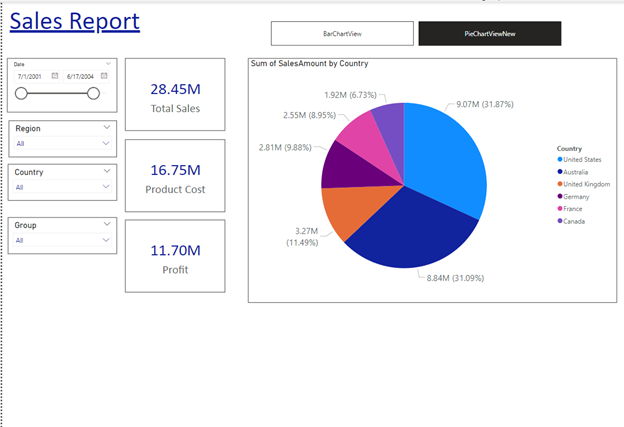
Let’s go through creating a bookmark together. We have a sales report as follows:
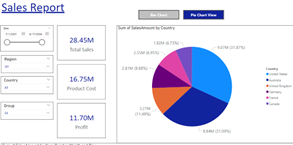
There is another view of this report where Sales by country is represented by a Pie chart instead of a bar chart.
You can save both of these views as Power BI bookmarks inside of your report. Doing this will allow you to switch between the 2 saved views with a click of a button.
Lets create a view using bookmark for Pie chart:


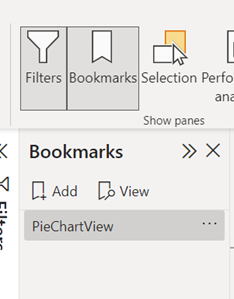
We can follow the same process to create a bookmark for the bar chart view
Note: Bookmarks are created for the view that you are seeing on your screen. Make sure that you open a view that you need before saving a bookmark. Also be careful not to overwrite your existing bookmark by mistake.
Once a bookmark is created we can put it to use by connecting it to a button. This way when a user clicks on a button, Power BI will take them to a relevant bookmark.
Let’s create a navigation bar in our report to navigate between BarChartView and PieChartView.
There are 2 ways to create a navigation bar in Power BI:
We can add blank buttons to the report and then configure bookmarks to each button through its action. Let’s create 2 blanks buttons in our report and connect our bookmarks to them:
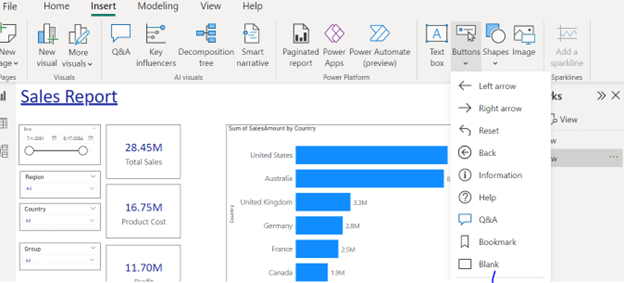
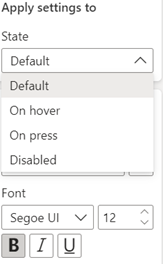
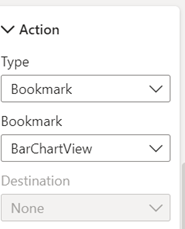
Note: We have used blank buttons as a navigator here but we can also use images or other types of icons instead of blank buttons.
To see how you can optimise your reporting using Power BI, make an enquiry here.
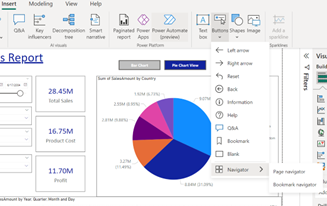
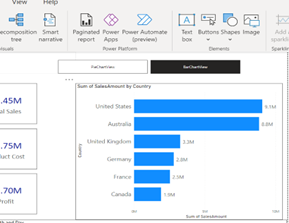
In Nov 2021 Power BI announced a new feature to navigate between bookmarks. It allows you to create button sets corresponding easily and quickly to your bookmarks, and format them in a wide variety of ways. This option will automatically create a navigator on the basis of Power BI bookmarks available in the report and makes it easy for a developer to avoid manual configuration. Let’s create a navigator using this option in our report:
To see how we can optimise your reporting with Power BI Bookmarks, click here.
Once a bookmark is created, you can adjust it by updating, renaming, deleting, and grouping.
This allows us to update an existing bookmark with the current view. This is useful if you already have a bookmark but you want to edit some visuals on it. For example, my PieChartView bookmark currently looks like this:
Assume I would like to remove the Trend chart from this view. In that case, I will go to the bookmark and click on PieChart View. Remove the chart from the view and right-click on bookmark and update.
This will now save the view without the trend chart as the PieChartView bookmark.
This allows us to rename the bookmark. In order to rename a bookmark, you can double-click on its name. Alternatively, you can click on three dots and hit rename.
If you don’t need your bookmark anymore, you can hover over the bookmark name and click on the three dots. This will then give you the option to delete it.
This action deletes a bookmark permanently from the report. Please note that if the deleted bookmark is used somewhere in the report, some of the functions of the report might break. Make sure you audit those functions after deleting the bookmark.
As the name suggests it allows us to group the bookmarks or ungroup them from existing groups. This is helpful to keep track of your bookmarks in the report.
In the current context, we have 2 bookmarks that are related to chart types. However, what if we have 10 more bookmarks? It might become difficult for us to find the relevant ones.
If you want to easily find these 2 bookmarks later then it’s better for us to group them as “Chart Based Bookmarks”. Let’s do it by selecting the 2 bookmarks and clicking on “group”. Now our group is created and we can rename it as needed.
One group is created you can drag another bookmark to it in order to add them in:
Similarly, we can ungroup the bookmarks by removing them from the existing group.
This option allows you to control what filters and slicer selections are used when you switch between the 2 different bookmarks.
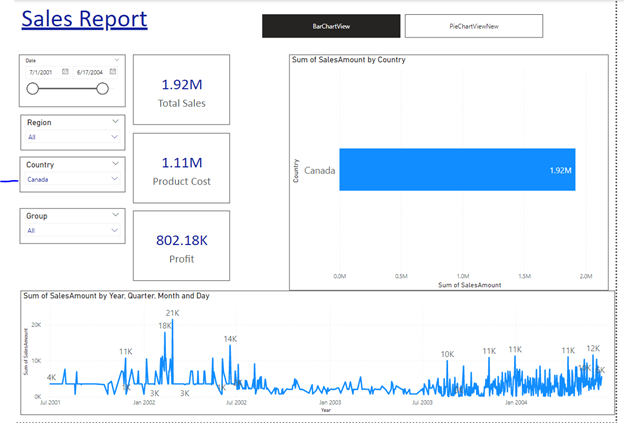
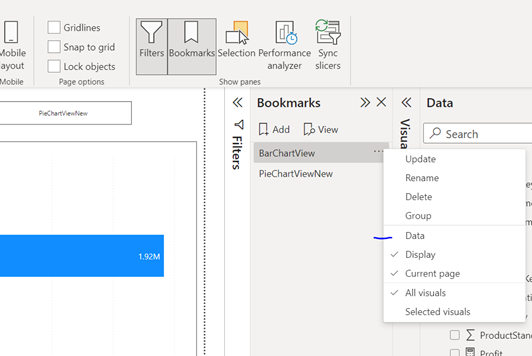
When you see a tick next to “data” for your bookmark, this means that Power BI remembered what filter selections were applied when you saved the bookmark. Every time a user opens this bookmark, these exact selections will be applied automatically.
If you see no tick next to “data” for your bookmark, when users go to this bookmark, Power BI uses the latest filter selection that a user applied. In other words, the filter and slicer selections that you had when you were creating the bookmark will not be remembered.
Let’s look at an example together:
We have a configuration where the data tab is checked in the bookmark setting:
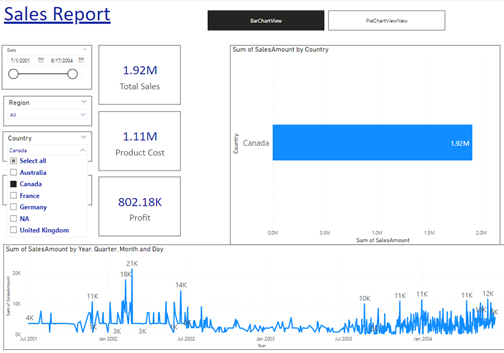
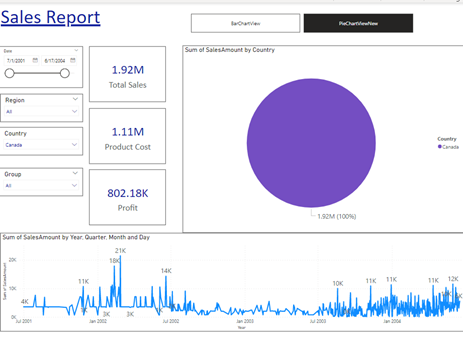
This customisation option allows us to control which elements are displayed in the report. This is used when you want to dynamically hide or show specific elements and also to show/hide spotlight elements.
Consider this example below:
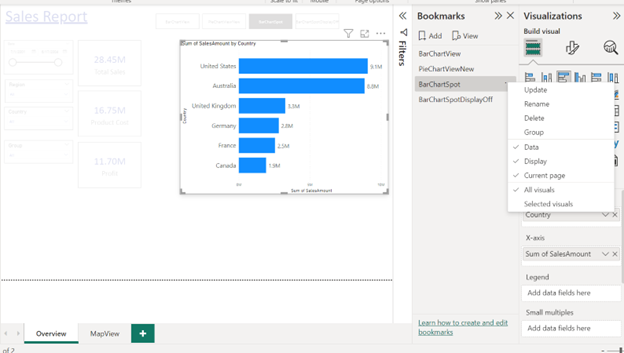
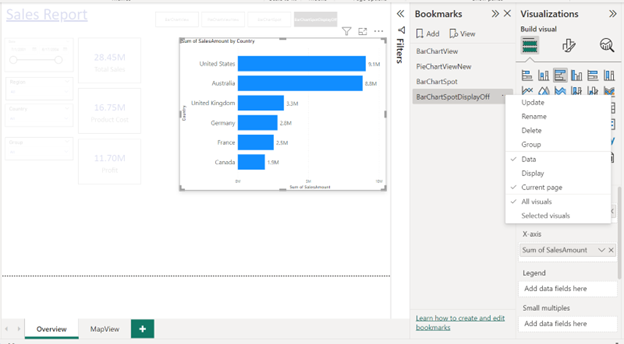
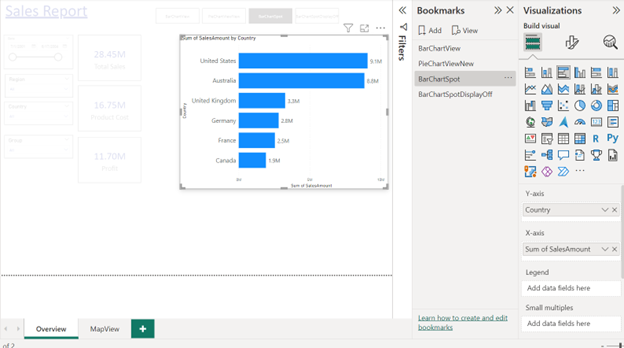
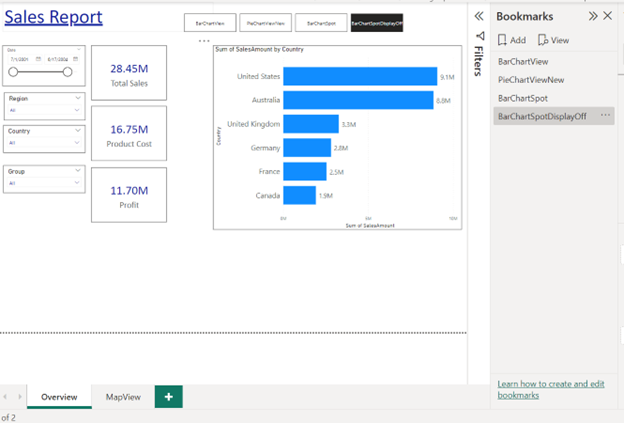
Note: It is recommendable to use display enable options while using bookmarks.
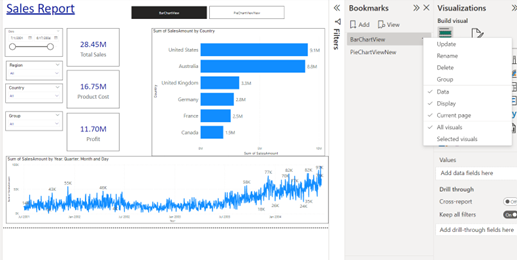
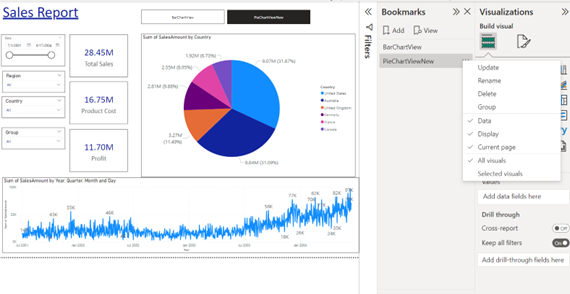
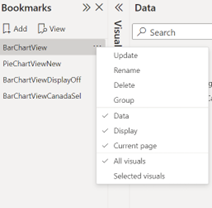
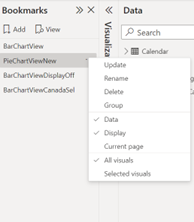
When the “Current Page” option is enabled, this option will allow us to jump from one page to another page. If not applied, Power BI will still take a user to the bookmark but it will not change the page. Let’s look at it in more detail using the example below:
| BarChartView | PieChartView |
 |
 |
Current Page is enabled


The current Page is Disabled
| BarChartView- Current Page Enabled | PieChartView-Current Page Disabled |
 |
 |
This option allows you to save and restore the state of all the elements on the page. If this option is selected, Power BI will remember all the selections in the filter pane, and even whether the filter pane is open or collapsed. This option is enabled by default when you create a bookmark.
If enabled, this option only saves the current state for the selected visuals in a bookmark. You can select items by holding ctrl and clicking on them in the selection panel.
Consider the example below:
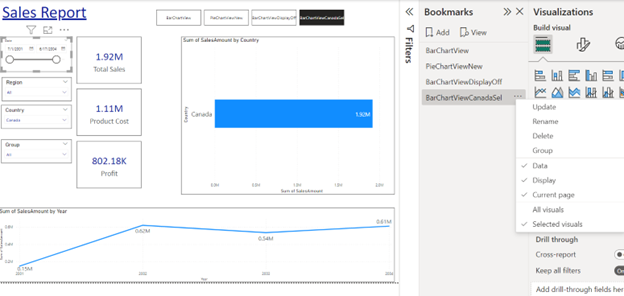
Note: The selected visual property is very important to add to your arsenal.
Bookmarks are essentially snapshots of your report. You can save the current state of a report in a bookmark including slicer selection, filter selection, the state of visuals, etc. Once you save a certain view of the report, you can connect it to a button so that a click on this button will take a user to this bookmark.