
Eugene Lebedev is a Power BI consultant by background. Before founding Vidi Corp in 2021 he created Power BI reporting for Autodesk. His Power Bi reports were used by VPs of Finance and C-suite of Autodesk. As part of Vidi Corp, Eugene created dashboards for Google, Teleperformance, Delta Airlines and 200+ clients worldwide.
Power BI has become a significant tool in the business intelligence space, enabling organisations to turn unstructured data into actionable insights. Although interactive visualisations and self-service analytics are Power BI’s primary areas of concentration, it also provides a unique reporting function known as paginated reports. Users can develop and send finely prepared, pixel-perfect reports that are suited for printing or creating electronic files by using paginated reports.
This article will go into the world of Power BI paginated reports and examines their essential characteristics, advantages, and real-world applications.
Reports Paginated reports, formerly known as SQL Server Reporting Services (SSRS) reports, have a consistent layout and are made to fit a defined page size. Paginated reports concentrate on providing accurate and structured information in a printable manner, as opposed to other report types in Power BI which are interactive and flexible. They are frequently employed in situations where accuracy and conformity are crucial, such as operational reporting, regulatory compliance, and others. Let’s understand the difference between a normal Power BI Report and a paginated Power BI report:
| Feature | Normal Power BI Report | Paginated Power BI Report |
| Interactivity | High | Limited |
| Layout | Flexible Layout | Fixed Layout |
| Formatting | Basic Formatting | Advance Formatting Control |
| Page Size | Variable Page Size | Fixed Page Size |
| Pagination | Dynamic and Automatic | Manual Control Over Page |
| Export Formats | Limited Export Format | Wide Range of Export Format |
| License | Power BI Free, Pro and Premium | Power BI Premium, PU |
Pixel-Perfect Layout and Formatting: Paginated reports allow users to control every aspect of the report layout within Power BI, including precise placement of elements, custom headers and footers, and consistent page numbering. This ensures that the report maintains a professional appearance.
Support for Large Datasets and Complex Reports: Paginated reports can handle large datasets efficiently and are well-suited for scenarios where there is a need to present extensive tables, matrices, or charts. They can include hundreds or even thousands of pages without sacrificing performance.
Print-Ready and Exportable Formats: Paginated reports can be exported to various formats such as PDF, Excel, Word, or PowerPoint, making it easier to distribute and share the reports with stakeholders who may not have direct access to Power BI.
Parameterisation and Interactivity: While paginated reports in Power BI are primarily designed for fixed layouts, they can still incorporate parameters and interactivity to enable users to filter and customise the report output based on their specific needs.
Report Caching and Performance Optimisation: Paginated reports offer caching options, allowing users to balance the need for fresh data with performance requirements. By utilising caching, report load times can be significantly improved.
Let’s understand the context when paginated reports can be used as follows:
Financial Statements: Paginated reports are well-suited for generating financial statements, including income statements, balance sheets, and cash flow statements. The fixed layout and precise formatting capabilities ensure that financial data is presented accurately and in a consistent manner.
Regulatory Reporting: Many industries have strict regulatory requirements that demand standardised reporting formats. Paginated reports enable organisations to comply with these regulations by providing pixel-perfect reports that meet the specific formatting and layout guidelines set by regulatory bodies.
Invoices and Purchase Orders: Paginated reports are ideal for generating invoices, purchase orders, and other transactional documents. They allow organisations to present these documents with a professional appearance, incorporating logos, customer details, itemised lists, and other necessary information.
Operational Reports: Paginated reports are effective for creating operational reports that summarise key performance indicators (KPIs) and metrics across various departments or business functions. These reports provide a consolidated view of performance, making it easier for stakeholders to track progress and identify areas for improvement.
Compliance Reporting: Organisations dealing with regulatory compliance, such as HIPAA (Health Insurance Portability and Accountability Act) in healthcare or GDPR (General Data Protection Regulation) in data privacy, can leverage paginated reports to document and report on compliance activities, ensuring transparency and adherence to regulatory standards.
Creating a paginated report in Power BI involves several steps. Here’s a step-by-step guide to help you get started:
Step 1: Prepare your Data Source
Before creating a paginated report, ensure that you have a data source ready. This can be an existing dataset in Power BI or an external data source such as SQL Server, Oracle, or Excel. We are using AdventureWorks2017 database for illustration.

Step 2: Install Power BI Report Builder
To create paginated reports, you’ll need to install Power BI Report Builder, a standalone application specifically designed for building paginated reports.
You can download it for free from the Microsoft Download Center using the below link: https://www.microsoft.com/en-us/download/confirmation.aspx?id=53613

Step 3: Launch Power BI Report Builder
After installing Power BI Report Builder, launch the application on your computer.

Step 4: Connect to Data Source
In Power BI Report Builder, click on the “New” button to create a new report.

Right-click on the “Data Source” button in the toolbar to connect to your data source. We can add Power BI dataset connection or their data sources. Click on ‘add data source’ to add SQL database.
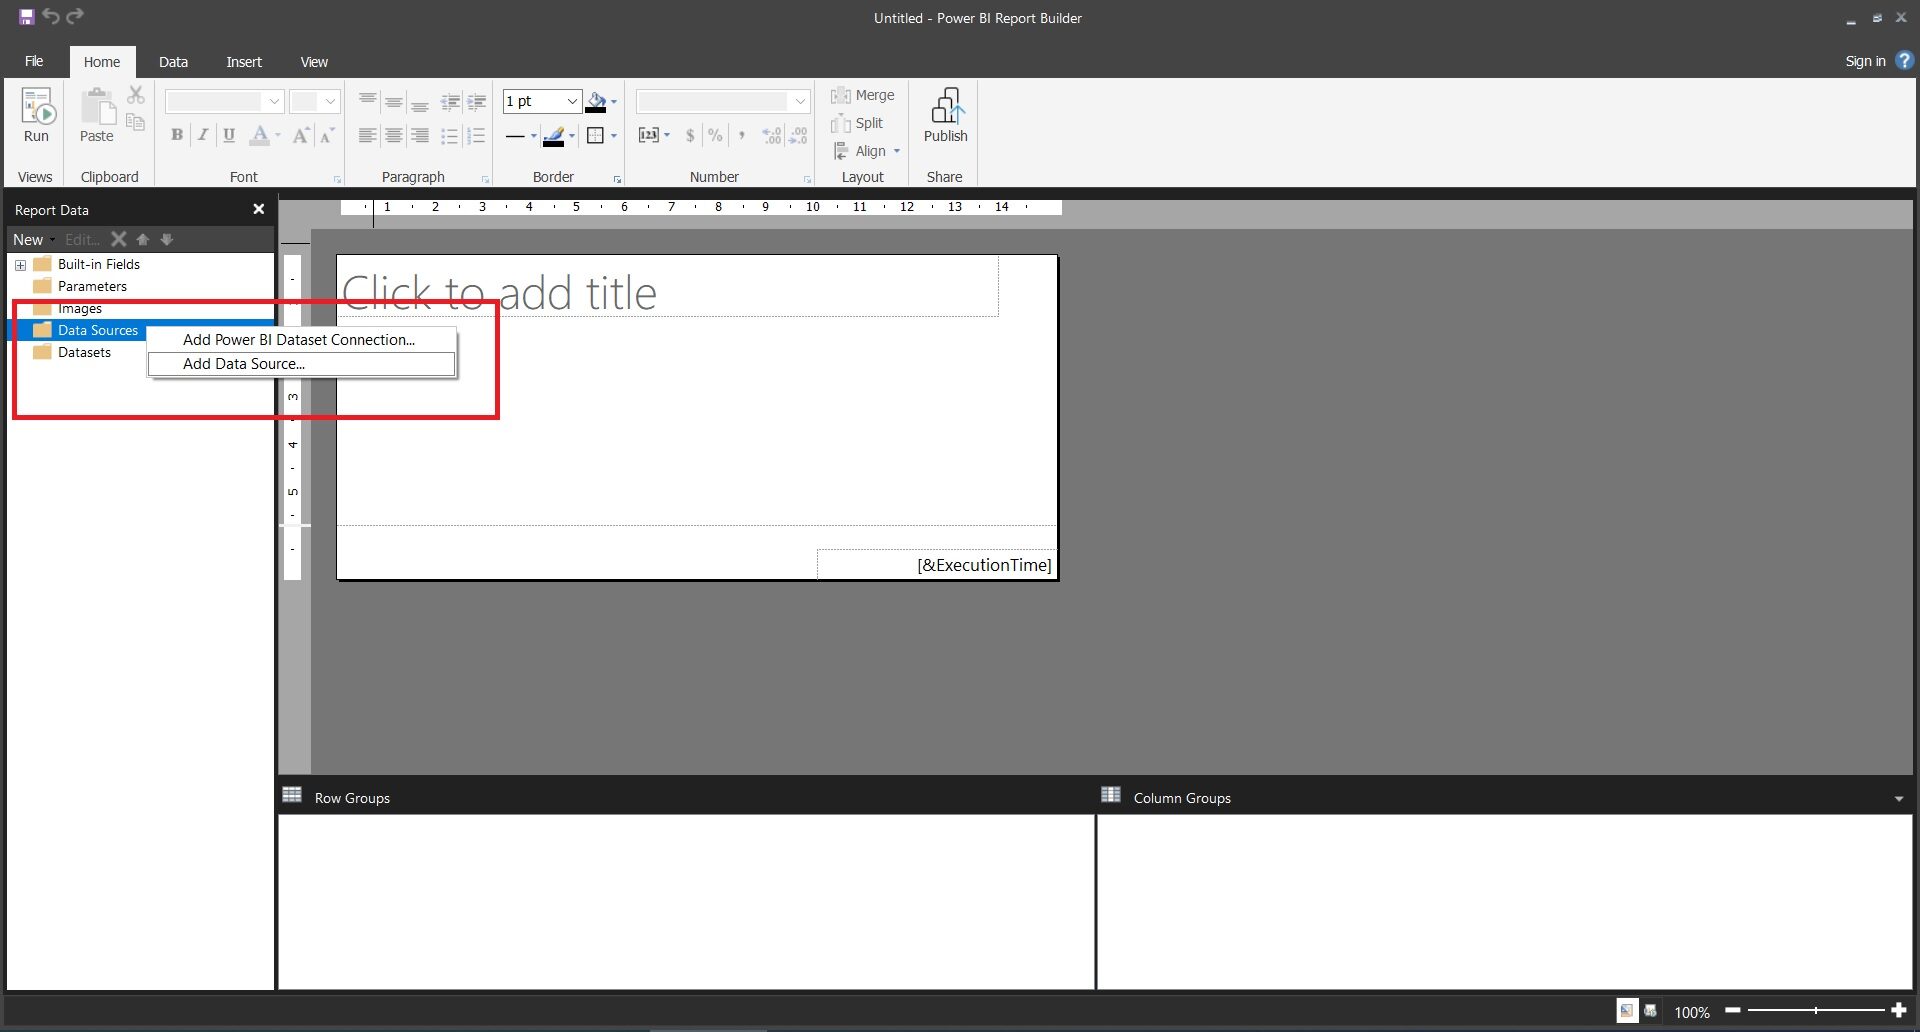
It will open a window, click on build to provide SQL server and database name.

Provide the SQL server name and Database name. Click ‘ok’ to close the window.

Click on the test connection button to check the connection status. It will show the below message for a successful connection, else check your server details or database name.
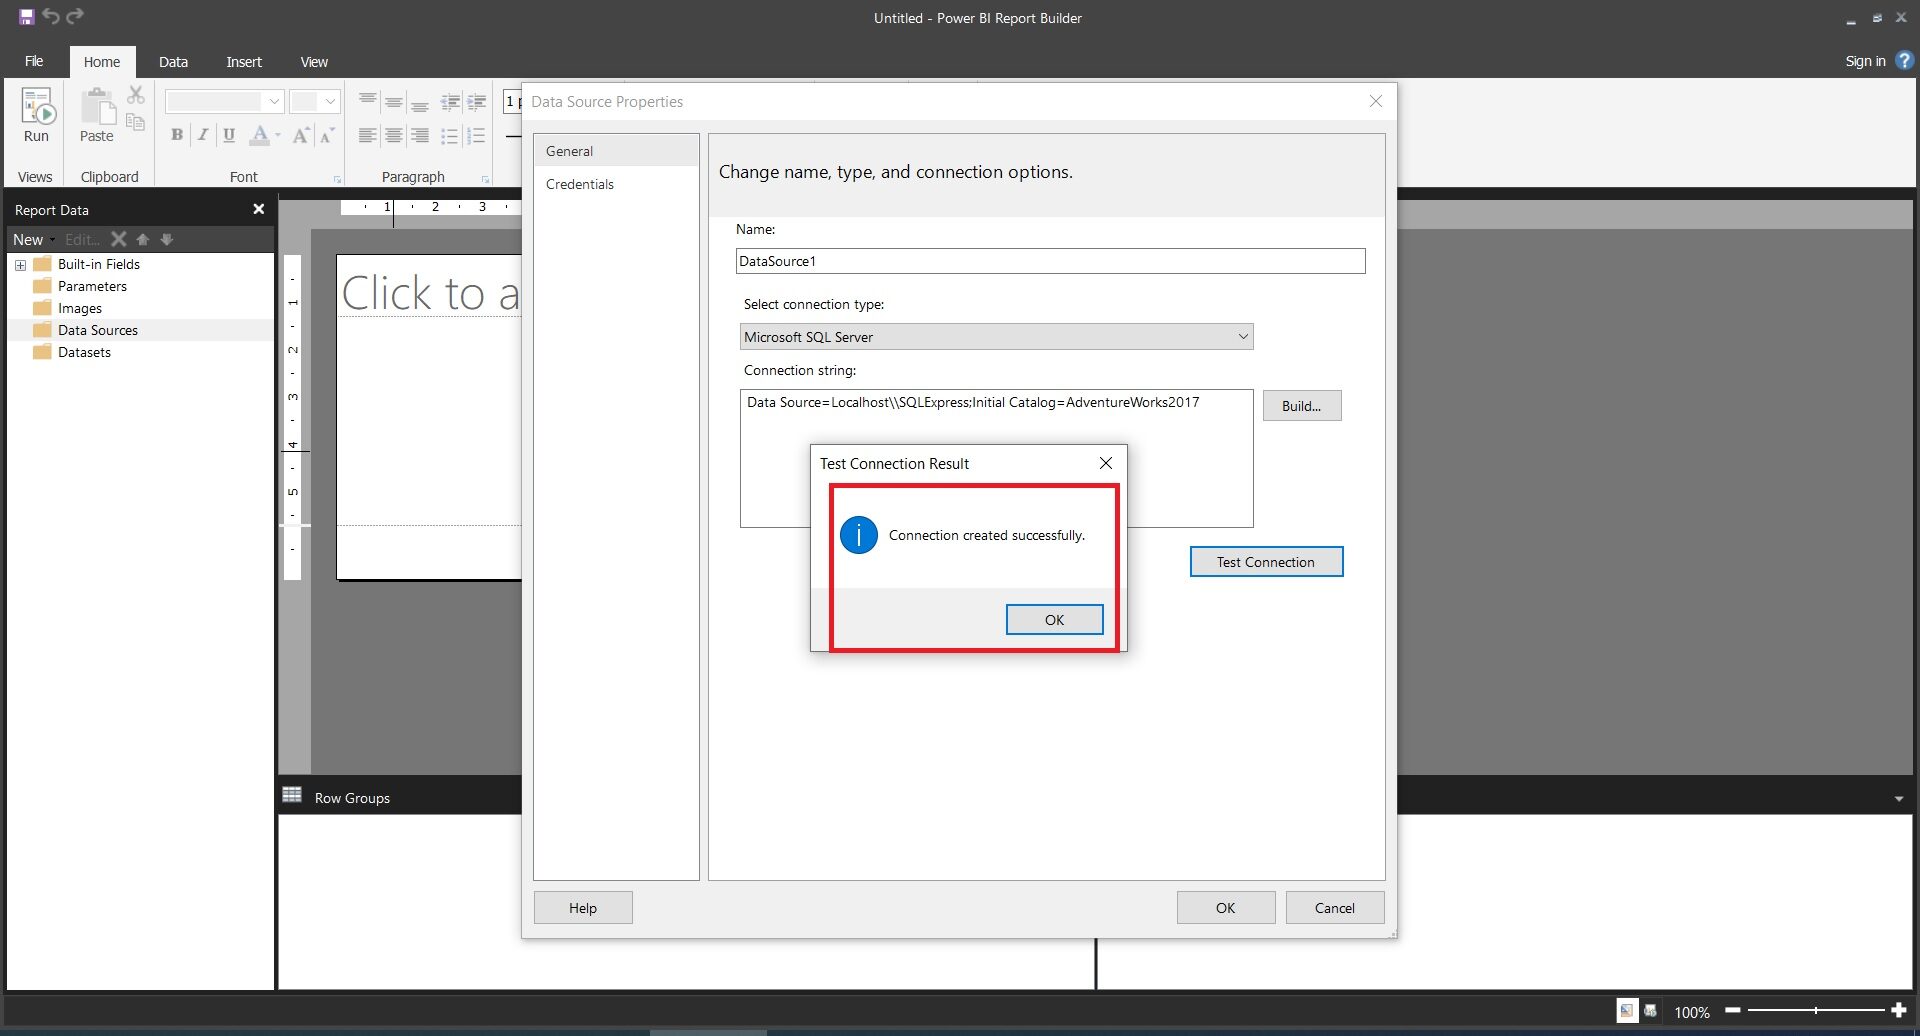
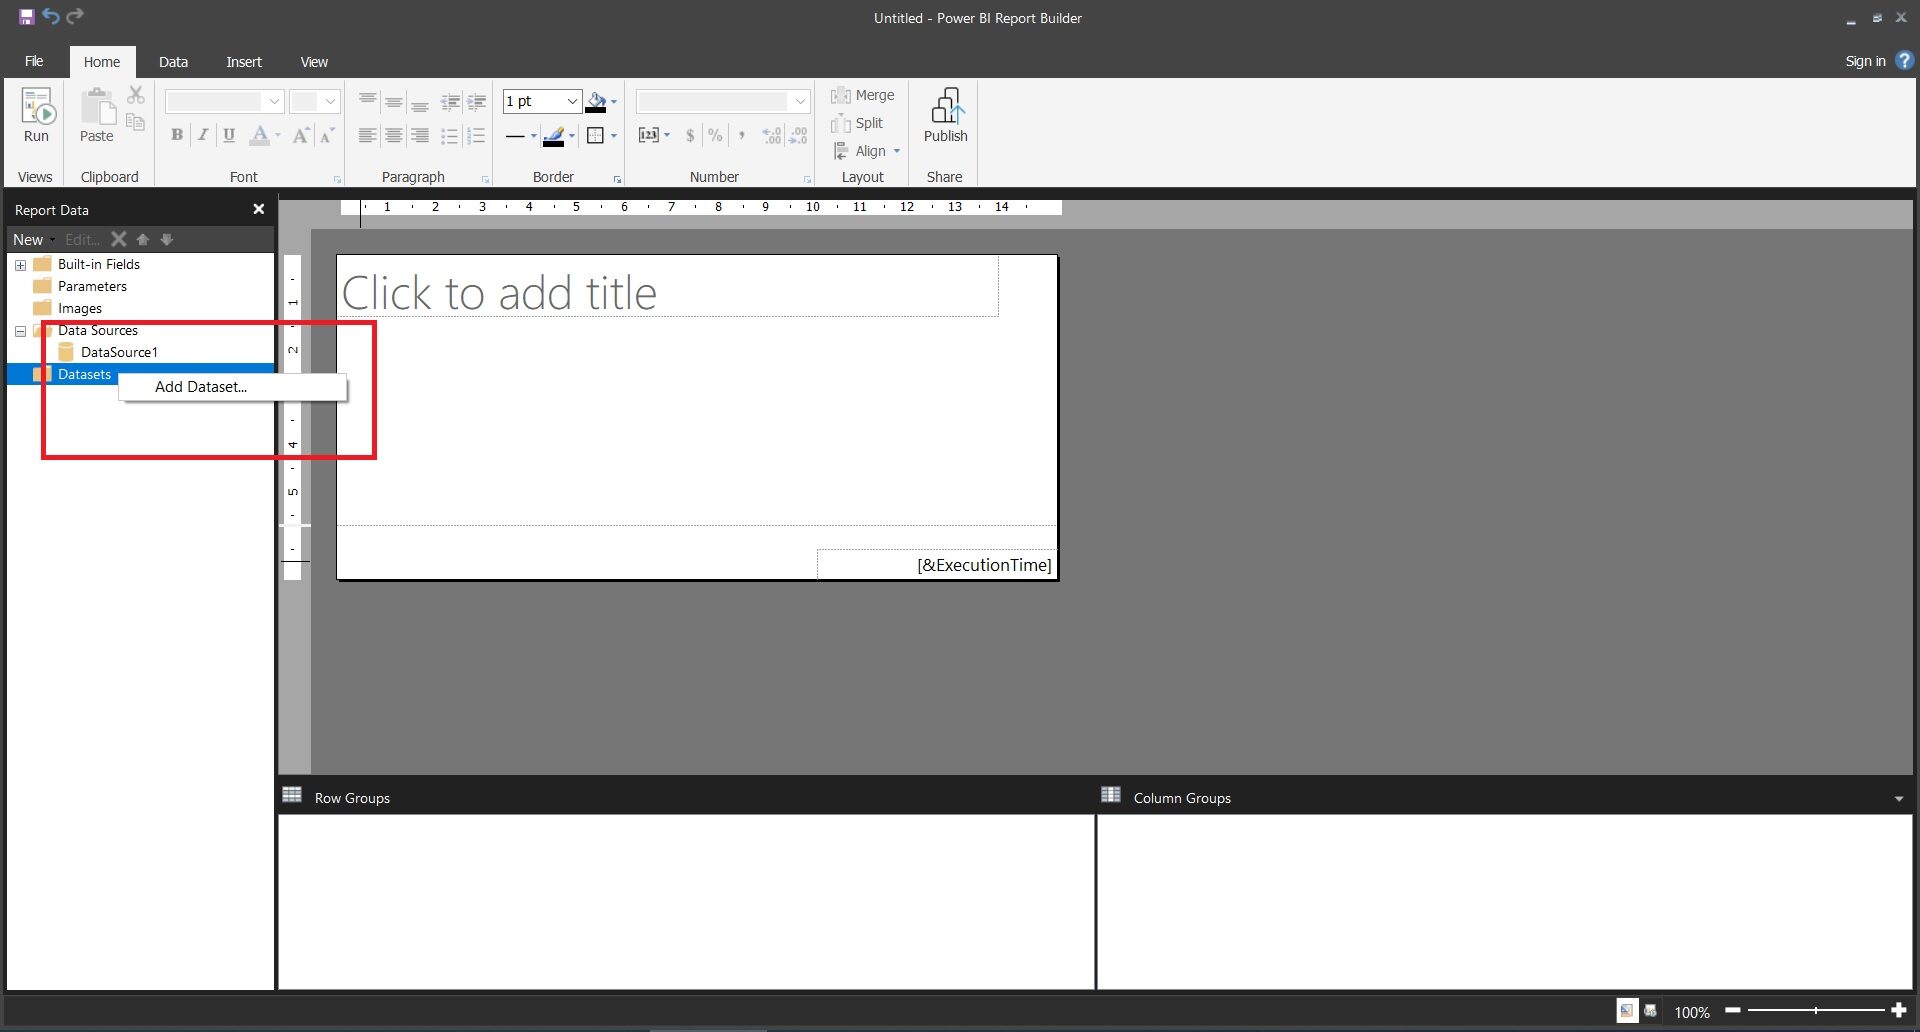
Now the data source is added to the report builder, we will import the dataset. Right-click on the dataset and click add dataset:
Provide DataSource name (Created earlier) and a query to fetch the required columns from the SQL.
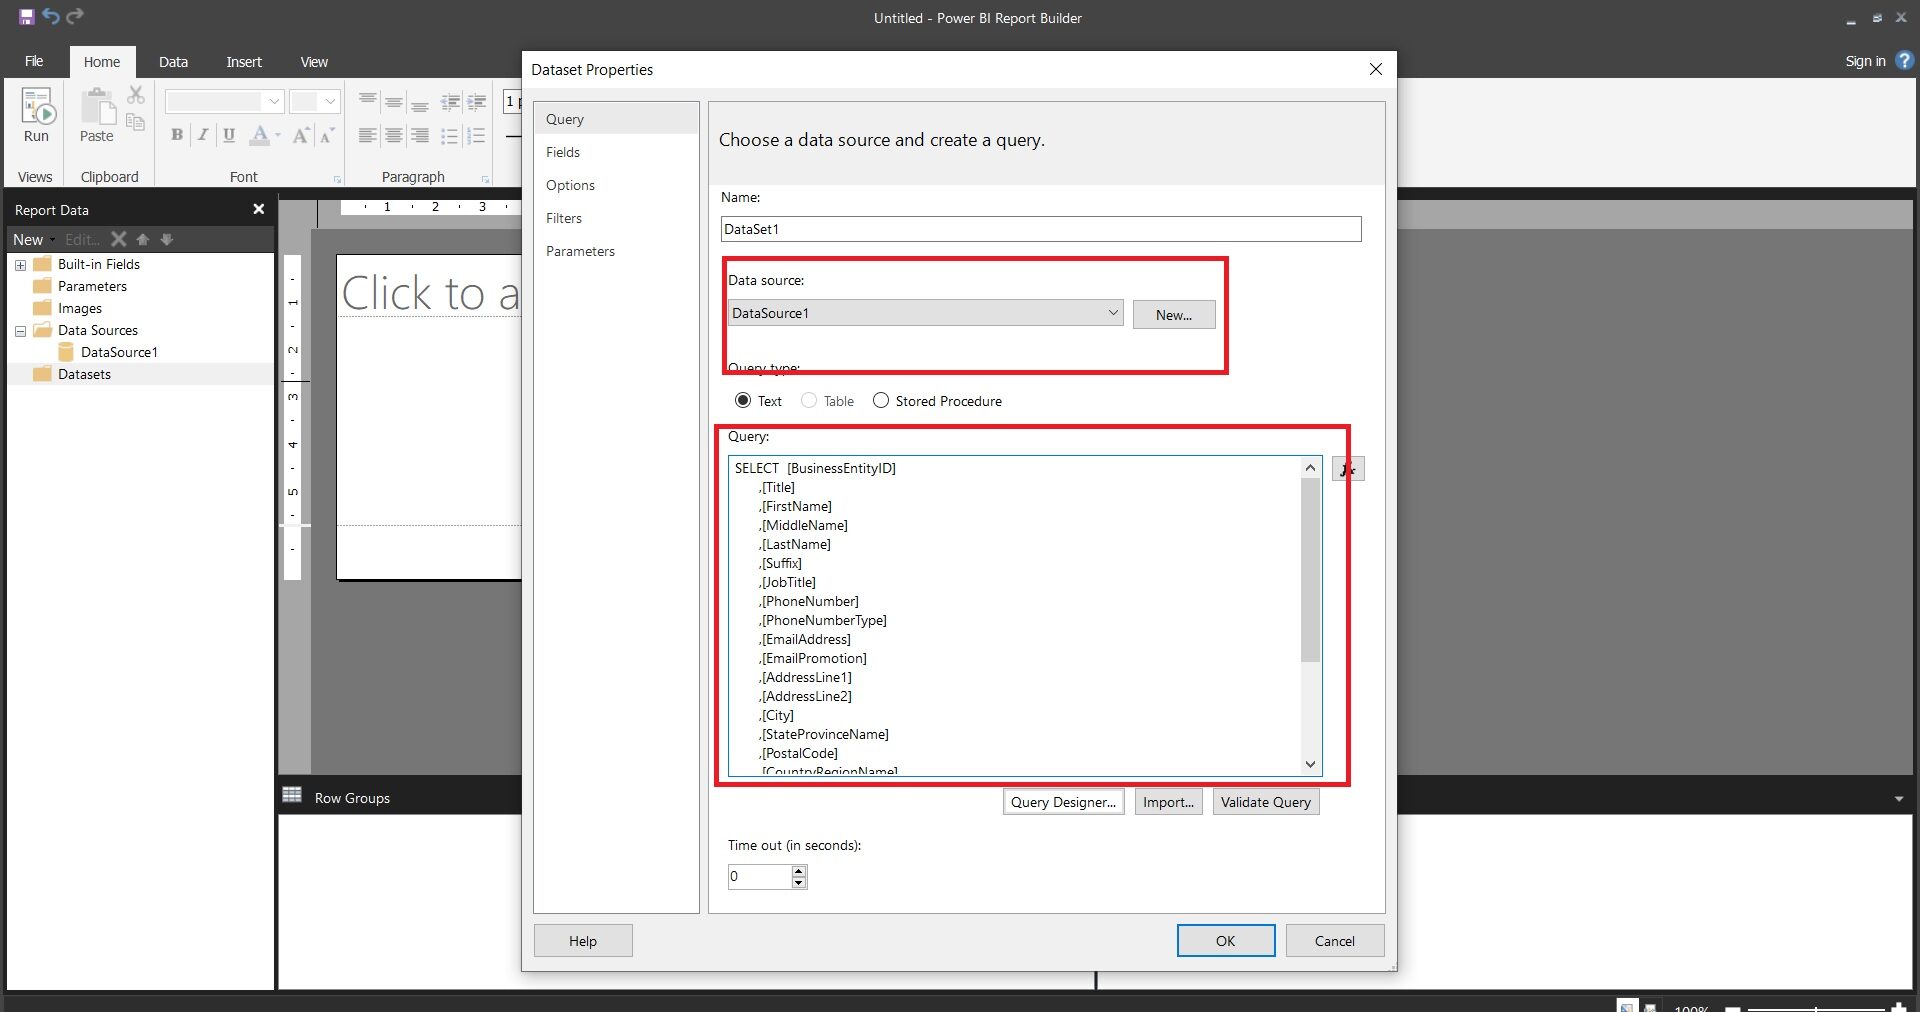
Click on ‘ok’ and you will see all the columns are available in the Dataset folder.
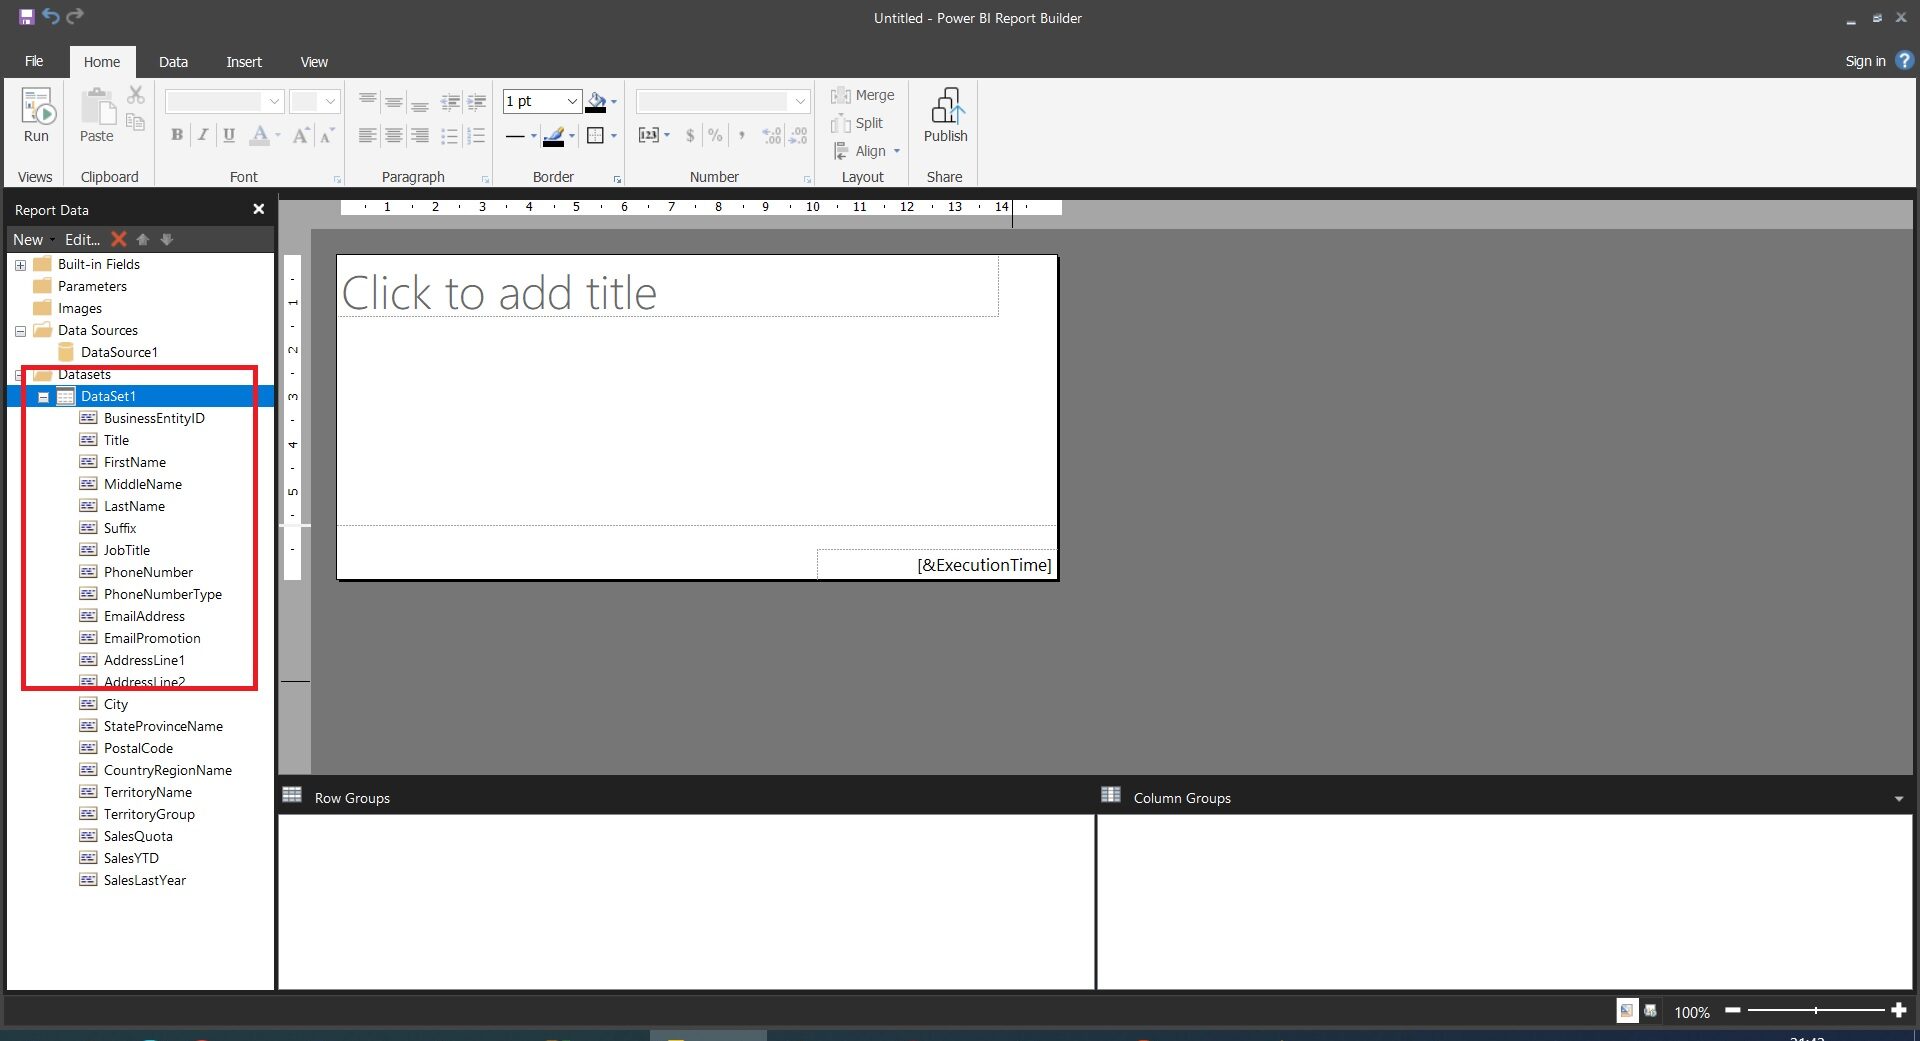
Step 5: Design the Report Layout
Once connected to the data source, you can start designing the report layout. Power BI Report Builder provides a drag-and-drop interface for adding tables, matrices, charts, and other report elements.
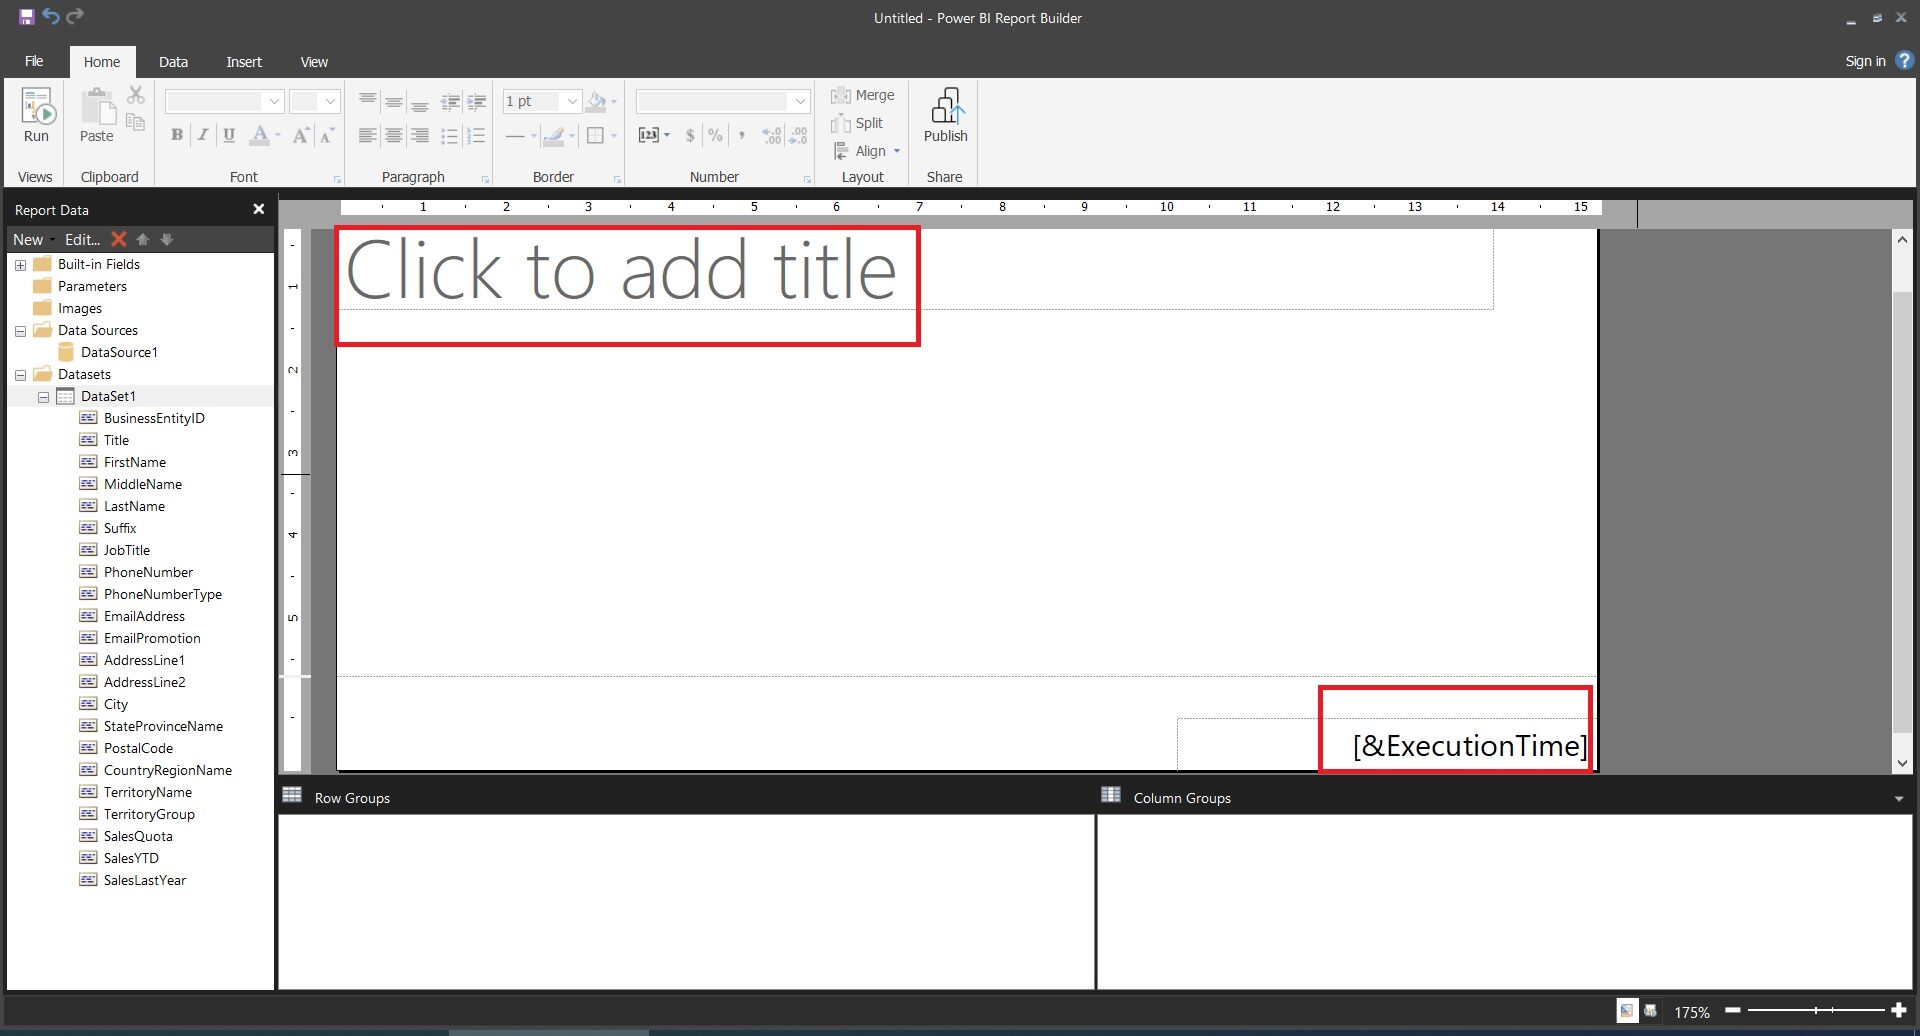
You can customise the layout, adjust the positioning of elements, and format them according to your requirements. In order to add a table, click on insert and add a table as follows:
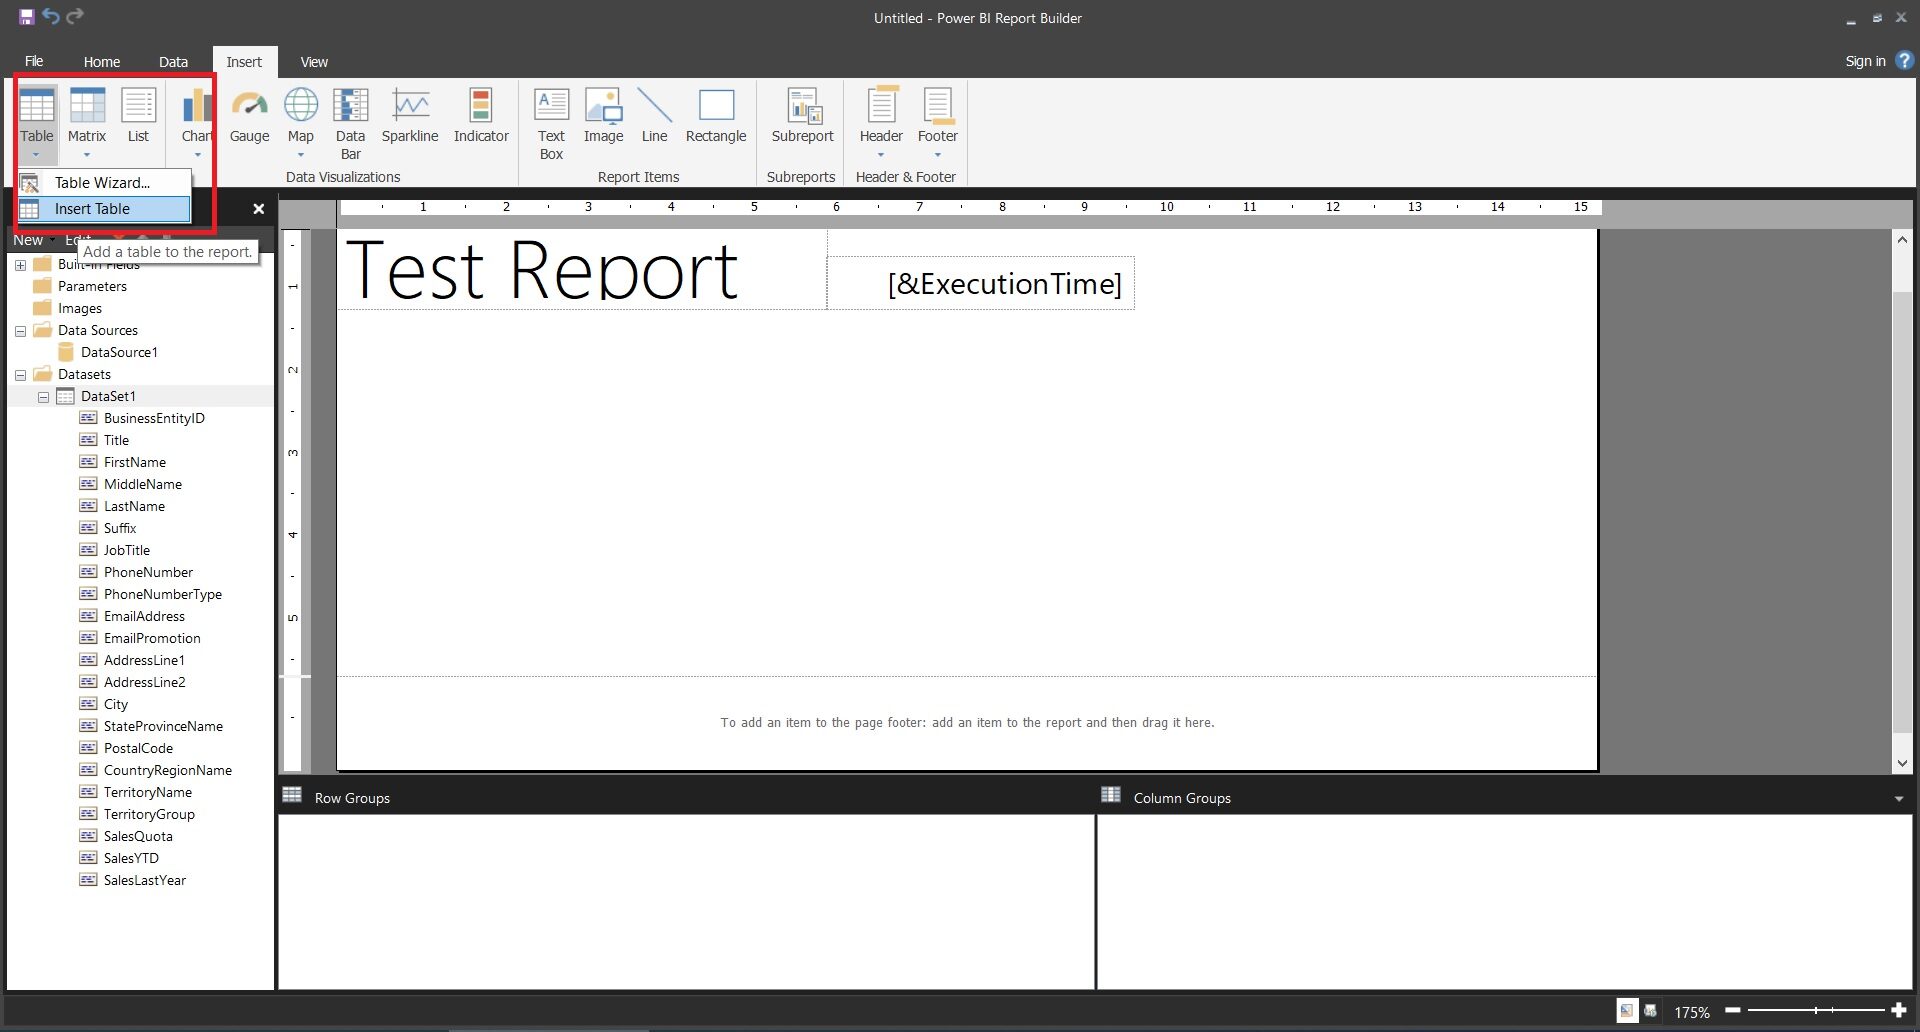
Add the table and below formatting options that are available in the Paginated Power BI Report Builder.
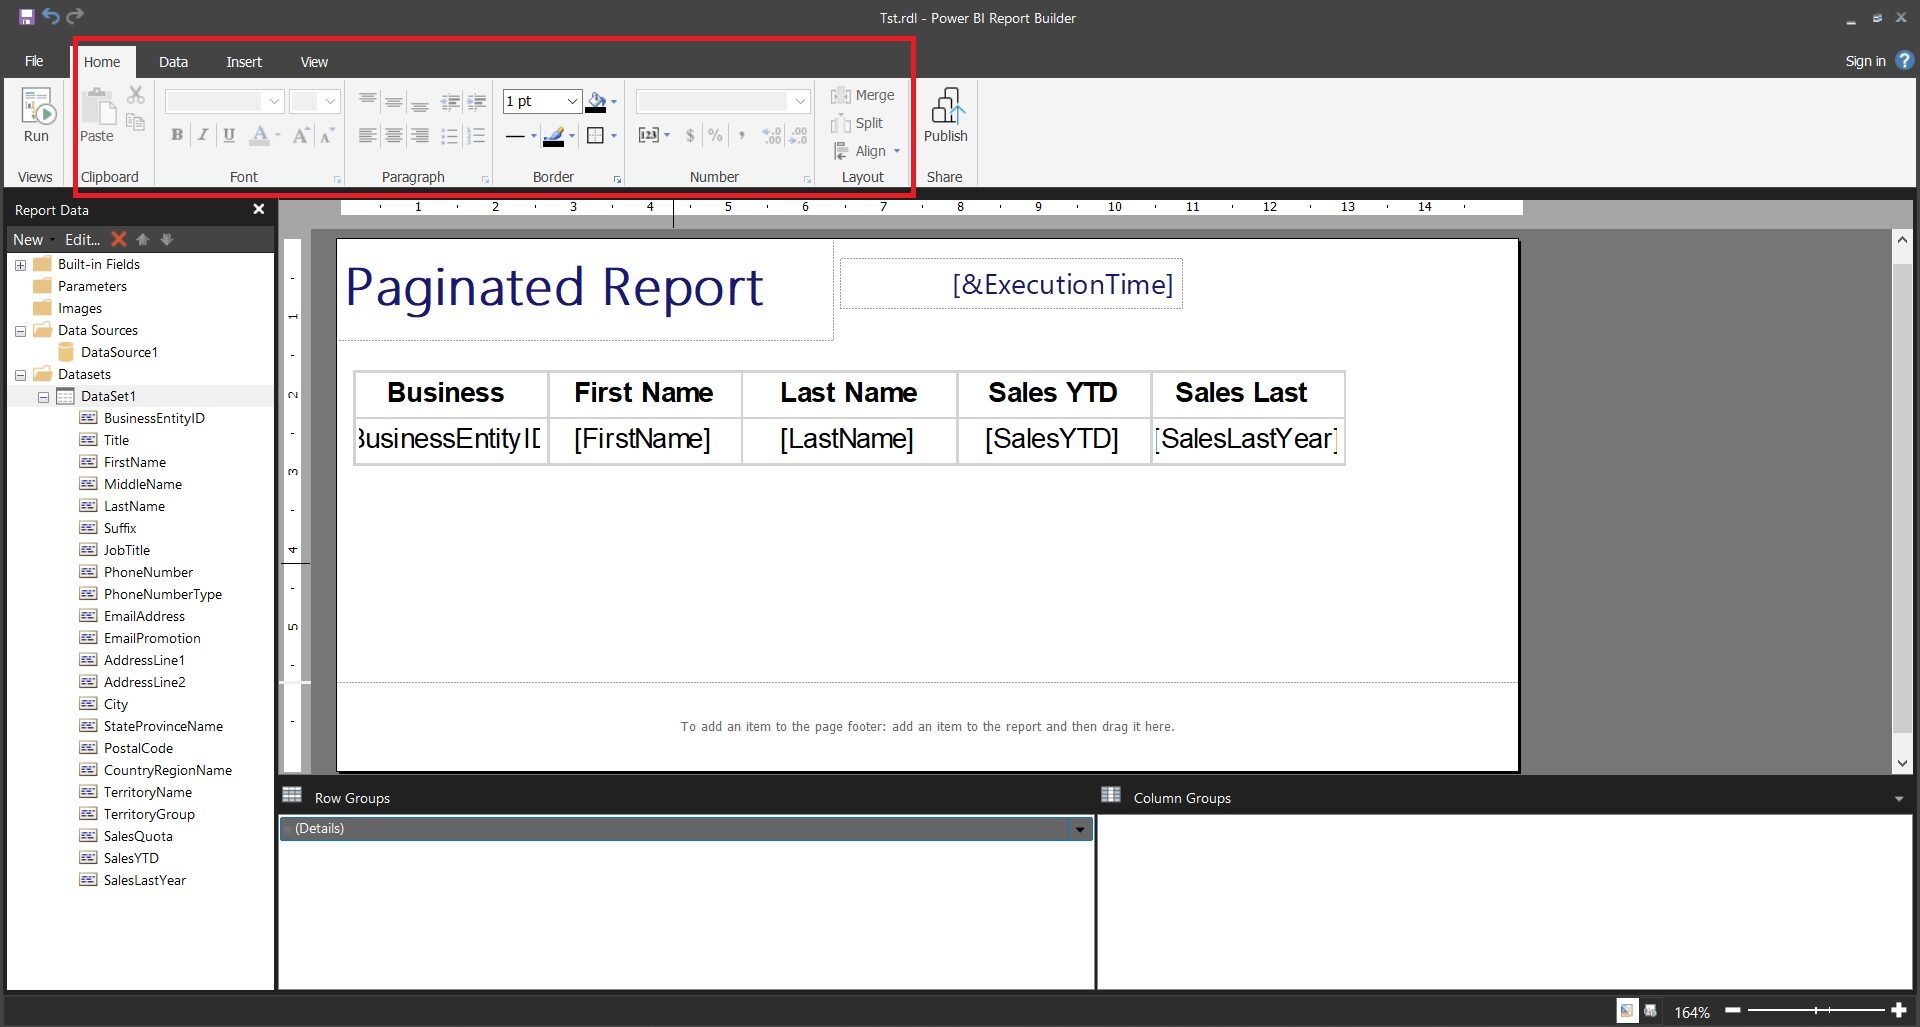
You can format the background and other components of the report.
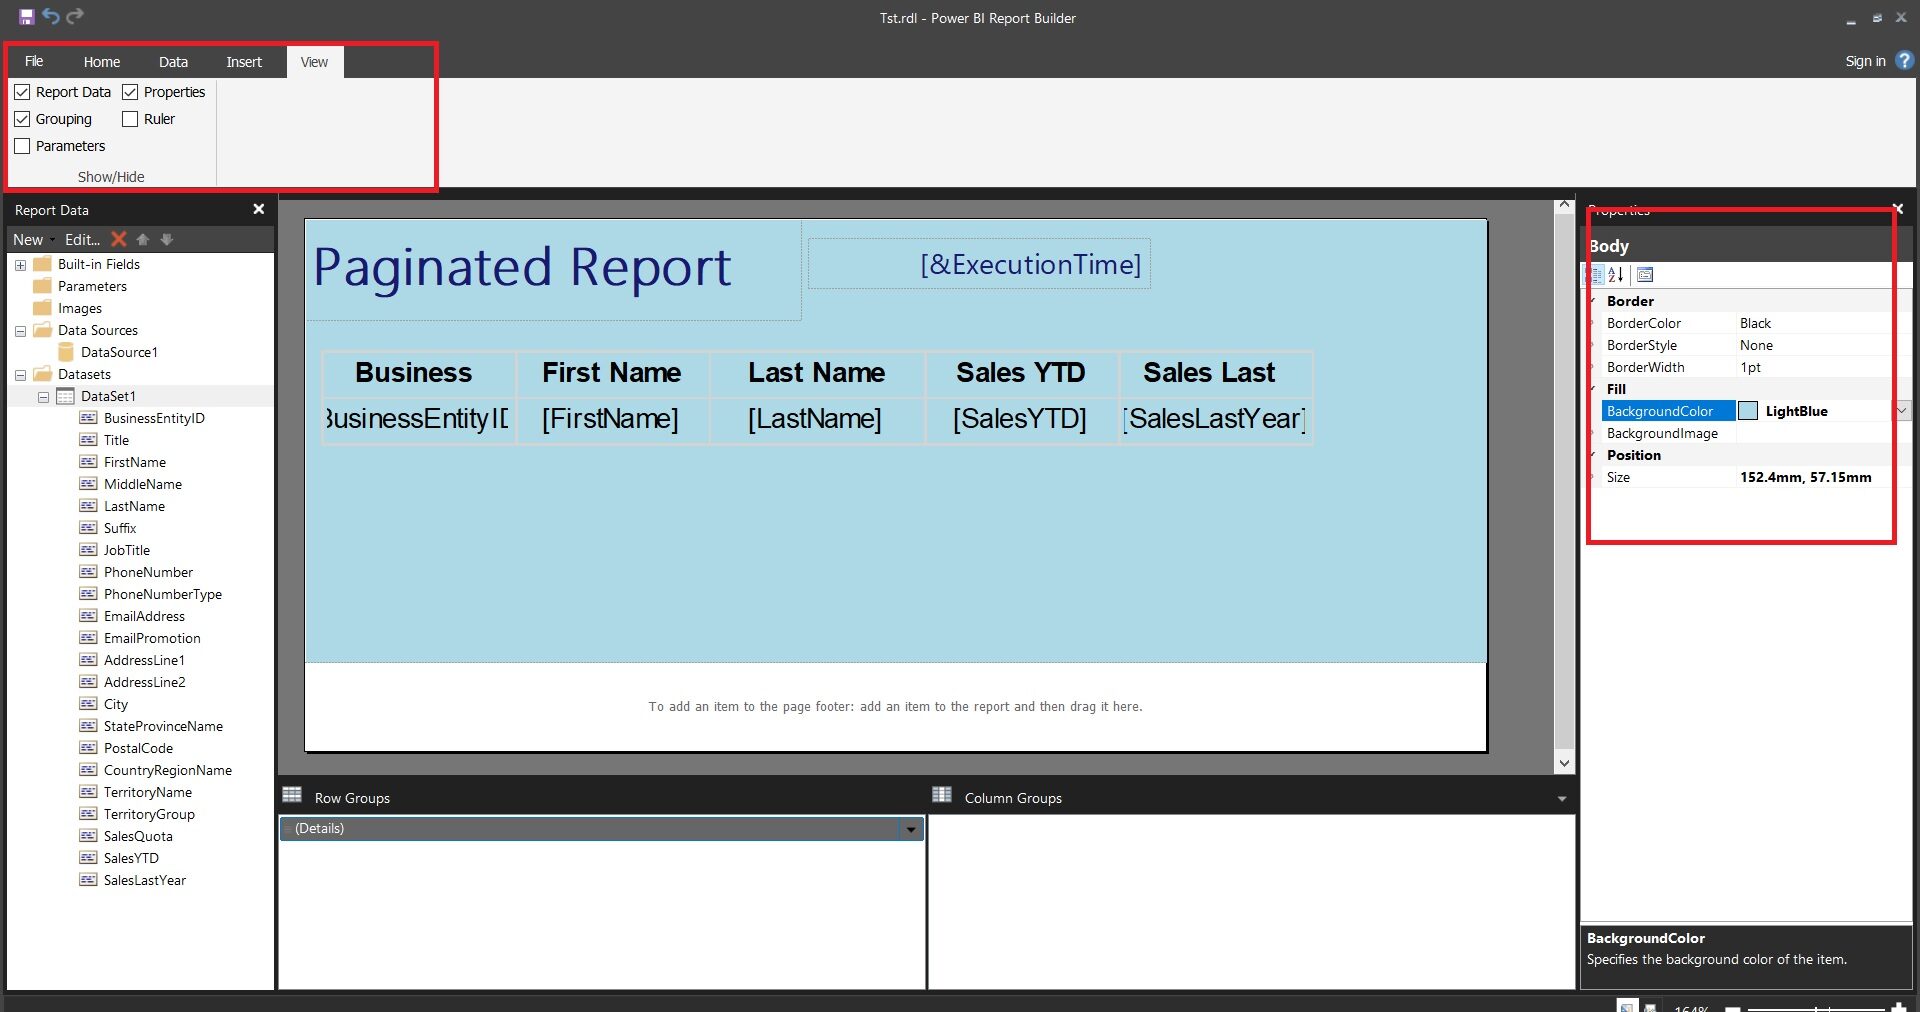
Step 6: Add Report Data
To populate the report with data, you need to define a dataset. In Paginated Power BI Report Builder, click on the “Insert” tab and select “Dataset”. Specify the dataset properties, including the query to retrieve the data from the data source. You can also define parameters to filter or customise the data.
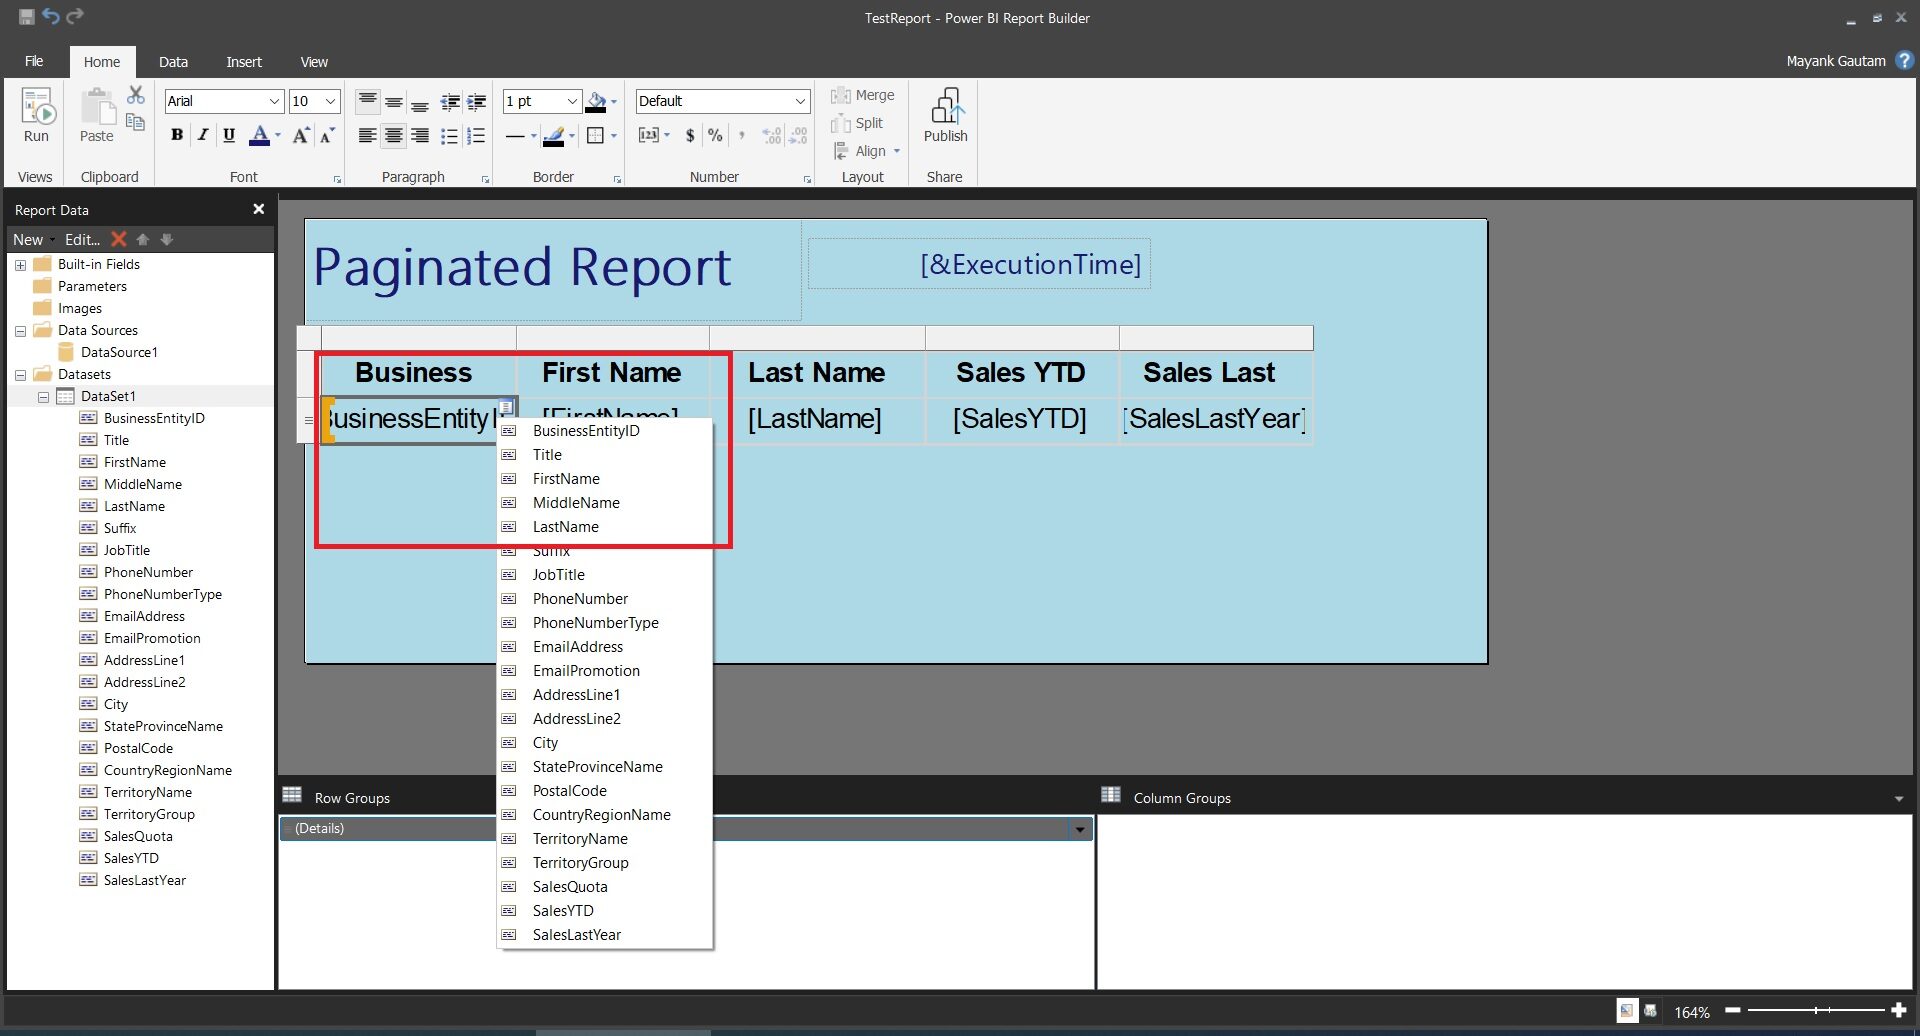
Paginated reports require specific pagination settings. In Power BI Report Builder, go to the “Report” tab and select “Report Properties”. In the “Layout” tab, you can set the page size, margins, and other pagination options. Adjust these settings to match your desired report layout.
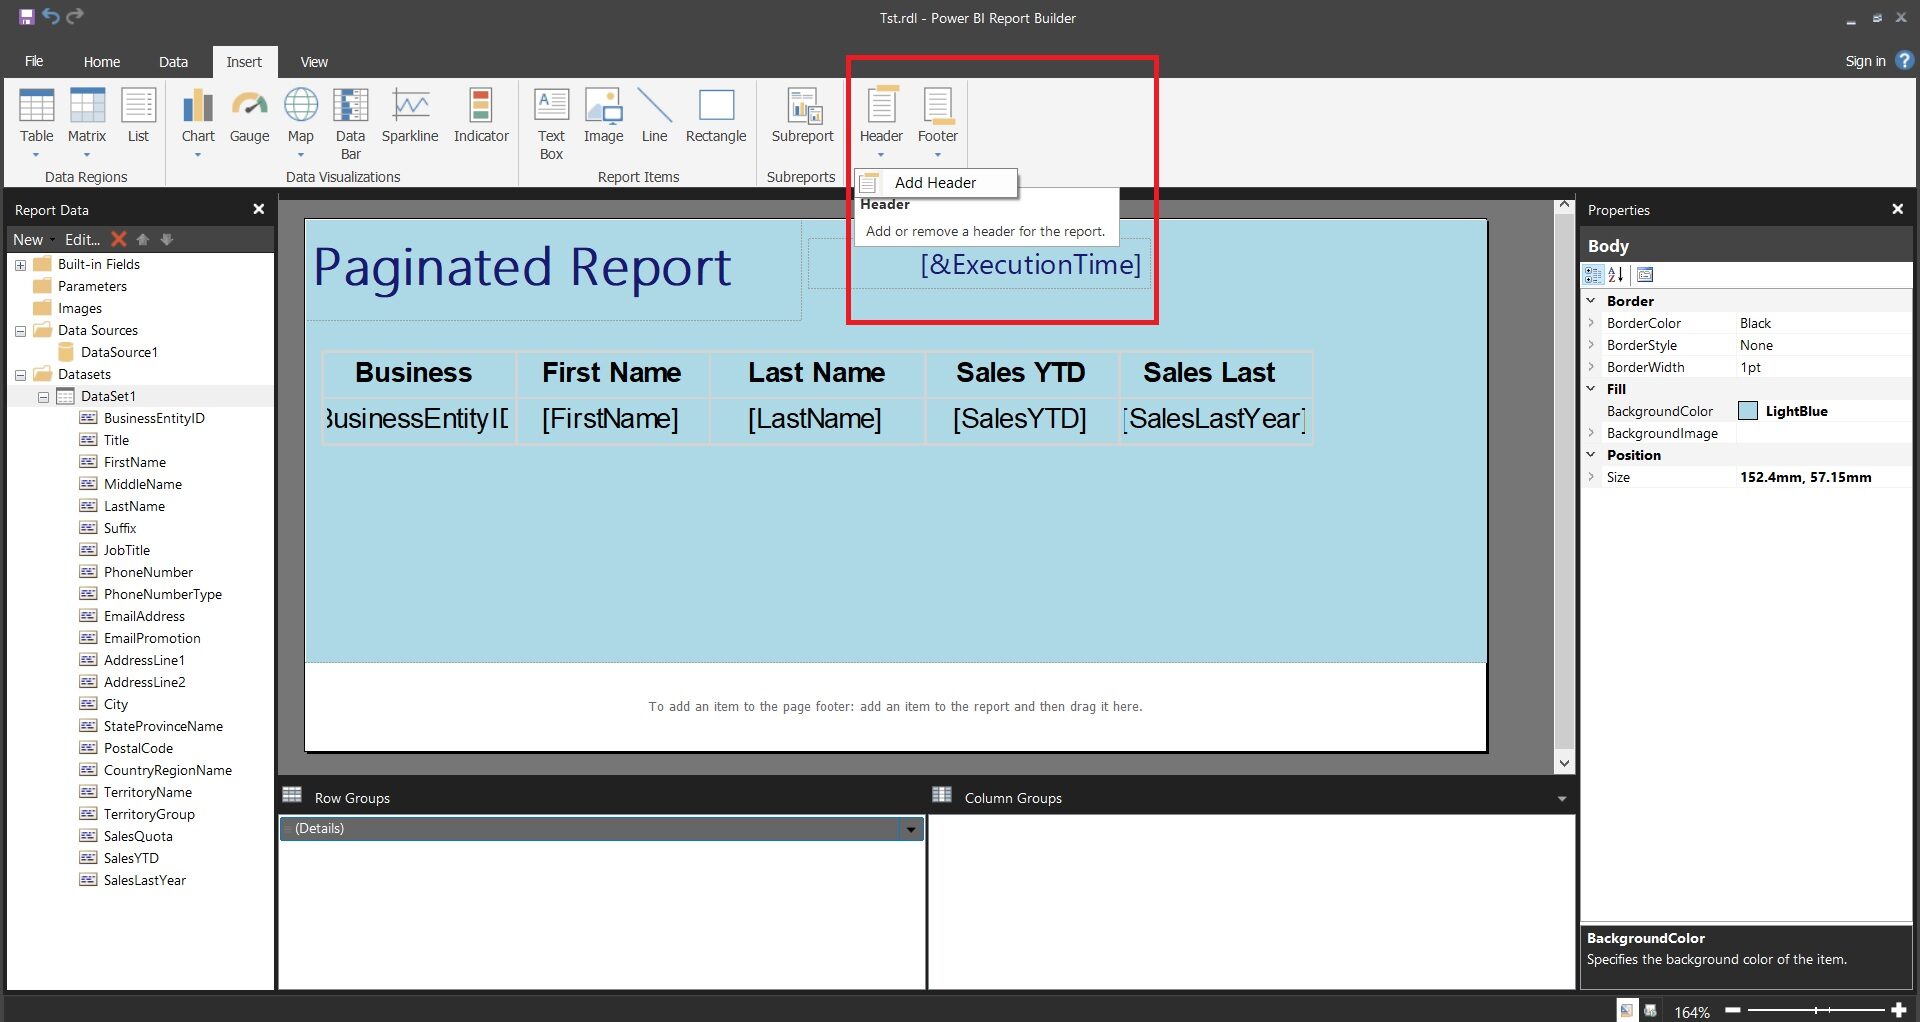
Step 8: Add Report Headers and Footers
Paginated reports in Power BI often include headers and footers for consistent branding and navigation. In Power BI Report Builder, go to the “Insert” tab and select “Header” or “Footer” to add these elements. Customise the headers and footers with text, images, page numbers, or other relevant information.
Step 9: Preview and Test the Report
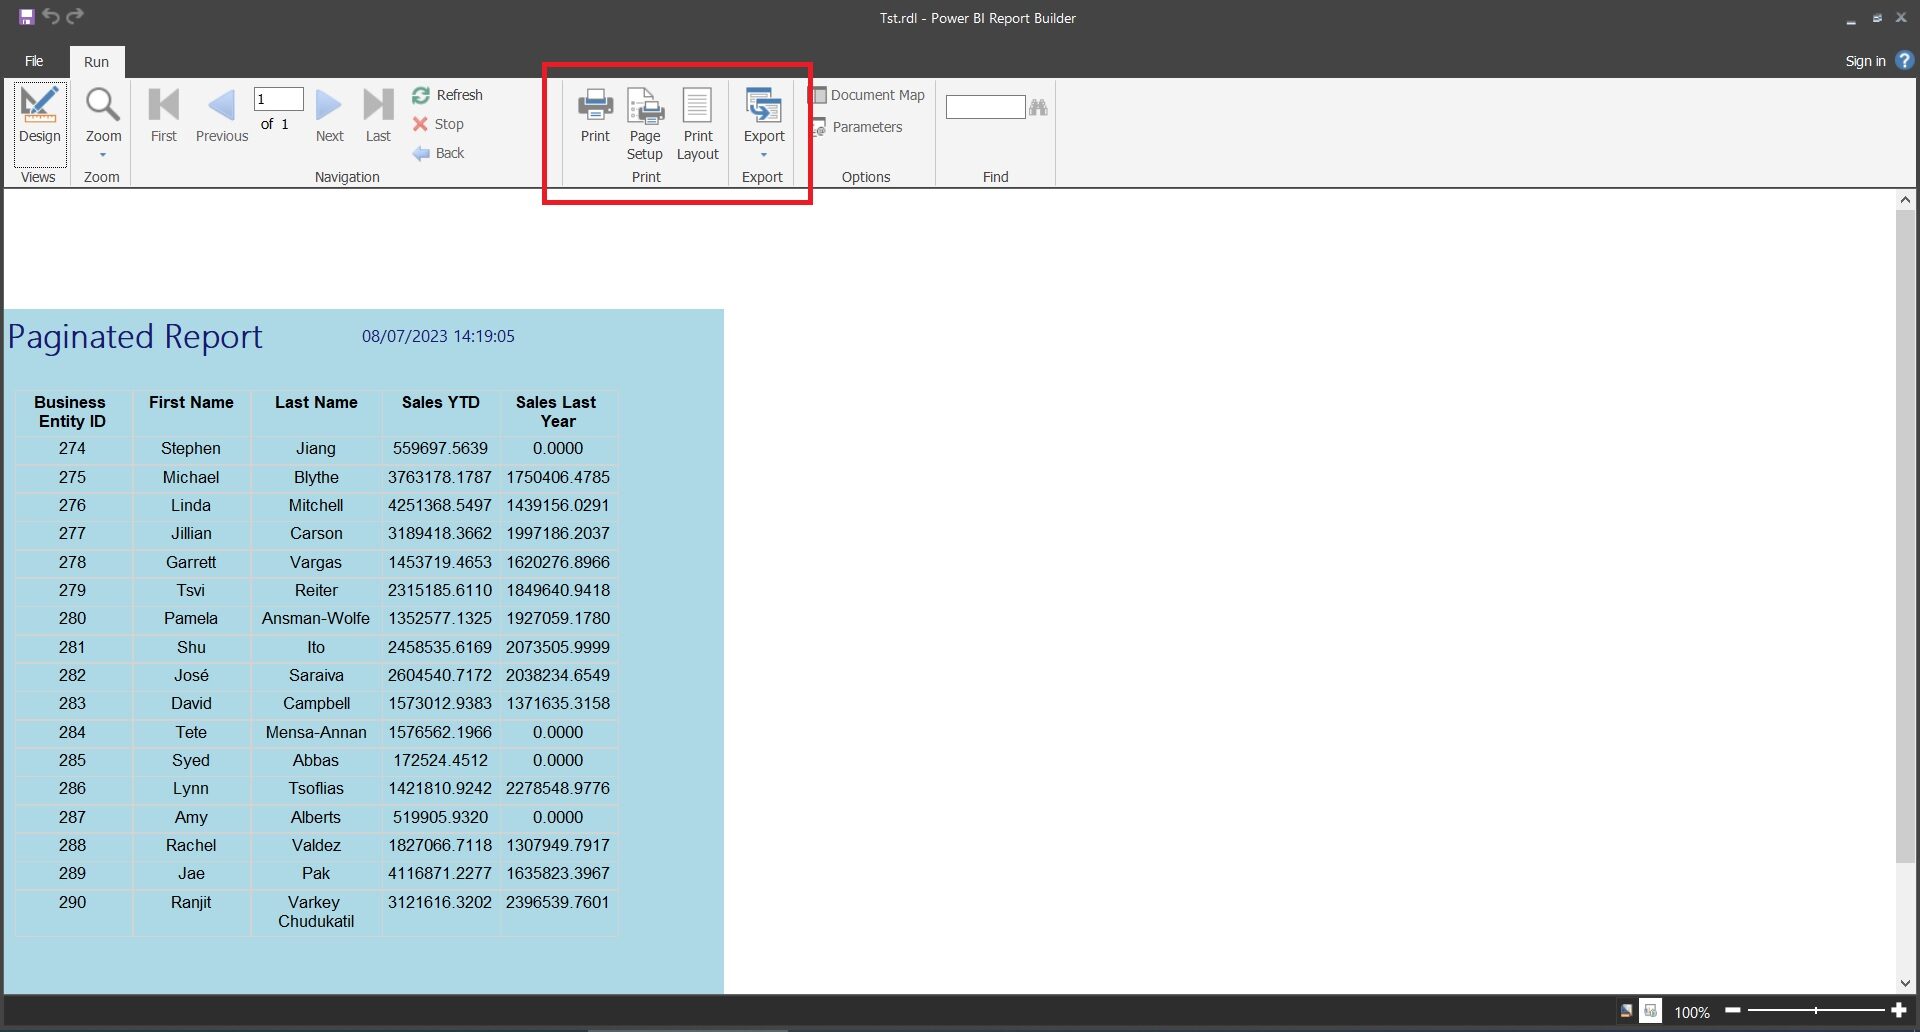
Before finalising the report, it’s essential to preview and test it. In Power BI Report Builder, click on the “Run” tab to see how the report will appear when rendered. Ensure that the data is correctly displayed, the layout is intact, and the pagination is working as expected.
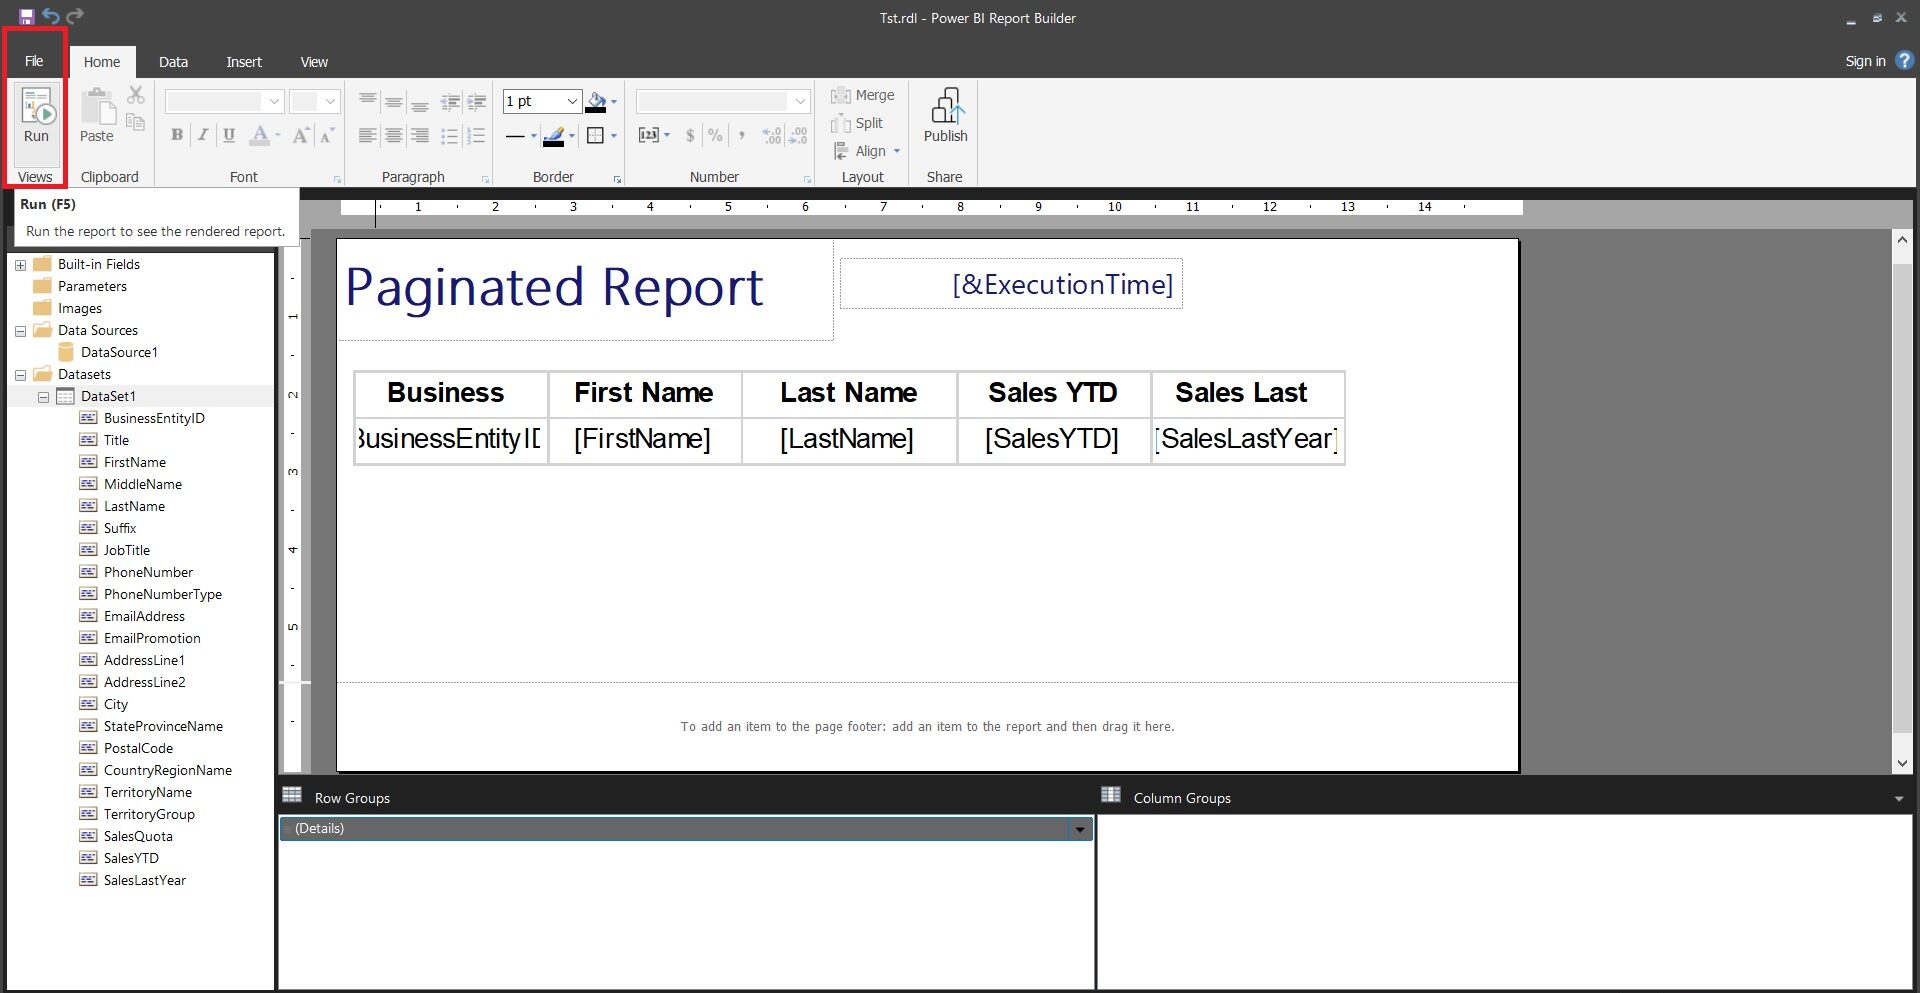
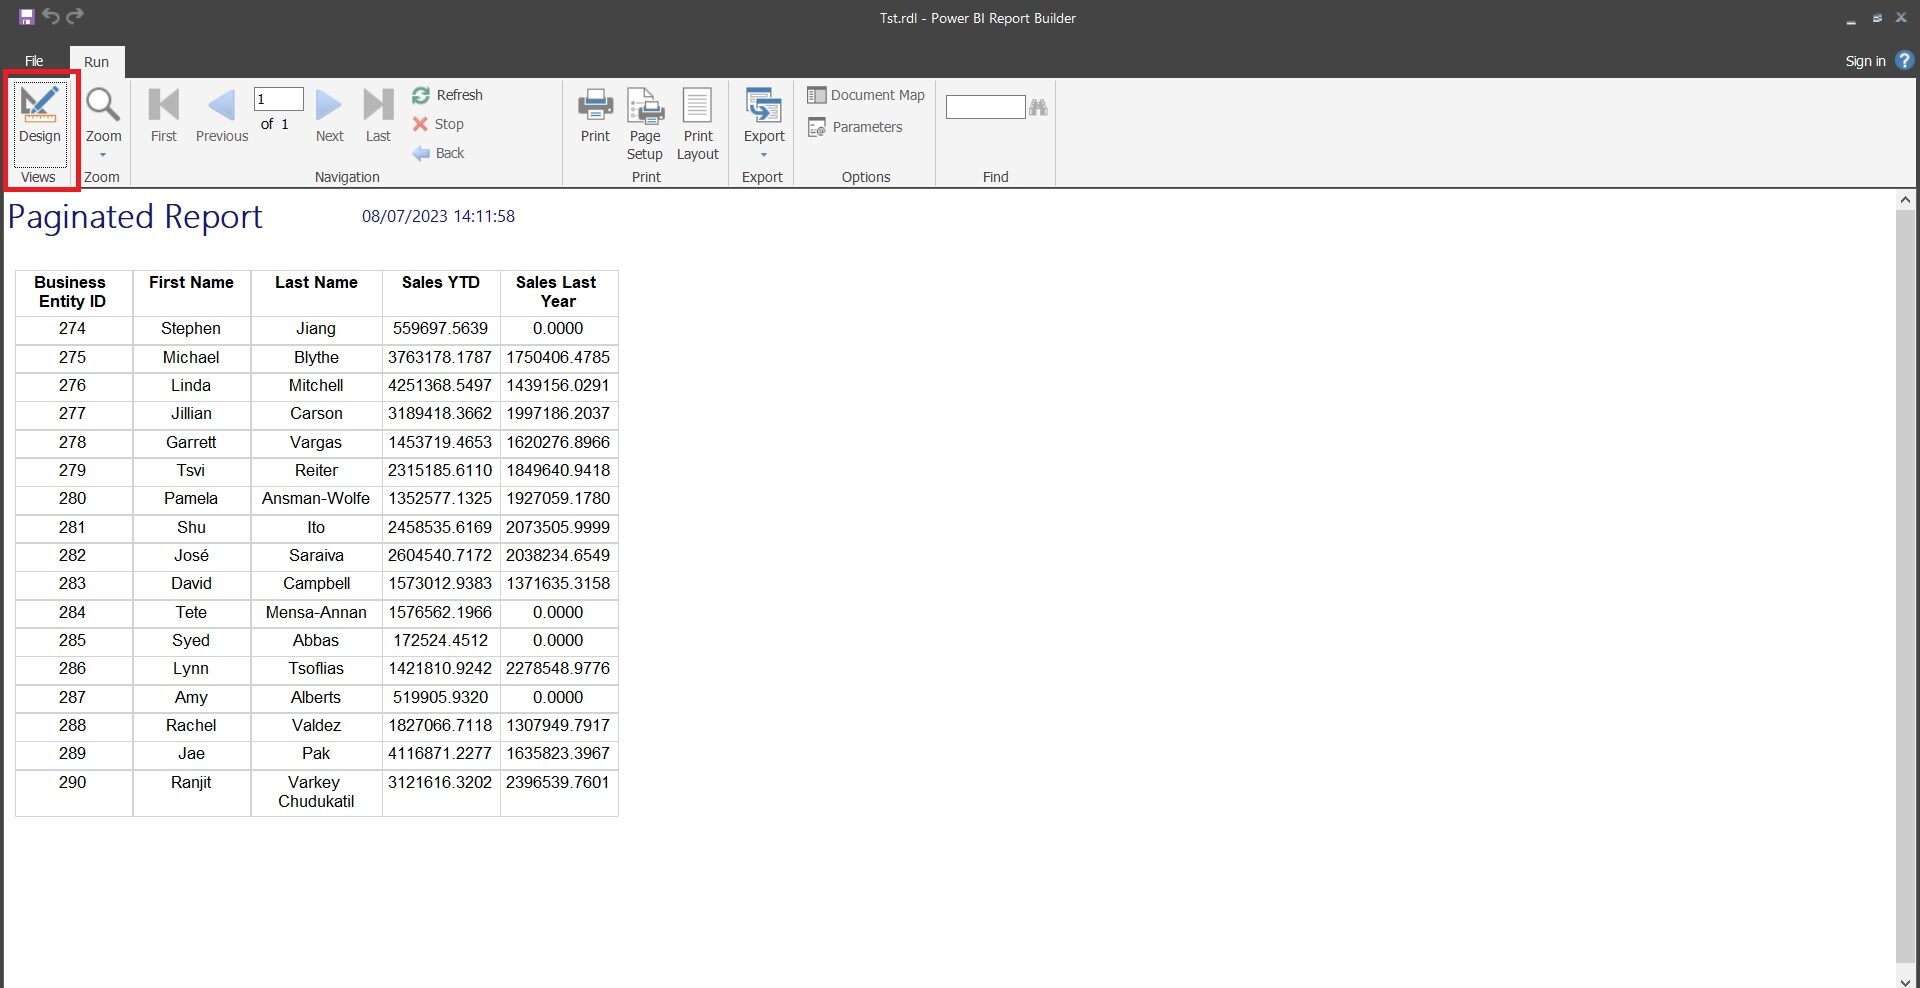
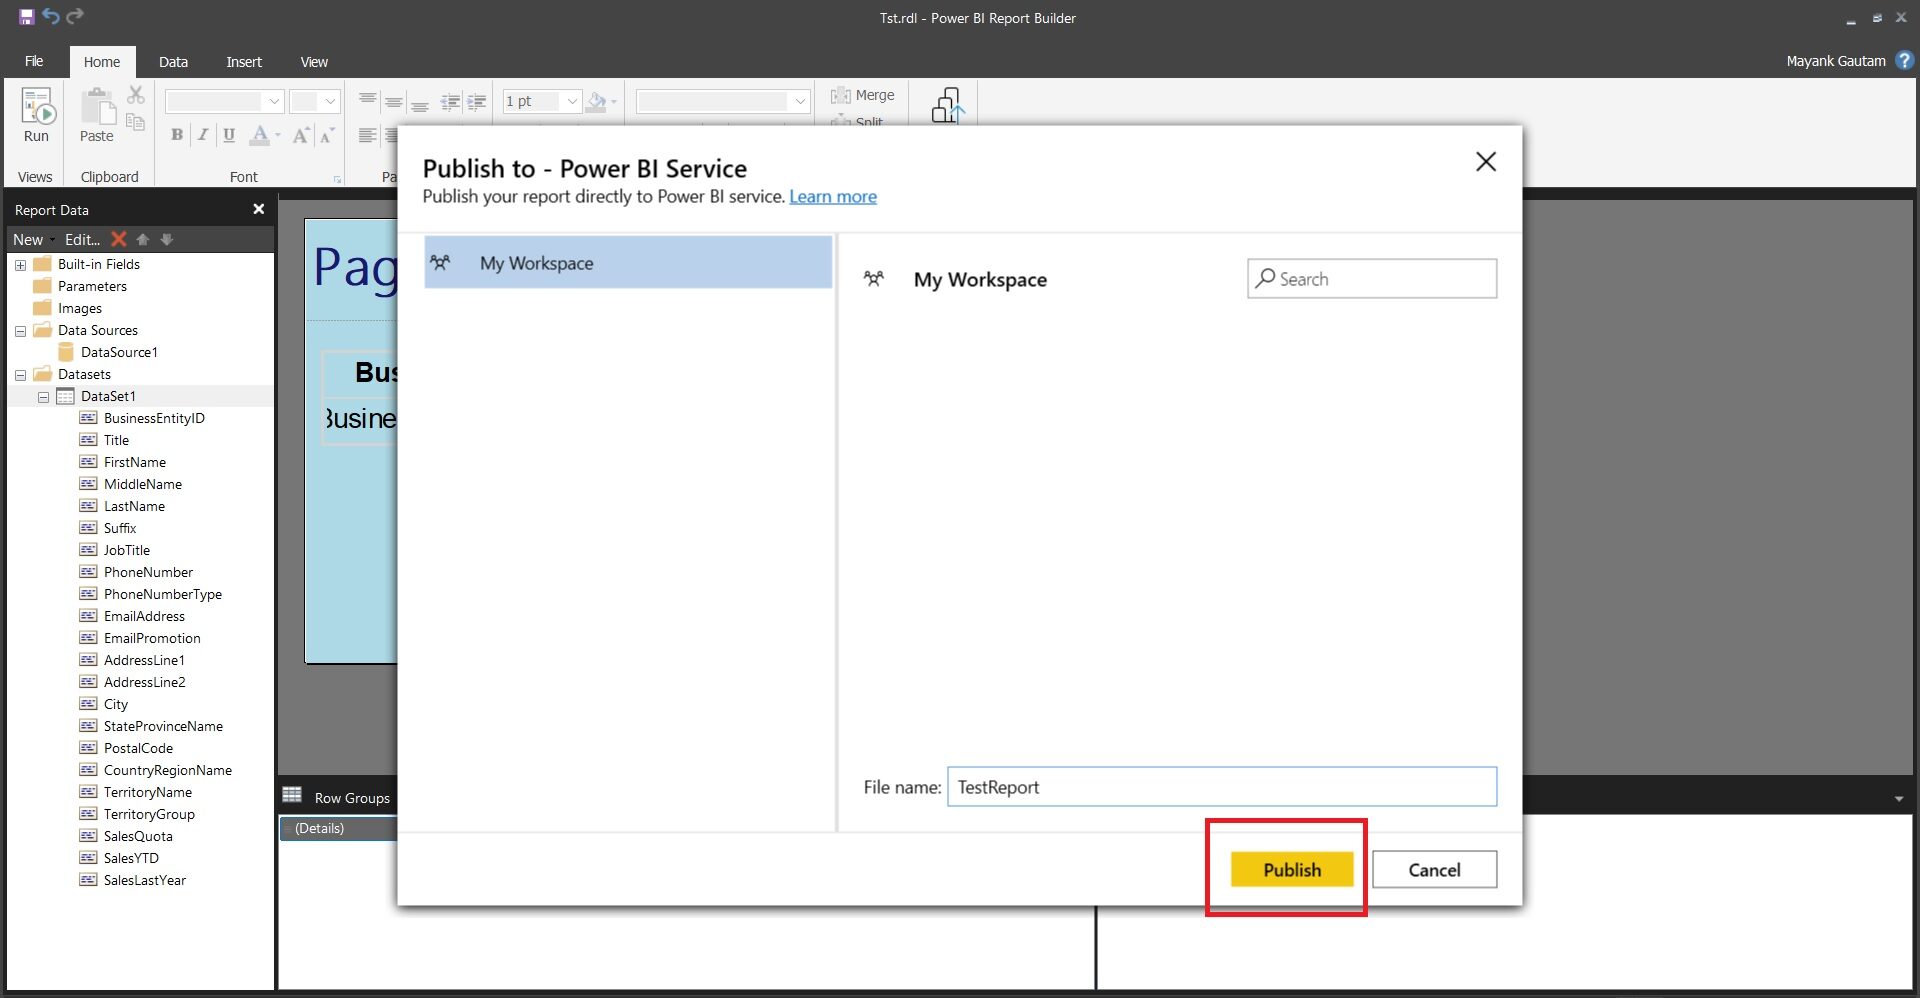
Step 10: Save and Publish the Report
Once you’re satisfied with the report, save it in Power BI Report Builder’s .rdl format. To publish the report to Power BI, go to the “File” menu and select “Publish Report”. Follow the prompts to sign in to your Power BI account and choose the desired workspace or folder to publish the report.
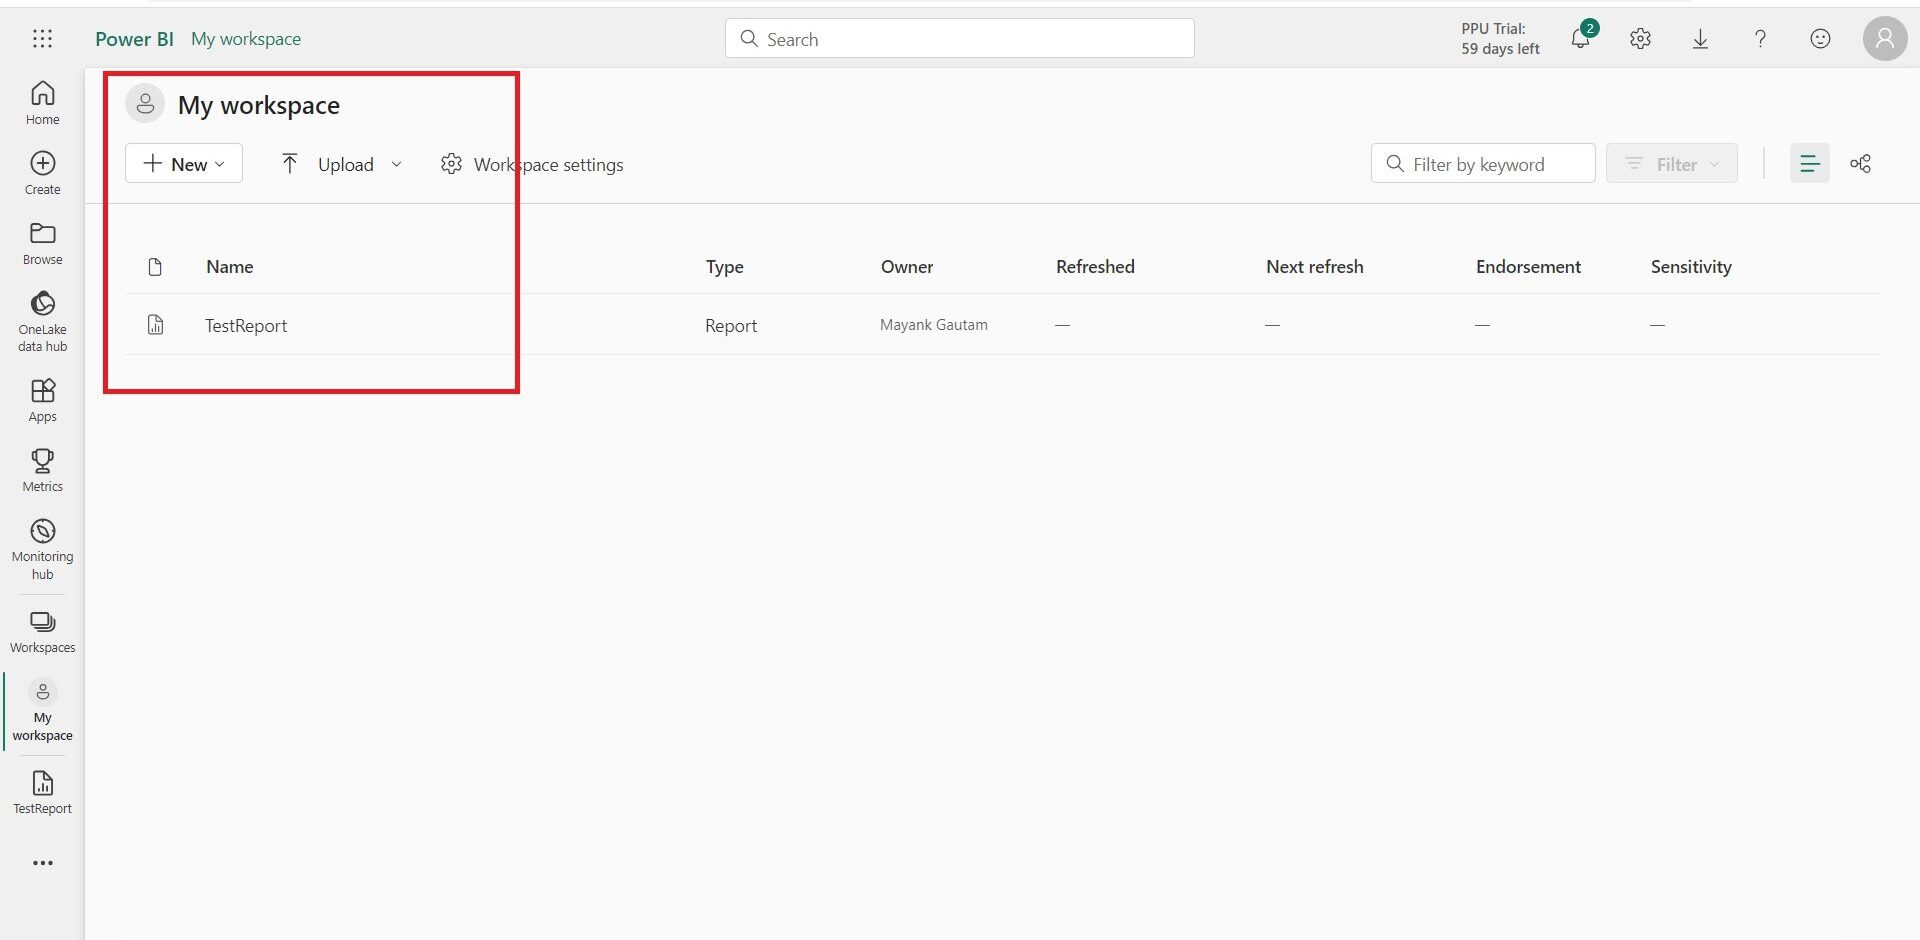
This article has highlighted the overview of Paginated reports in Power BI. Paginated reports in Power BI offer organisations a valuable tool for generating structured, print-ready reports with pixel-perfect formatting. Their advanced features, including precise layout control, enterprise-level security, and data-driven subscriptions, make them well-suited for various reporting scenarios.
From financial reporting to regulatory compliance and invoice generation, paginated reports provide an ideal solution where standardisation, accessibility, and strict formatting requirements are critical. By leveraging Power BI Report Builder, users can create and publish paginated reports that enhance data-driven insights and facilitate effective decision-making processes.
Incorporating paginated reports into your Power BI repertoire empowers your organisation to transform raw data into impactful and professional reports that drive actionable outcomes.