Have you ever thought of how to create a Power BI Project Management Dashboard? What KPIs and layout do you use?
In today’s fast-paced business environment, effective Power BI project management dashboards can be critical for meeting deadlines, optimizing resources, and delivering successful outcomes. Power BI is a powerful tool for creating dynamic project management dashboards that provide real-time insights, track key performance metrics, and enhance decision-making. With the ability to visualize project progress, resource allocation, and risks, these dashboards empower project managers to stay on top of every detail, ensuring that projects are completed on time and within budget.
This article explores how to build Power BI project management dashboards, driving efficiency and transparency in project execution.
Let’s take a closer look at 5 reports VIDI Corp has developed for various businesses in project management, utilizing the power of Power BI.
If you are a service company, project management has a direct impact on your profitability. If your projects take a lot more time than anticipated, your profit margins would become lower. A Power BI project management dashboard would therefore help to analyse what project types go wrong or right.
We recently completed a Power BI project management dashboard for a client who is an event-based company. This client organizes events for various brands and charges clients based on hours spent. They needed a solution to analyze their data and generate various KPIs to help their business understand different performance metrics.
Our Power BI consultants, performed necessary transformations, and created an insightful report for them.
This is an CEO-level view that allows to understand the high-level trends for actual vs quoted hours. This view focuses on the hours spent by resources for clients. It includes a trend line displaying quoted versus actual hours over the past 12 months and highlights the variance between these hours. The months with the biggest discrepancies can be clearly identified through this graph.
The histogram on the right shows the number of events by variance level (e.g. there were 40 events for which the company spent 10% less actual hours as compared to quoted hours)
Additionally, we’ve included a view that compares quoted and actual hours for each resource. A table provides more detailed information about the events, including the number of hours spent at different stages: Pre-Production (PP) and On-Site (OS).

Time recovery is an important KPI which is calculated as quoted hours divided by actual hours. This KPI measures how well the team is able to meet the quoted hour estimates. The project managers are responsible for ensuring that their time recovery targets are met.
This view focuses on time recovery metrics, which are assessed at the event level rather than the resource level. Time recovery is calculated only for individuals who have targets assigned to them.
We’ve included a line chart to display time recovery over time, broken down by salesperson (who in this case are also project managers) and by event.

One other key factor for service company profitability is the split between billable and non-billable hours. The billable hours would be for client work whereas non-billable hours are for admin, sales and management work.
Utilisation was mainly measured through the following graphs
It illustrates the percentage of time spent on billable versus unbillable tasks.

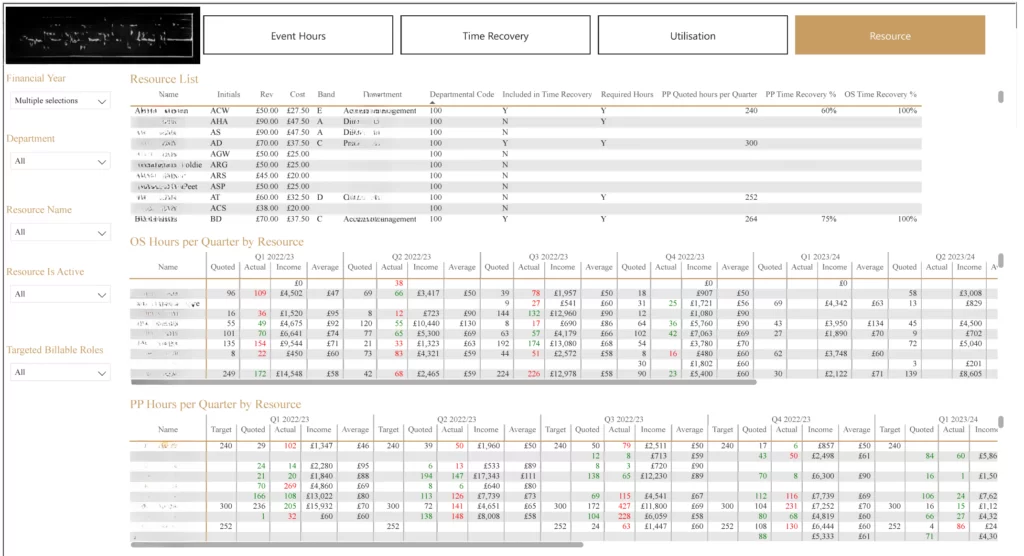
This view offers insights into company resources, which are crucial to any organization. It includes three tables:
Here, OS and PP refer to the different stages of projects: On-Site (OS) and Pre-Production (PP).
This Power BI dashboard was created for project managers as it shows detailed project and task analysis.
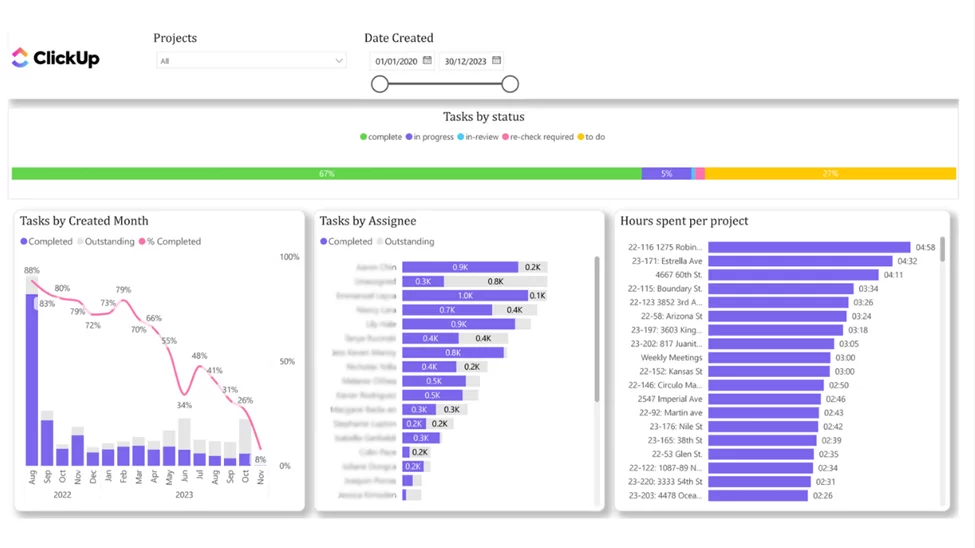
We’ve created a standard ClickUp Power BI dashboards to assist businesses in project management. This involved connecting to the ClickUp database via our custom connector and generating various insights about tasks, including:
You can refer to our detailed article about the customized connector and dashboard here.
If you’re having trouble with your ClickUp projects and need assistance with data collection and report generation, reach out to us at VIDI
In this case our client was a project manager overseeing project execution, ensuring goals are met and resources are optimized. Our Power BI project management dashboard was crucial for tracking progress, making informed decisions, and ensuring success.
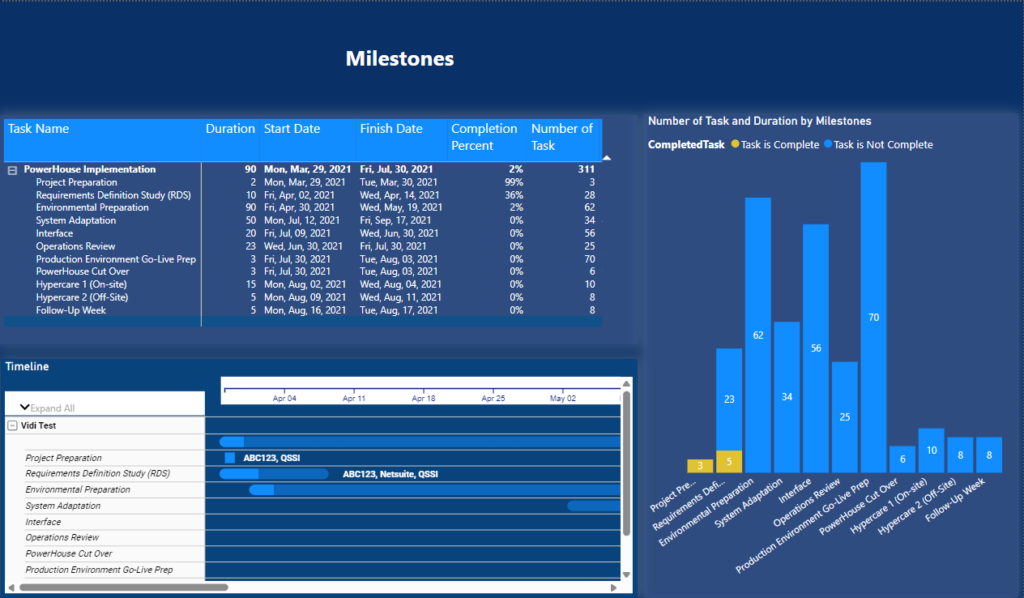
This dashboard offers project managers an overview of tasks and their completion status:
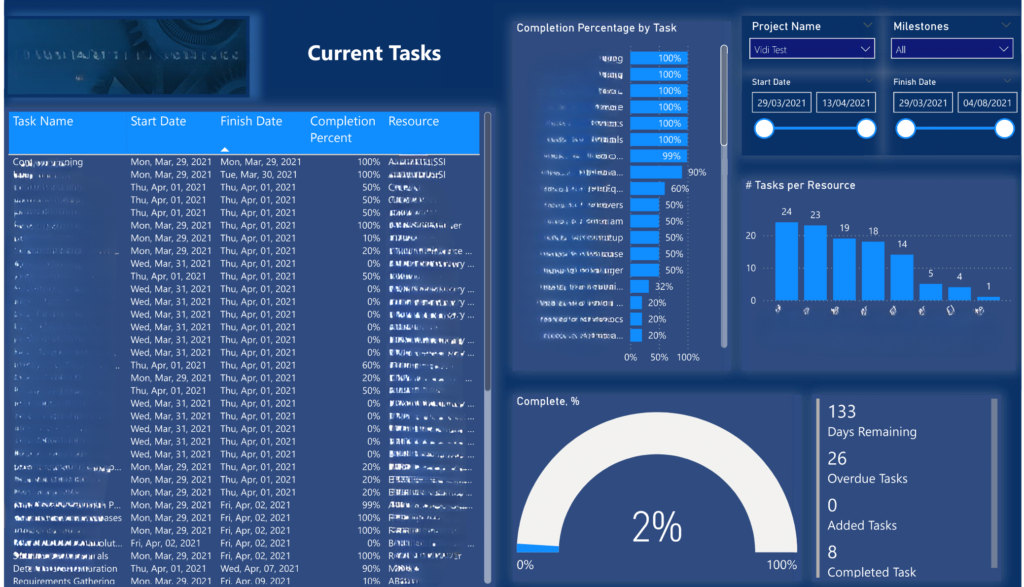
This view offers additional KPIs and charts for project managers to delve deeper into tasks by duration, completion status, and resource allocation. We’ve also included a Gantt chart to visualize tasks within the selected time frame, providing a clear view of their status
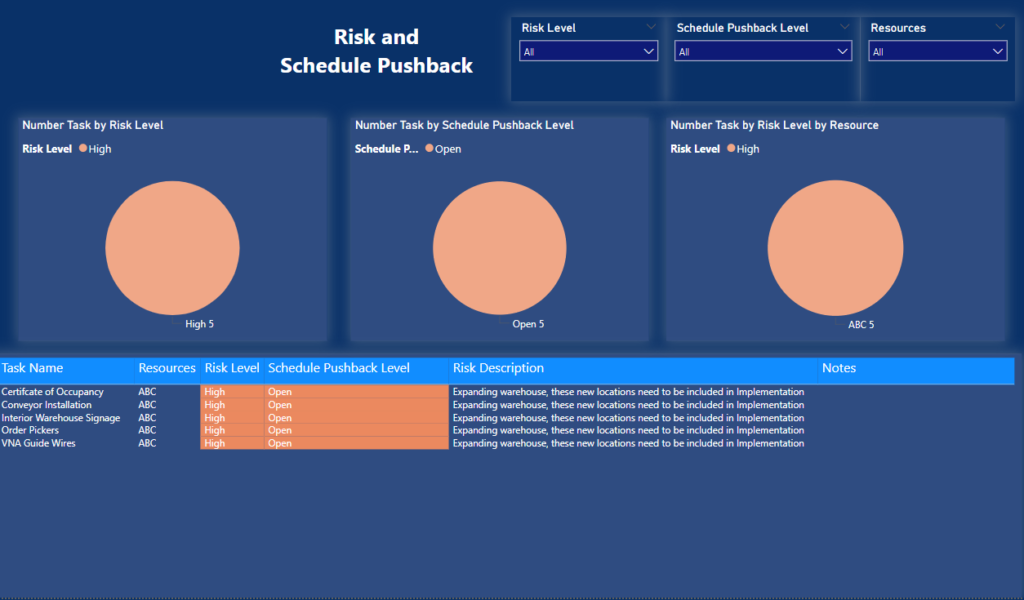
This view focuses on assessing the risk levels of tasks and identifying those with high risks. It provides project managers with a clear overview of high-risk tasks and includes a detailed table for further information to aid in decision-making.
As project managers play a crucial role in project management, if you need a tailored report or view for your PMs, reach out to VIDI. We’ll create a customized and insightful Power BI view to meet your specific needs.
You can also watch our video here to see how we assisted a client with a data-driven approach to project management:
Microsoft Planner streamlines task management by organizing projects, assigning tasks, and tracking progress. When integrated with Power BI, it enhances visibility into project expenses, enabling businesses to track costs, analyze performance, and make data-driven decisions for better financial control.
Challenge
Since Microsoft Power BI doesn’t have a direct connector for Microsoft Planner, we faced challenges in generating reports. Our team came up with an innovative solution by using Microsoft Power Automate to extract data from Microsoft Planner and store it in a SharePoint list. This SharePoint list then acted as a database for Power BI, enabling the creation of various KPIs and charts for effective reporting. We used the following steps to extract data from Microsoft Planner and create the Power BI project management dashboard.
This setup automatically extracted and stored Microsoft Planner data in SharePoint using Power Automate.
Once the data was available in Power BI, we developed the following report to deliver key insights and KPIs related to the tasks in Microsoft Planner. These reports offer a detailed view of task progress, deadlines, assignments, and overall project performance.
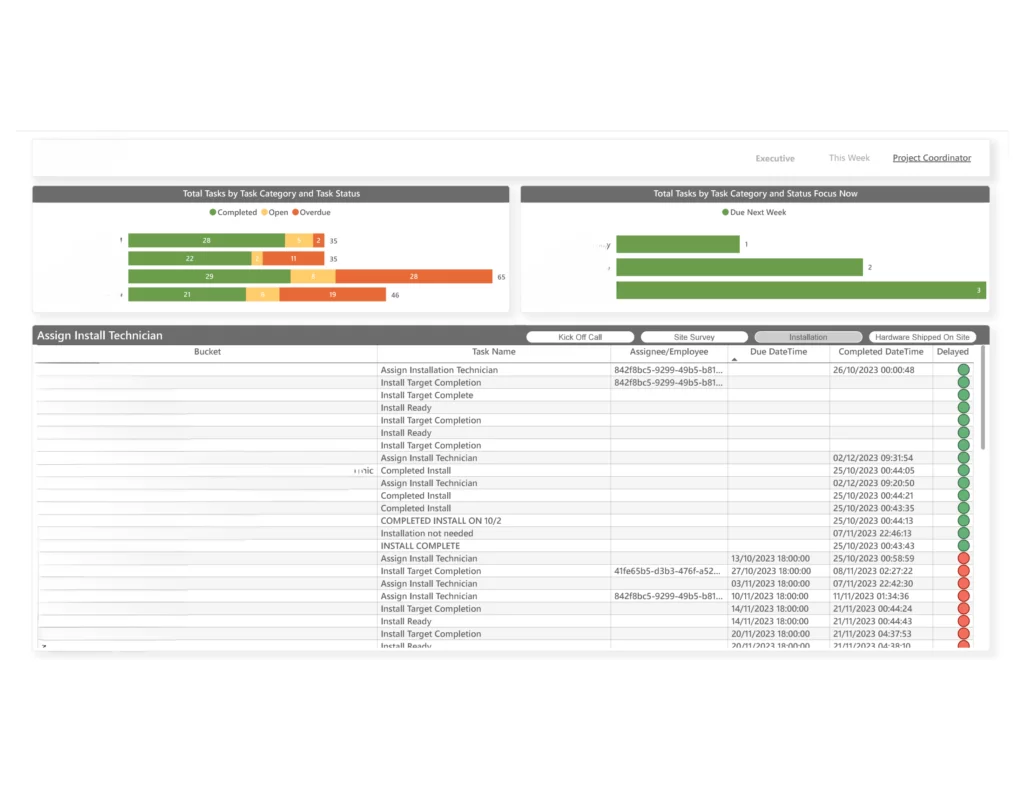
This view offers a comprehensive view of tasks in Microsoft Planner, including the number of tasks by status, by assignee, and open tasks by bucket. Additionally, we’ve created a Gantt chart view to track the progress of each task across the time frame, providing a clear visual representation of project timelines and milestones.

This view is designed to track similar KPIs for the current week only. It helps businesses quickly identify task statuses and performance within the current week, providing a focused snapshot of ongoing activities and progress

This view includes a table chart detailing task data with important columns such as bucket, task name, due date, and delayed status. Businesses can export this data for further analysis. Additionally, the view offers KPIs for task categories and highlights tasks that are due in the upcoming week, helping to focus on upcoming priorities
At VIDI, we excel not only in creating insightful dashboards but also in integrating data from various sources into databases that aren’t directly connectable to reporting tools. If you’re facing challenges with manual data exports or need to automate processes, reach out to us. We can help streamline the process and develop customized project management reports tailored to your needs.
Managing financial data in project management is crucial for ensuring projects stay within budget and achieve profitability. Key financial aspects include cost tracking, budget allocation, and forecasting expenses. Accurate financial insights help project managers make informed decisions and avoid overspending.
Power BI enhances this process by offering dynamic visualizations, real-time data updates, and customizable dashboards. These features enable businesses to track expenses efficiently, compare actual costs against budgets, and monitor financial performance, leading to better financial control and successful project outcomes.
We developed a customized Power BI project management dashboard for one of our clients to track their financial metrics in project management. As shown in the screenshot below, we’ve included various KPIs such as Actual Cost, Approved Budget, and Remaining Budget to offer project management a clear, high-level overview of their financial performance.
In addition, the graphs offer a detailed view of actual and forecasted costs across various dimensions, helping businesses better understand their project management finances. These metrics can be analyzed by month, organizational hierarchy, or request ID. We also provide a view that compares actual costs with approved budgets, broken down by entity or request, allowing users to easily spot variances and manage financial performance more effectively.
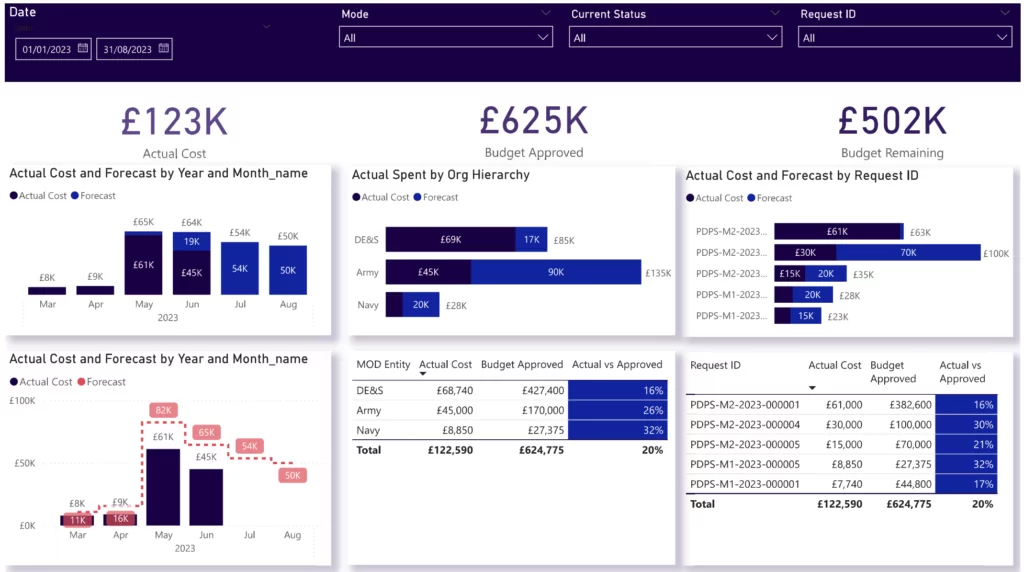
We used dummy data in the above charts to maintain data confidentiality and protect sensitive information.
If you’re looking to track your financial expenses for project management in Power BI and need a customized dashboard, feel free to reach out to us. We can create tailored views to suit your specific needs, providing you with clear insights into your project’s financial performance.
Effective reporting is vital for successful project management, providing critical insights into progress, resource utilization, and financial performance. Power BI enhances this by offering dynamic visualizations and real-time data analysis.
At VIDI Corp, we specialize in not only developing comprehensive reports but also in streamlining and automating data pipelines to ensure seamless and accurate information flow. Our expertise helps businesses gain actionable insights and optimize their project management processes.
If you need a customized reporting solution or assistance with data automation, reach out to VIDI Corp for tailored solutions that meet your business needs.
![]()
![]()
![]()