You’ve created a project in SEMRush, linked it to your website, and now you’re receiving tons of data about your website’s performance? It’s hightime you use SEMRush Looker studio template to visualise your data.
Of course, your SEMRush data is eye-opening and valuable, but without a dashboard to manage it all in one place, it becomes overwhelmingly discouraging to analyze and utilize for SEO progress.
The SEMRush Looker Studio template helps you to:
In this blog, we’ll hold your hands and walk you through the process of creating such SEO Dashboards with your SEMrush data.
Table of Contents:
STEP 0: This assumes that you’ve set up a SEMrush project with the applicable SEMrush tools to gather data on the SEO metrics you want to track on your website (e.g., organic traffic, keyword rankings, backlinks)
STEP 1: Sign in to Looker Studio with your Google Account. Once you sign in, you’ll be directed to the home page where you can customize templates or create a report from scratch.
STEP 2: Create a new project in Looker Studio by clicking the tile with a plus sign. This will take you to a blank report page. A tab will come up prompting you to select a data source.
STEP 3: Search for SEMrush or scroll through the partner connectors list and select one of the available SEMrush connectors.
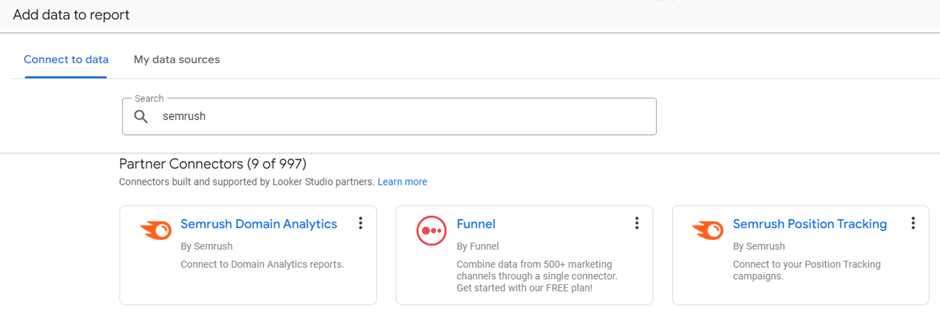
There are three standard Semrush connectors in Looker Studio and you can use either or all of them in the same report depending on the metrics you want to track.
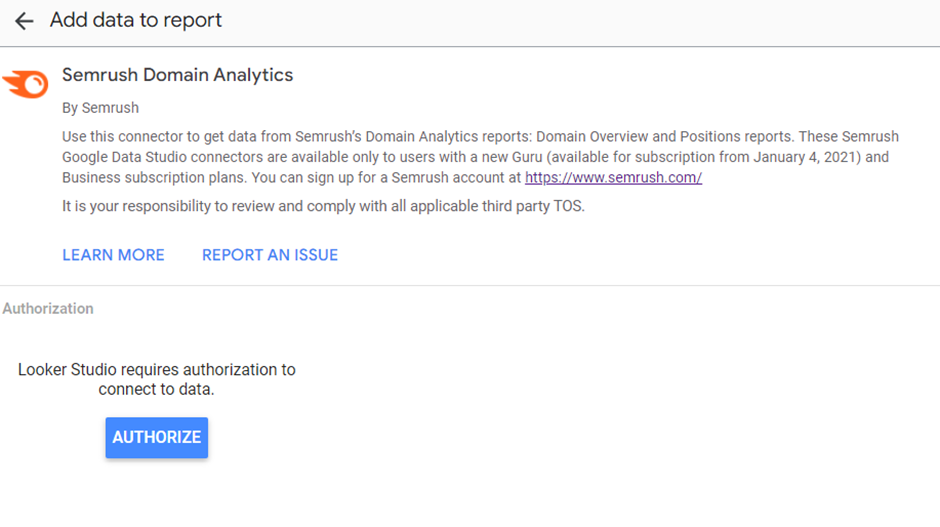
STEP 4: Once you select a SEMrush connector, you’ll see a section asking you to authorize the SEMrush-Looker Studio connection using your Google credentials. Click on ‘authorize’ to do this.
STEP 5: Next, the data source tab will disappear and you’ll see only a blank report page with two panes on the side – the chart pane and the data pane. You can optionally add another SEMrush data source/ connector by clicking ‘add data’ under the data pane. Drag and drop data visualizations (charts, graphs) from the chart pane to build your dashboard. You can add as many pages as you need. Customize the visualizations to display the chosen SEMrush data.
An SEO dashboard/report is more or less a central hub that gives you a unified and organized view of all the SEO metrics, KPIs (Key Performance Indicators), and data available to you.
Conveniently, SEMrush provides SEO report templates to kick things off but the pre-set metrics in these templates might not be the most impactful for your website.
So, it’s always a good idea to build a custom SEO dashboard to avoid focusing on the wrong things andmissing out on what truly matters to your specific SEO goals.
But you see, the thing is building a customized SEO Dashboard can be a double-edged sword. While it offers lots of benefits, if not done properly, it can be counter-effective for your SEO strategy.
That’s why we’ve come up with some best practices for building effective customized SEO dashboards/ reports for your business.
Here at Vidi, we help you make the most of your SEO data using these best practices:
Other best practices include:
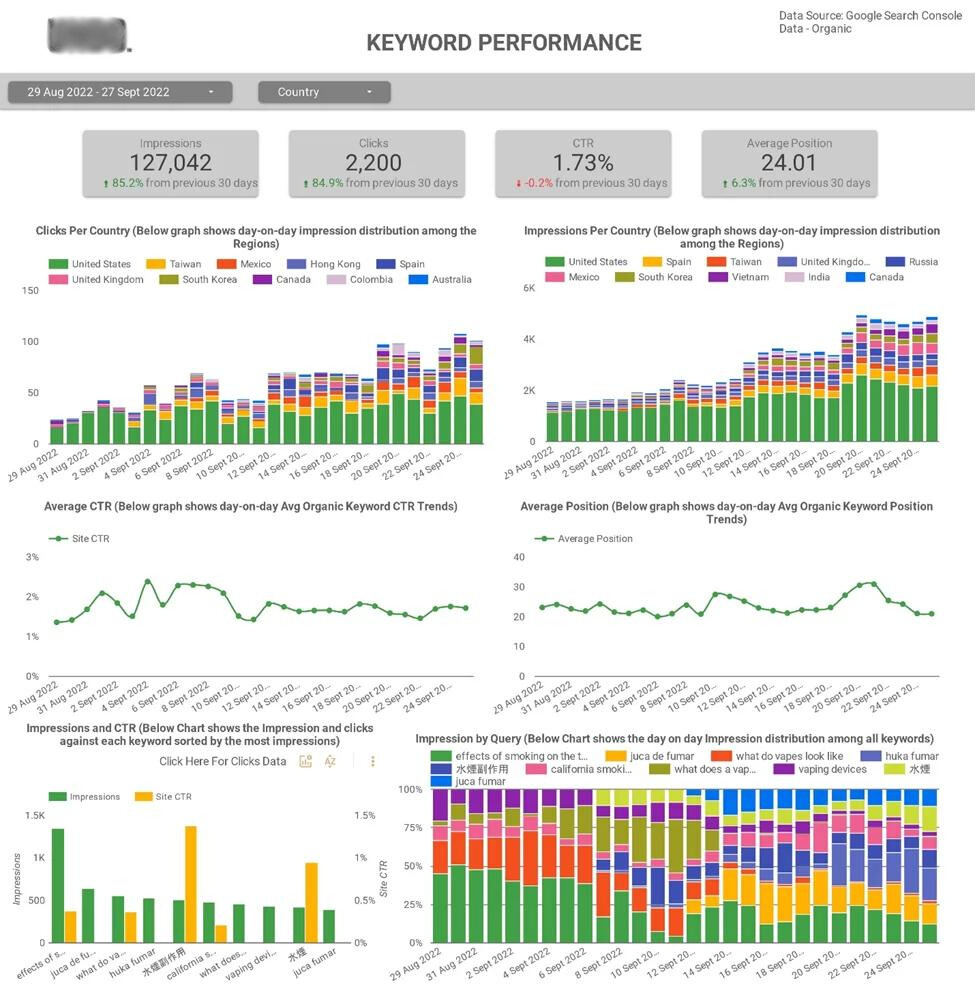
The dashboard above gives you a central view of your website’s keyword performance.
Among other metrics, it tells you in real-time, how many impressions and clicks your website has gotten based on any date/period/ country of your choice and even indicates if there’s been an overall increase or decrease. These are key indicators of your website’s keyword performance.
At one glance, you can see whether your CTR and SERP ranking are improving or declining over time. You can also see the keywords that are driving the most traffic to your website.
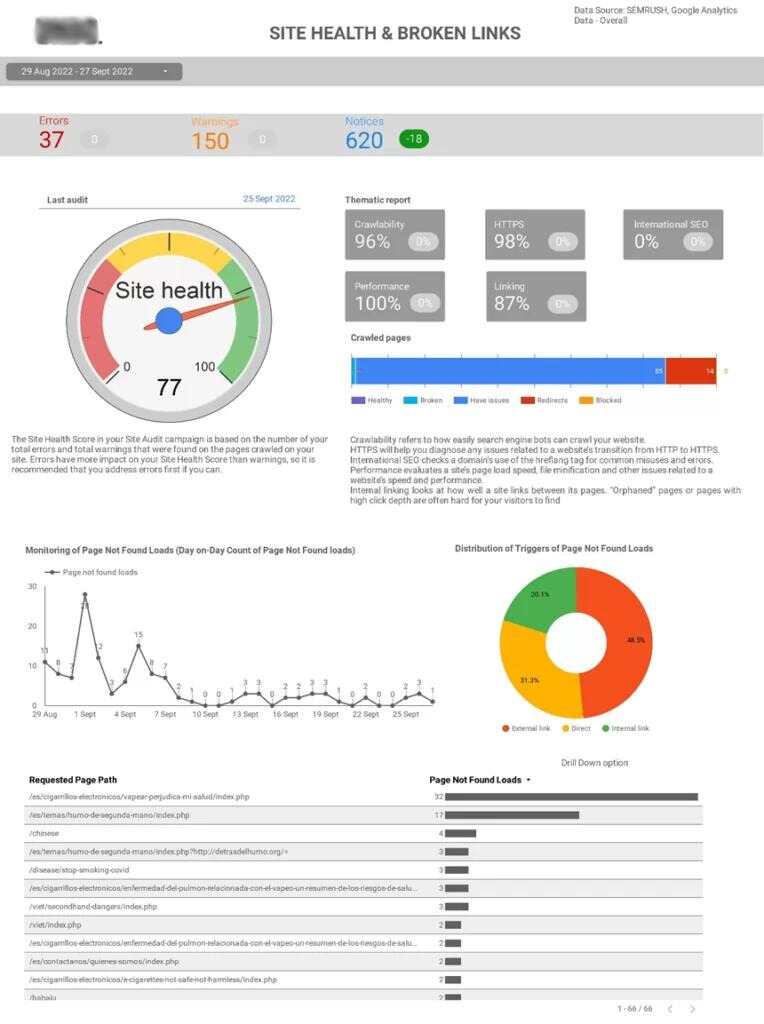
This dashboard gives you insights on another important aspect that can make or break your SEO strategy – site health and broken links. It lets you track KPIs like your site’s loading speed, ‘page not found’ errors, overall site health, and so on. With it, you can know what issues to fix on your website to improve your SEO.
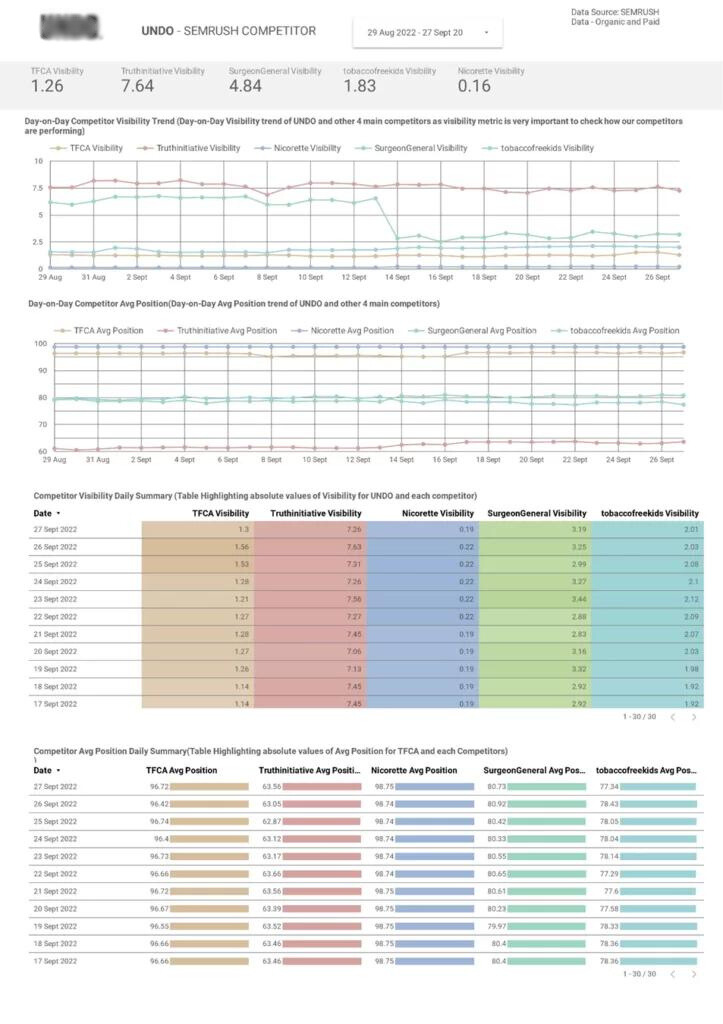
The Competitor Dashboard allows you to compare your SEO progress with that of your competitors. Getting ahead of your competitors in terms of SEO is a great sign that your SEO efforts are working.
The dashboards above are only examples of what we’ve done at Vidi. Our team of professionals can work with you to build a bespoke SEO dashboard for affiliate marketing tracking software or report with SEMrush data that laser-targets your unique business goals and delivers real results.
Vidi completes your winning SEO Strategy.Yes, we don’t just build dashboards, we build lasting success.
Ready to see the value our SEMRush Looker studio template can add to your business?
![]()
![]()
![]()