With Vidi’s Custom Salesforce Reports Power BI Connector
If your company uses Salesforce to manage its customer data, you might have tried connecting such data with Power BI to create dashboards.
This is typically meant to be a straightforward process as Power BI provides two connectors for seamless integration with Salesforce data:
But the fact that you’re reading this means you’ve probably experienced firsthand how the process quickly becomes complicated or inefficient when working with massive amounts of data.
Let’s assume you need to build Power BI dashboards using large amounts of salesforce data. I’m talking tens of thousands to millions of rows.
Per usual, you wouldn’t need to import the entire raw datasets for each dashboard.
Instead, most of your data would be pre-summarized, filtered, and formatted into reports within Salesforce.
Before trying to bring in the report data into Power BI, you’d first:
Once that’s sorted, it’s time to get the data into Power BI.
Your first instinct would be to use either of Power BI’s salesforce connectors but considering the large data volumes, you’d face bottlenecks.
Since you already have pre-built reports inside of Salesforce, you would try connecting with the Salesforce Report Connector first, obviously.
I mean, it’s an ideal option because it would allow you to easily connect to the tables that contain all the data you need.
But here’s the catch: it has a well-documented limit of only 2,000 rows.
That’s a dip in the bucket compared to the mountain of data you need to process.
Thankfully, there are ways around this limitation.
For example, opting for the Salesforce Object Connector.
You would typically try this option next as it is a popular way of bypassing the 2000 rows limit – it allows you to extract all the rows available in individual objects/ tables at once but…
Do you see the problem here? Fine, I’ll spell it out.
The Salesforce Object Connector gives you access to all the raw data stored in many different Salesforce objects (that’s a whole lot of tables, way too many of them), not the reports themselves.
This means:
In general, when it comes to big data and complex dashboards, this approach tends to be annoyingly time-consuming and requires more technical expertise compared to simply importing pre-formatted reports.
Well, good news, there’s a better solution!
Your business, irrespective of its size, does not have to suffer or compromise on time/ performance because of the large amounts of customer data it generates.
In fact, the bigger the better. After all, more information means more opportunities for valuable insights.
This is where our custom salesforce reports Power BI connector comes in.
Think of it as a ‘Data Extraction as a Service (DaaS)’ solution that comprises a couple of streamlined processes and scripts to help you overcome all the limitations of the standard Power BI Salesforce connectors… without any complications.
Yes, you read right.
With our Salesforce Reports Connector, you can:
Don’t waste another second battling with data limitations, let Vidi do the dirty work for you so you can focus on what truly matters – getting value from your data.
Let’s talk about getting more value from your data as a business.
At Vidi, we sit at the top of excellence when it comes to all your Power BI needs.
So, of course, we’re capable of doing far more than efficiently pulling data into Power BI.
We take it a notch further by helping you derive maximum value from your data through our custom Power BI report & dashboard services.
Take for example the Power BI report we built for the global head of marketing of a global organization.
This report combines information from 7 large reports the company already had in Salesforce.
Yes, if you’re thinking about it, you’re right. Of course,we used our custom Salesforce Reports Connector to smoothly and optimally bring that data into Power BI.
Afterward, we created a comprehensive report that answered important questions about the marketing and sales performance of the company.
Let’s walk through it so you can get a better sense of how much value we can help you dig up from your data.
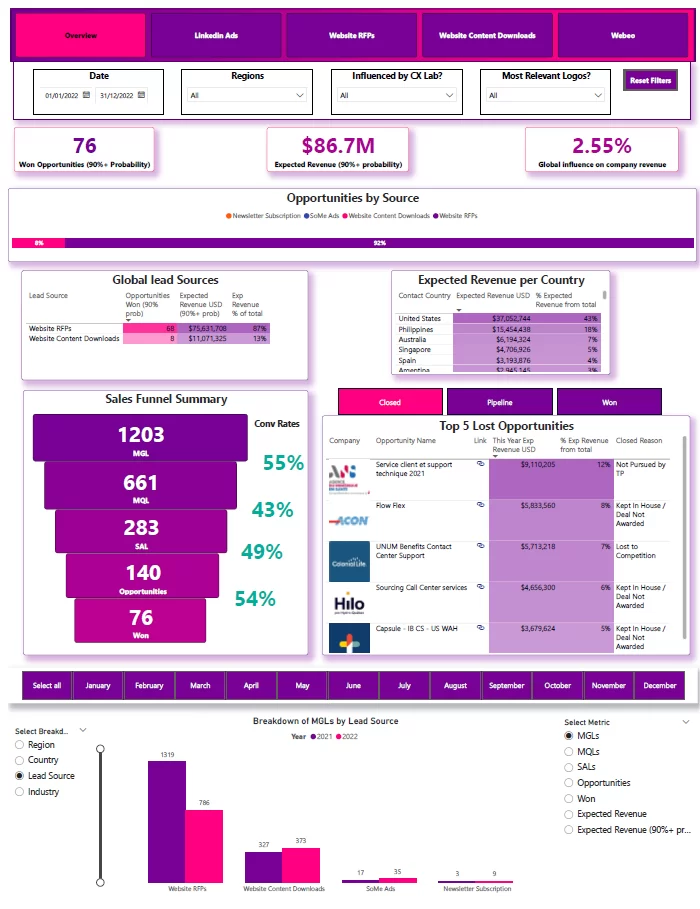
The Overview Page shown in Fig.1 above spotlights rich insights and KPIs that’ll help track lead generation, sales performance, and potential revenue.
These insights/ KPIs include:
P.S. This page, just like every other page in the report, is interactive. Meaning, that you can ‘zoom in’ on the insights that you’re interested in. i.e. Viewing all info on the page based on specific region(s) or viewing the breakdown of the leads (bottom chart) based on a specific month or/and category.
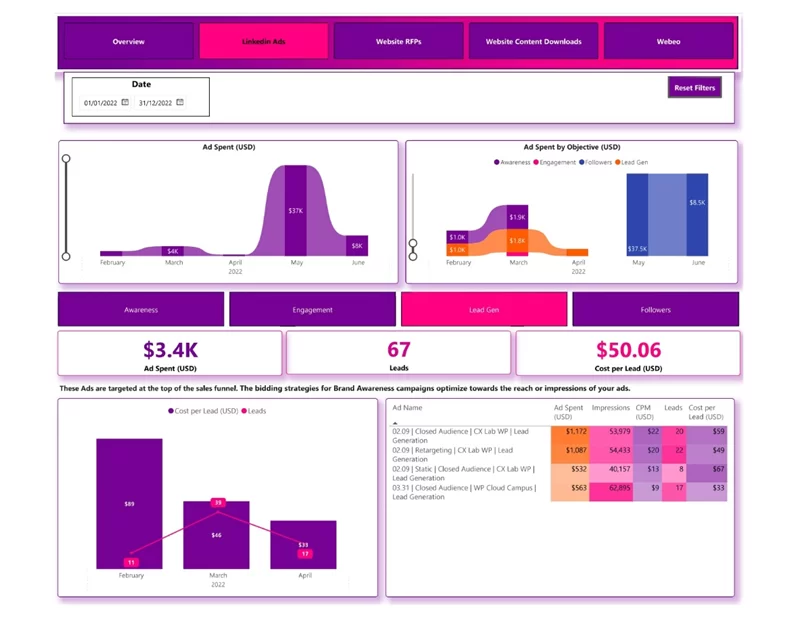
The LinkedIn Ads page talks about how the LinkedIn ads are performing in terms of generating leads, user engagement (likes, comments), and overall brand awareness compared to how much is being spent on creating these ads.
We were able to create this page seamlessly using our custom LinkedIn Ads Connector which helps you easily pull in data from LinkedIn Ads Campaign Manager into any reporting tool you want (Power BI, Tableau, Looker Studio, and so on).
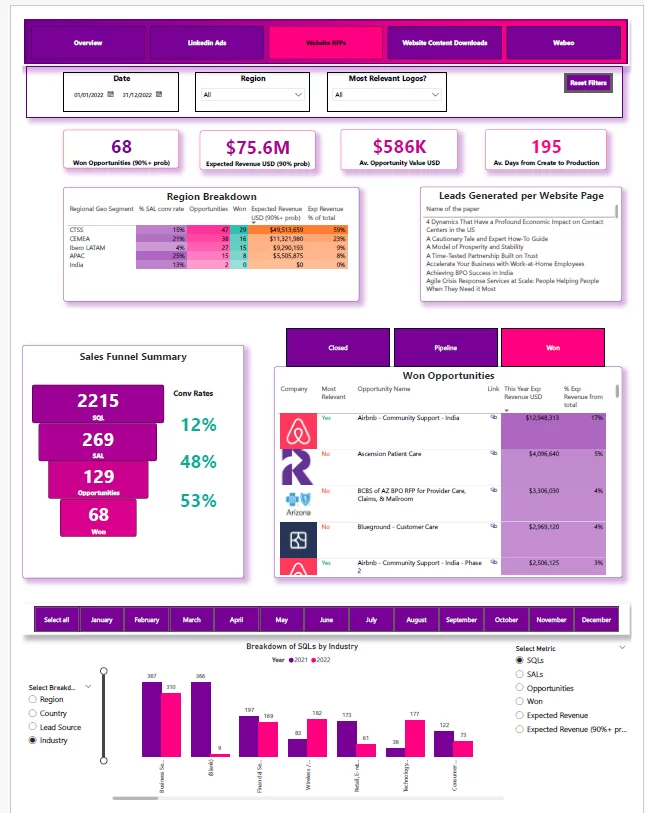
Website RFPs Page
The Website RFPs page focuses on website lead generation, providing insights into leads who submitted Requests for Proposal (RFPs) through the company’s website.
This page tracks key metrics and KPIs like:
And much more.
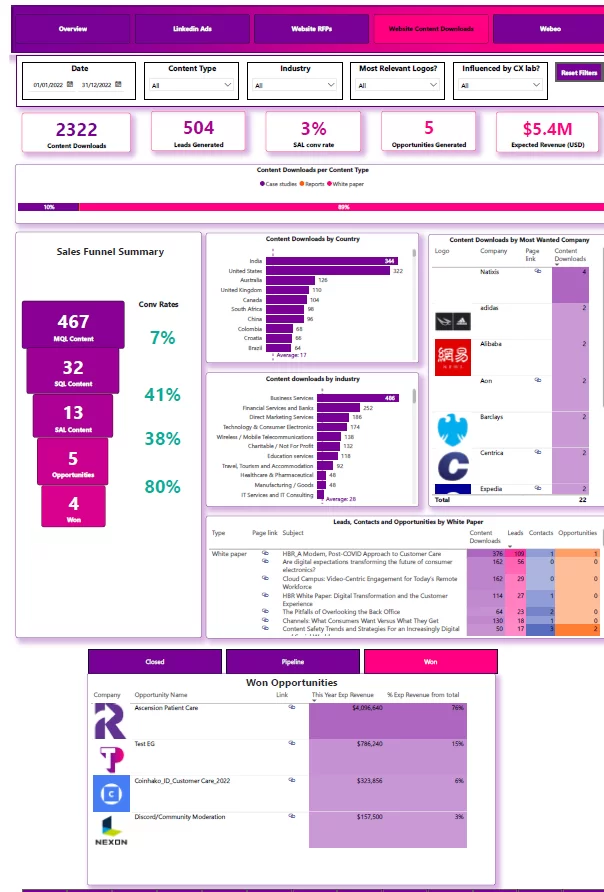
Website Content Downloads Page
The Website Content Downloads page speaks about the performance of the website content in attracting and converting leads.
It spells out several key findings:
And so forth.
If you desire to get this amount of value from your data, then great, you’re in the right place.
Just as we did for the global company, our team of experts can deliver to you and your business world-class Report & Dashboard Services guaranteed to drive real business results.
![]()
![]()
![]()