QuickBooks and Power BI is a match made in heaven! You can do so much useful financial analysis if you connect QuickBooks to Power BI. It offers several significant benefits to client:
In this article we will explore how to get started with QuickBooks and Power BI integration, the ready-made reporting templates in Power BI and how to build your own customised Power BI templates.
CONTACT US TO GET THIS SOLUTION
QuickBooks is a market-leading accounting software by Intuit. It is used by over 100,000 companies worldwide and is often praised for being the best accounting software for small business.
QuickBooks enables automated accounting reporting, integrations with government portals such as HMRC and automatic data syncronisation with banks.
Power BI is a market-leading business intelligence platform by Microsoft which enables customers to automatically extract data from multiple sources and combine it in a single management report. Power BI has been named the market leader in BI software market by Gartner for 5 consecutive years and it still keeps going!
CONTACT US TO GET THIS SOLUTION
Microsoft have released a public app that enables users to quickly connect their QuickBooks Online data to a pre-made Power BI dashboard.
You can visualise your QuickBooks Online financial statement data to Power BI in minutes by simply connecting it to this Power BI app. Simply follow the Microsoft guide on how to connect your QuickBooks Online data to Power BI.
This pre-made options is good for proof-of-concept since it allows you to see how your QuickBooks Online data would look in Power BI.
However, this pre-made dashboard does not allow for any customisation so if you want a custom Power BI report with your QuickBooks Online data, you would have to build it from scratch.
Later in this article we will cover other QuickBooks Online Power BI templates that allow you to customise them.
There is a native connector between QuickBooks Online and Power BI. You can make use of it simply by clicking “get data” in Power BI Desktop and choosing QuickBooks Online.
The connector allows you to pull data from 100+ different tables including General Ledger, Invoices, Customers and more. If you want to read detailed documentation on how to connect QuickBooks to Power BI using the native integration, you can do this on the Microsoft website.
The connector is functional but there are a few limitations:
Later in this article we will explore some possible solutions to all these problems.
Once you create the direct connection you can schedule the automatic data refresh. For example every day at 9 am your data in Power BI will be refreshed.
If you want to get started with visualising your QuickBooks Online data in Power BI quickly, you may find it useful to set up a template dashboard for yourself. Templates are pre-made Power BI dashboards which you can set up for yourself very quickly. You will then have freedom to customise the templates.
You can get all the QuickBooks Online Power BI dashboards described in this article set up for your company.
Once these dashboards are set up, you will get a Power BI file which you can edit yourself and change the look and feel as you want.
This dashboard visualises your QuickBooks Online P&L statement in Power BI enabling interactive drilldowns, filtering and showing trends for your key P&L metrics.

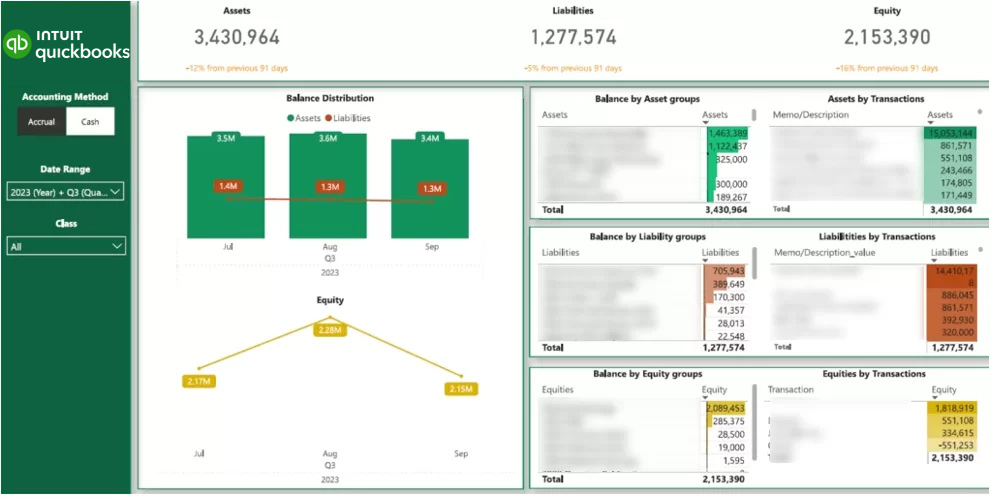
This dashboard visualises your QuickBooks Online Balance Sheet statement in Power BI giving you an engaging view of your assets, liabilities and equity.

This dashboard visualises QuickBooks Online cash flow statement in Power BI and shows trends from cash flows in and out from different company activities.

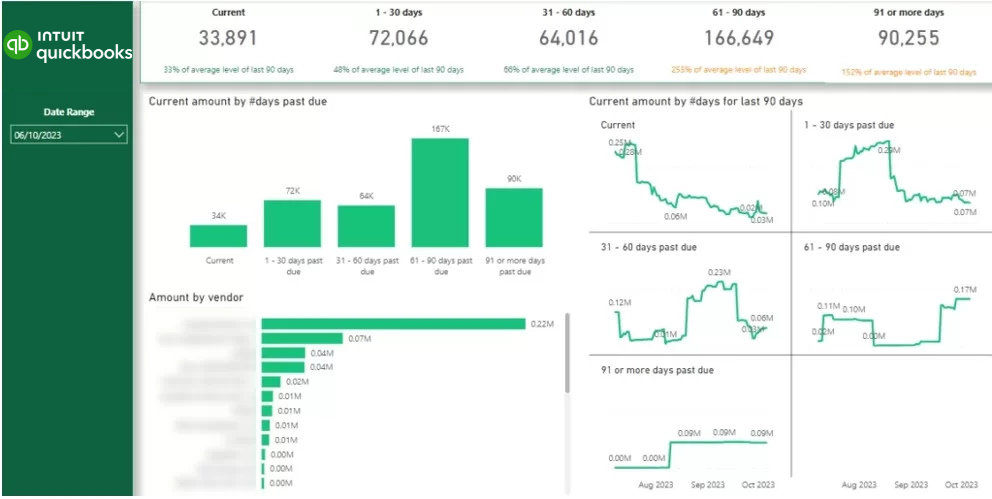
This dashboard analyses how much money is owed by every customer and for how many days it has been outstanding.
We can set this dashboards up for you according to your preference.
As discussed above in this article, the native QuickBooks Online Power BI connector is not perfect. This section of the article will cover these limitations in more detail and explain how to work around those limitations.
If you use the native Power BI QuickBooks Online connector, it is really hard to recreate your financial statements because of the overwhelming amount of tables. This inconvenient data format is the biggest problem with the native connector.
It is possible to get your QuickBooks Online data in a much easier format inside of Power BI by using a QuickBooks Online Power BI connector from Vidi Corp.
This connector returns tables like Profit and Loss, Balance Sheet, Cash Flow, etc. As a result, you no longer have to recreate your financial statements from 100+ different tables, all the data is already grouped for you into the financial statement format that is ready for you to use.
The data format from this connector can be viewed here.
The native Power BI connector only allows to connect to one QuickBooks Online account at a time. However, many retail companies have multiple QuickBooks Online accounts (one per retail location). Similarly accountancy practices have one account per client.
There is a need for companies like these to extract data from multiple QuickBooks Online accounts into Power BI at once.
You can extract data from multiple QuickBooks Online accounts into Power BI using the Vidi Corp connector. This connector returns a column “client id” in every table which can be used to filter to a particular account. If you remove the filter on client id, you will see the data from all the companies together.
The native QuickBooks Online Power BI connector makes it really difficult to calculate the data on cash or accrual basis. In order to do this you will need to find the date a transaction was invoiced and the date it was paid.
Our QuickBooks Online connector returns a column “accounting method” for every table. You can use this column as a filter to switch between cash and accrual accounting methods.
The native Power BI QuickBooks Online connector returns a general ledger table. However, it is missing the column “class” which is essential for many companies.
Our QuickBooks Online Power BI connector returns class column for Profit and Loss, Balance Sheet, Cash Flow and other financial statements.
If you want to create a fully custom Power BI dashboard from QuickBooks Online data, you can do that yourself by either using the native QuickBooks Online connector or using the connector by Vidi Corp.
It is likely that our connector will save you time developing the dashboard since you would not have to blend the data from multiple tables that much.
Now you know how to get started with analysing your QuickBooks Online data in Power BI. We have covered the different data connectors and templated Power BI dashboards that would speed up the dashboard development process.
We have also touched upon the data format that you would be working with in Power BI once the data from QuickBooks Online is extracted. It is now time to explore this data format yourself and set up your first dashboards!