
Google Search Console Looker Studio Dashboard template by Vidi solves major problem for you while answering the following questions.
User-friendly interface: Our intuitive Looker Studio dashboard design and a user-friendly interface allow individuals, even those without deep technical expertise, to easily visualise reports.
* Customised reports: Our solution enables the creation of reports specifically tailored to the target audience, which is crucial for effectively communicating SEO information.
* Data visualization: The tool allows visualization of any combination of data, making it easier to convey your complex information in a more understandable format.
This report visualizes the following dimensions and metrics such as:
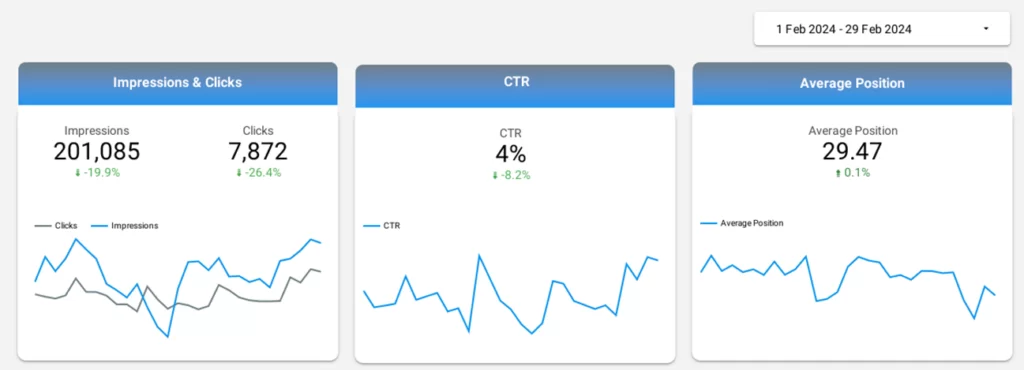
| Input | Output | Specialized Advanced Techniques |
| Specified PeriodLanding Page FilterQuery FilterDevice Categories | KPI cards showing Impressions & Clicks & CTR & Average PositionTrend over timeComparison between Clicks & Impressions | Comparison with a previous period |
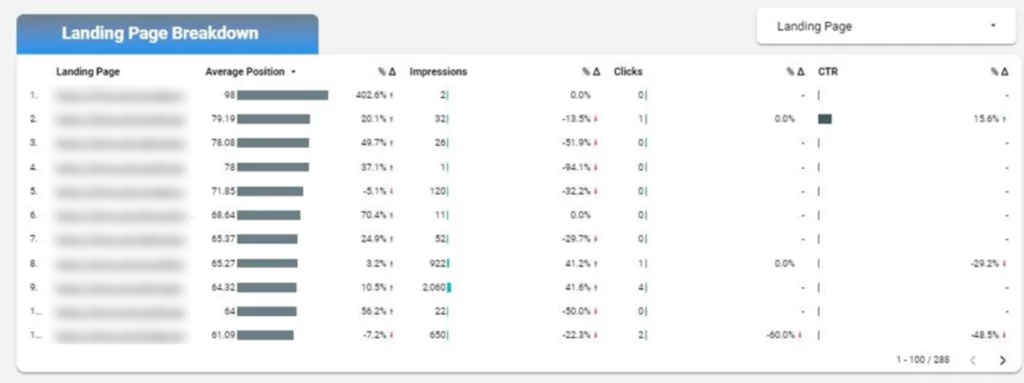
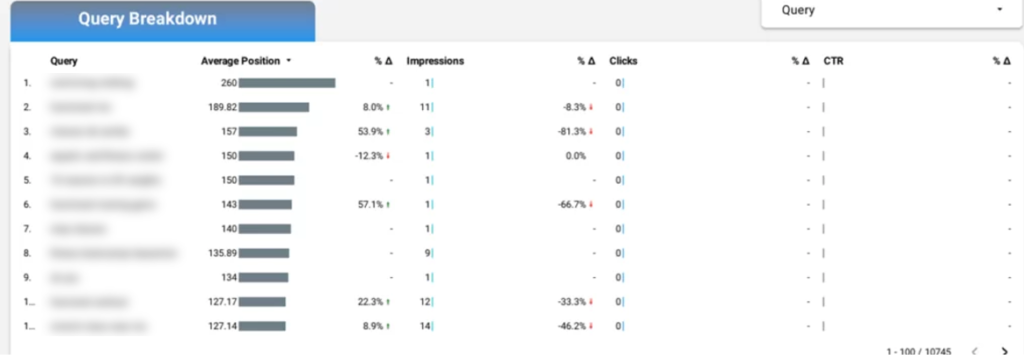
| Input | Output | Specialized Advanced Techniques |
| Specified PeriodLanding Page FilterQuery FilterDevice CategoriesSort Metric | Table details showing Landing Page / Query Page breakdown per Avr Position & Impressions & Clicks & CTR | comparison with a previous periodClickable Landing Page Link.Custom Sort Displays values with adjacent bars |
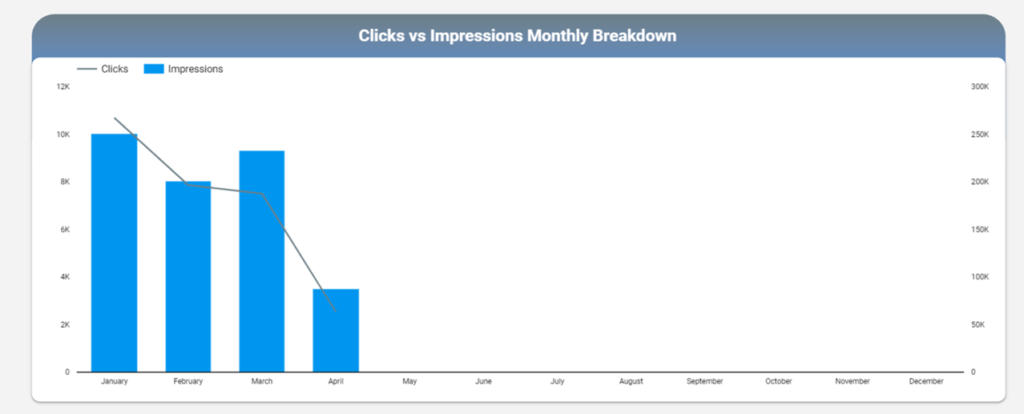
| Input | Output | Specialized Advanced Techniques |
| Specified PeriodLanding Page FilterQuery FilterDevice Categories | Dual-axis chart with monthly clicks (line) and impressions (bar). | Merged clicks and impressions into one chart for easy month-by-month comparison. |
| Input | Output | Specialized Advanced Techniques |
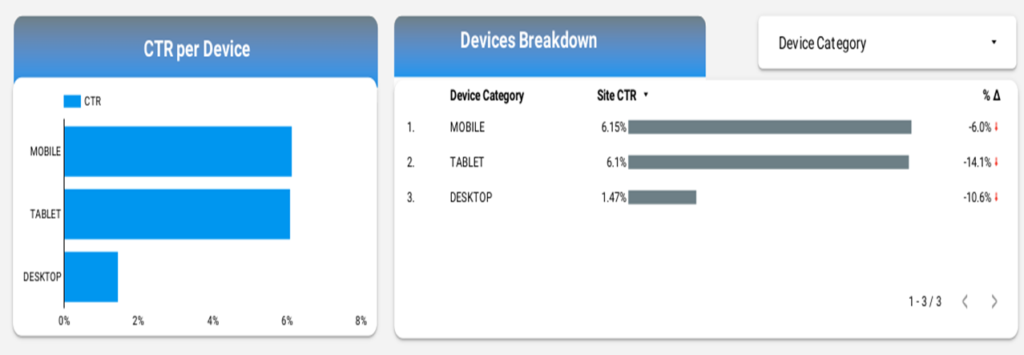
| Specified PeriodLanding Page FilterQuery FilterDevice CategoriesSort Metric | Bar chart showing Site CTR Per DeviceTable details showing Device category breakdown per site CTR | comparison with a previous periodCustom Sort Displays values with adjacent bars |
| Input | Output | Specialized Advanced Techniques |
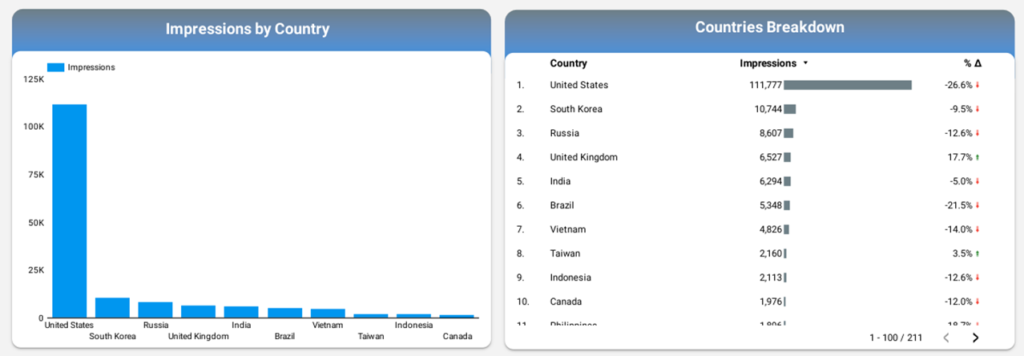
| Specified PeriodLanding Page FilterQuery FilterDevice CategoriesSort Metric | Bar chart showing Impressions per country.Table details showing Impressions breakdown per country | comparison with a previous periodCustom Sort Displays values with adjacent bars |
Our Looker Studio consulting services could help your business set up this dashboard seamlessly.
![]()
![]()
![]()