
Integrating Google Ads with Looker Studio is one of the offerings by Vidi and this offers numerous advantages for digital marketers and agencies:
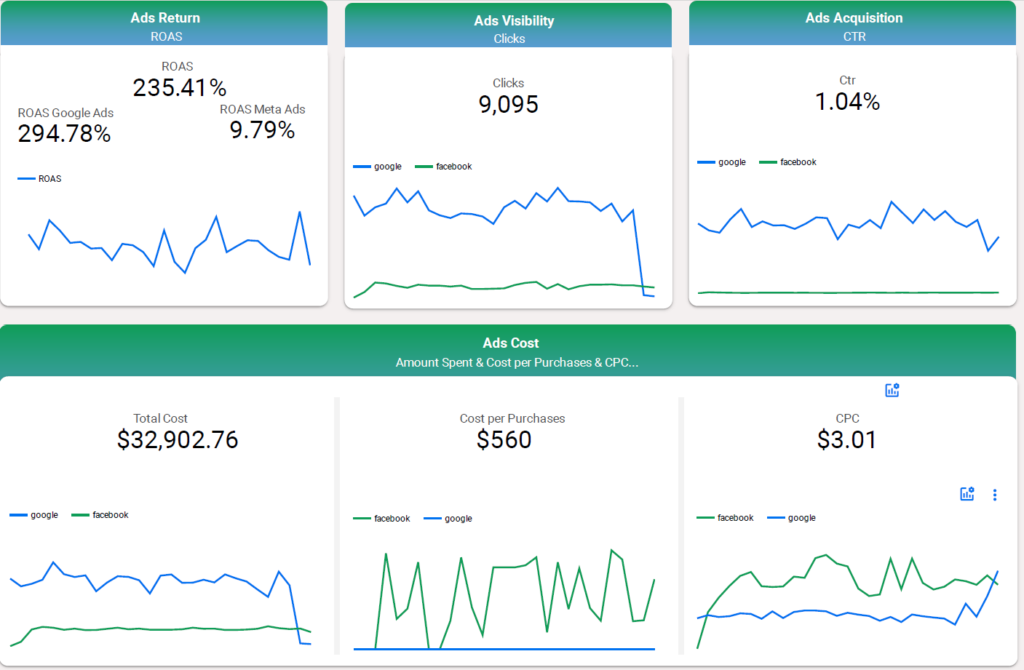
Looking for a comprehensive cross channel dashboard? We’ve got you covered with this template.
How much are you spending on Google ads? How does that compare to the allocated budget?
The details of your best & worst-performing campaigns?
The details of your best & worst-performing keywords?
Who is your audience? Are there any regions with a lower CPM, a higher CTR and a better conversion rate?
How can you optimize your spending budget?
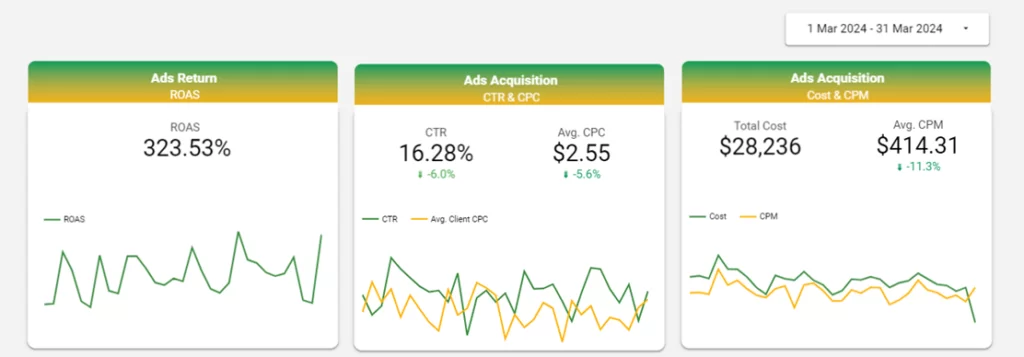
Starting with a summary, showing the most important KPIs for the client, including ROAS, CTR, CPC, total cost, and CPM. It highlights current metrics, trends, and comparisons to the previous period, offering a concise and comprehensive view of ad performance.
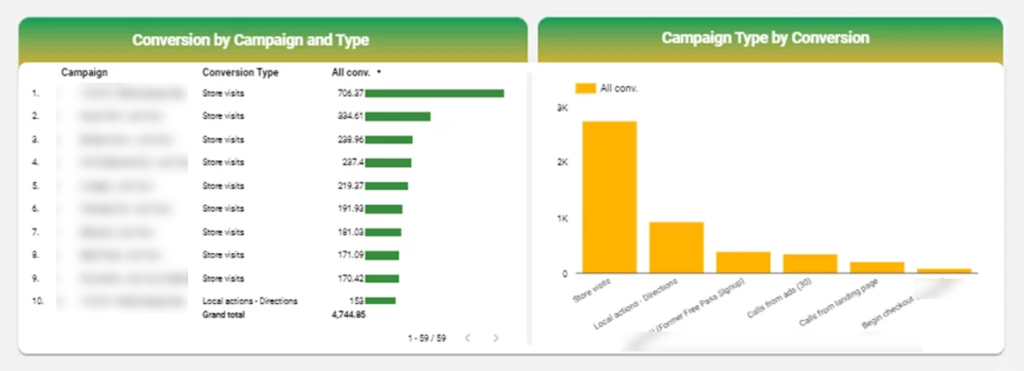
In the comprehensive breakdown of campaign metrics provided by our dashboard, using data from both Google Ads and Google Analytics through our connector, we provide a multifaceted view of advertising performance.
For each campaign, we exhibit a thorough analysis of key performance indicators, including ROAS, which signifies the return on advertising spend, and contact value, which reflects the potential revenue generated by each campaign.
This display is pivotal in assessing the effectiveness of marketing spend by juxtaposing the contact value against the incurred costs. The dashboard’s ability to draw revenue data from Google Analytics and merge it with cost data from Google Ads into a singular view epitomizes the power of our connector.
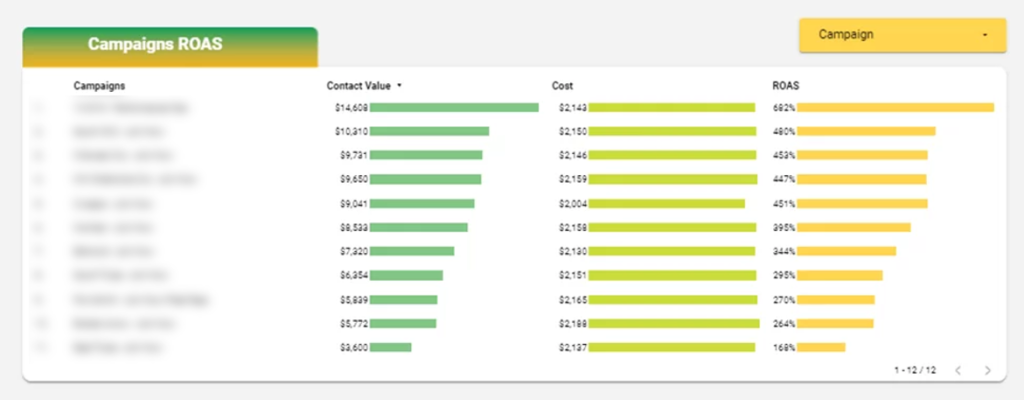
This fusion results in an intuitive understanding of each campaign’s financial performance. Moreover, the breakdown goes further to illuminate the conversion types attributed to each campaign, offering a detailed comprehension of which aspects are driving engagement and conversion.
This part of the dashboard clarifies how different campaigns contribute to overall performance metrics such as store visits or local actions, hence assisting in strategic decision-making for optimizing ad expenditure and enhancing campaign efficacy.
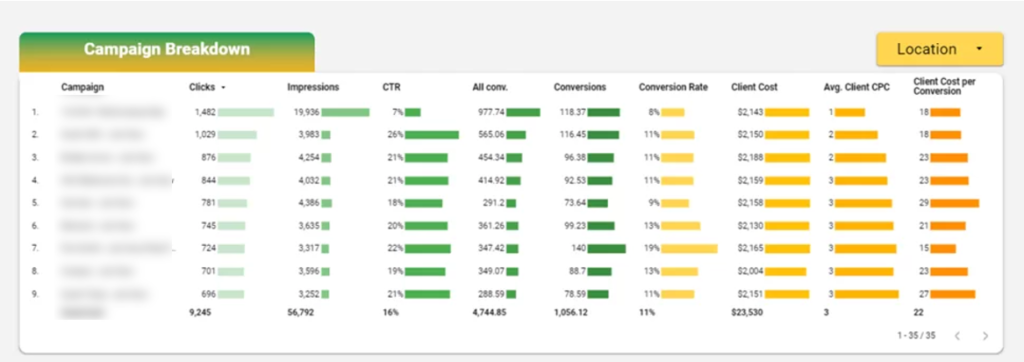
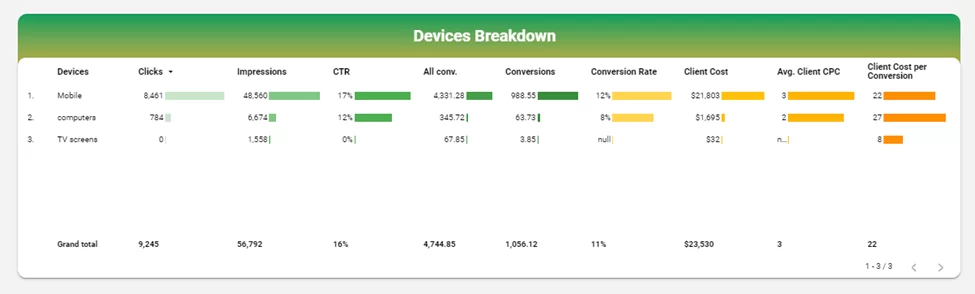
This dashboard section offers a clear breakdown of device performance, aggregating data to present distinct groupings: Mobile, Computers, and TV Screens. We’ve organized a variety of devices into these key categories for clarity.
It displays metrics like Clicks, Impressions, CTR (Click-Through Rate), Conversions, Conversion Rate, and Costs, enabling a direct comparison of how each device type performs, which is essential for understanding user behavior and optimizing ad spend effectively.
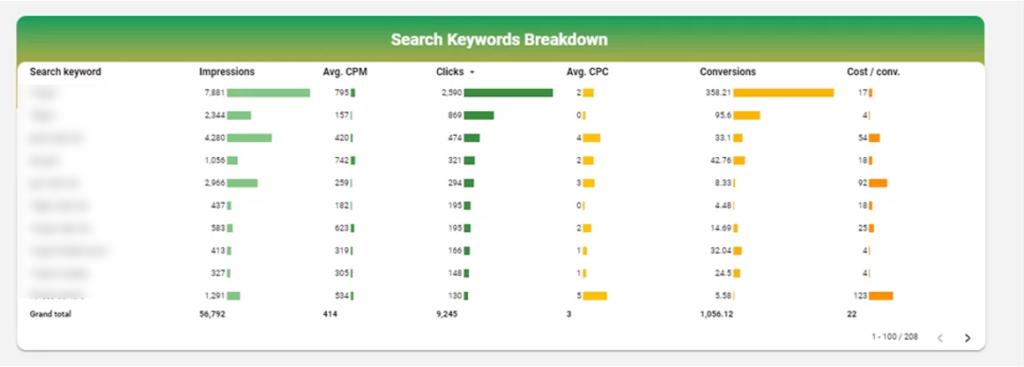
This segment provides a detailed Search Keywords Breakdown, illustrating the performance of specific keywords in driving traffic and conversions.
It reveals insights into Impressions, Average CPM (Cost Per Thousand Impressions), Clicks, Average CPC (Cost Per Click), Conversions, and the Cost per Conversion.
These metrics are crucial for evaluating the effectiveness of each keyword in the context of the campaign’s objectives. By analyzing this data, advertisers can refine their keyword strategies, allocating budget to the most efficient terms and improving overall campaign ROI.
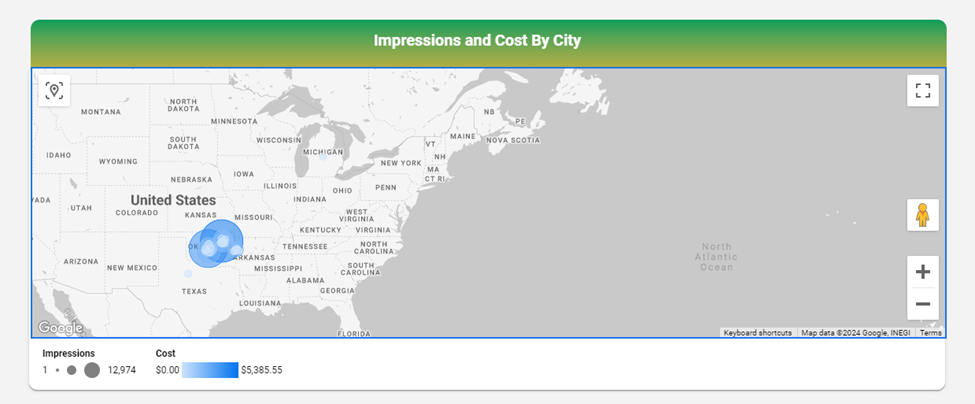
This map visualization offers an engaging geographic display of campaign data. When users hover over each city, the map reveals a wealth of static data points including the number of impressions, associated costs, click-through rates, and conversions.
This layered information provides an in-depth analysis of the campaign’s reach and expenditure by location. The use of a map in Looker Studio allows for a visual and interactive examination of these metrics, aiding in a more strategic approach to market analysis and the optimization of advertising efforts.
This dashboard section provides detailed insights into the effectiveness of each Google Ad campaign, including metrics such as:
![]()
![]()
![]()