In the world of business intelligence, visualising data in an understandable and comprehensive way is essential. Drill Down in Power BI is a great tool for presenting hierarchical data that allows users to explore data at different levels of granularity.
In this blog, we will discuss the practical implementation of drill down for Power BI using an example dataset. We will explore how to activate drill down mode and how to use drill down options to view sales data across multiple dimensions, including Group, Country, and Region. By the end of this process, you will have a better understanding of how to use a Power BI drill down to make your reports more informative and efficient.
Drill down is a great way of presenting hierarchical data. It allows the report users to see the highest level of detail in the chart but also drill through Power BI data at will.
This feature is especially useful when your report has multiple or hierarchical dimensions and you want to visualise them all together in a single chart. Instead of cheating several charts, we can save some space on the canvas by creating one chart with a Power BI drill down.
Check our Power BI Consulting Services to see how you can optimise your data reporting with Power BI!
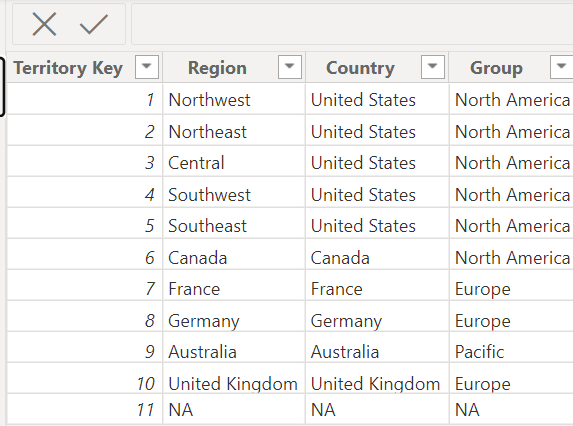
Let’s take a look at how to practically use a drill down using the dataset below. We have a report with a Bar chart showing sales by Group. In addition, we have 2 more dimensions that are more granular: Country and Region.
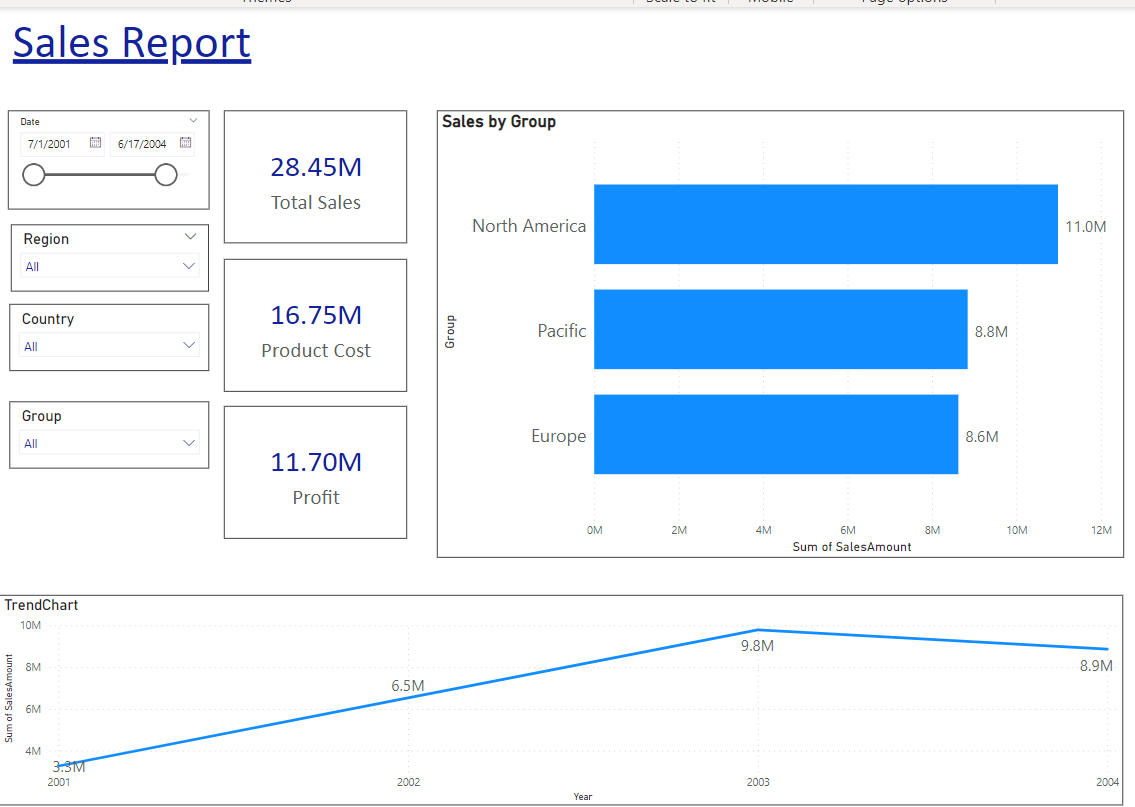
Currently the chart has 2 fields (Group in X axis and Sales in Y Axis). In order to add a drill down, we will add remaining dimensions to the X axis in the same hierarchical order as it will turn up in the chart for the users:
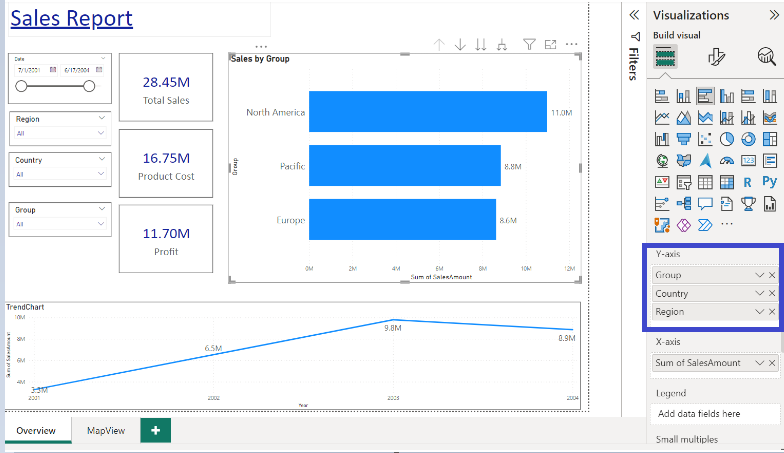
Once these fields are added now drill down Power BI options will be enabled on the chart.
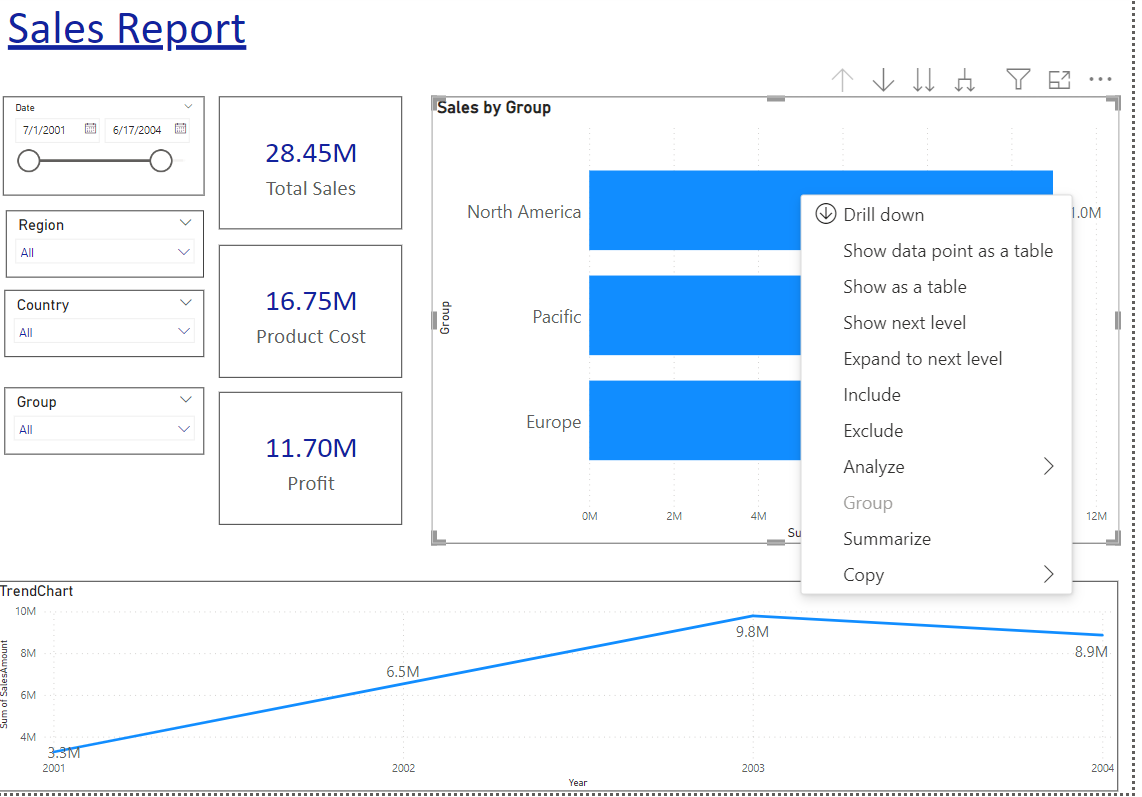
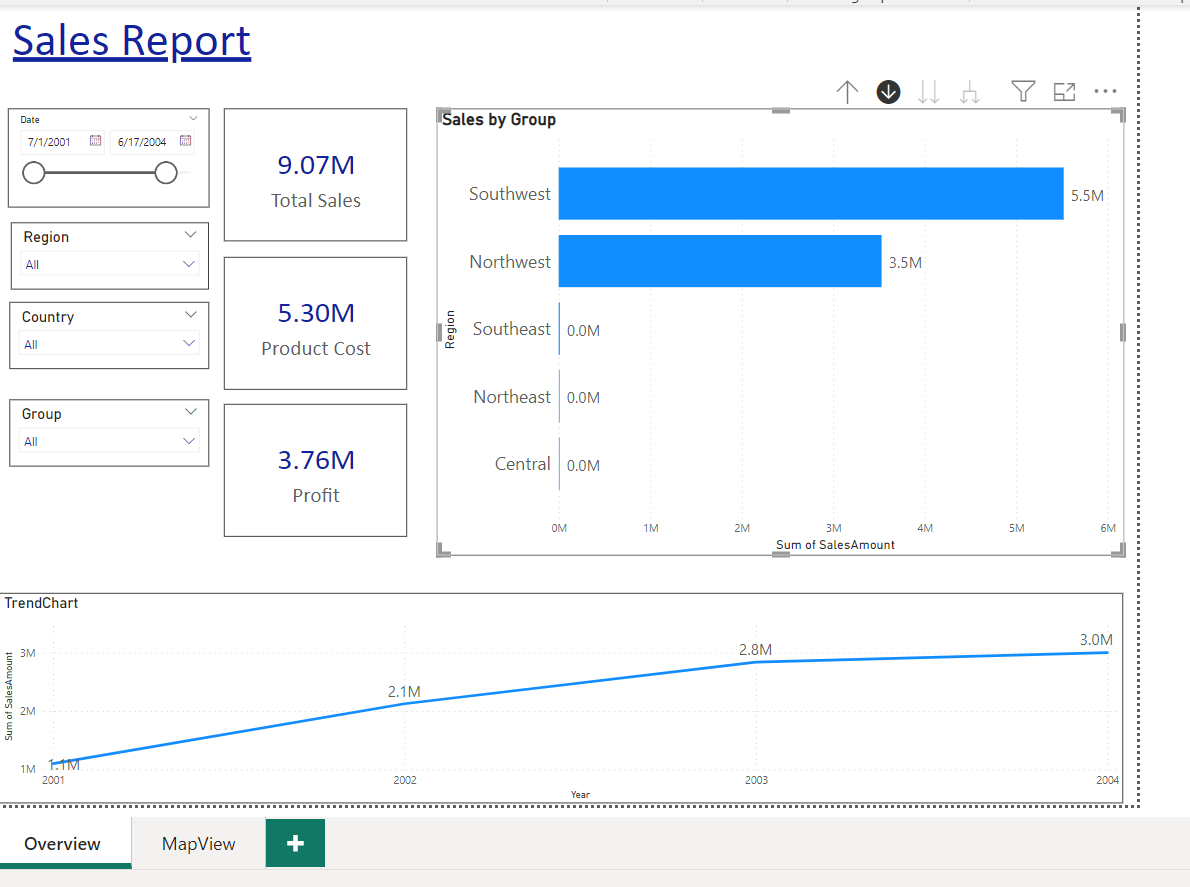
There are two ways by which users can access drill down functionalities in Power BI:
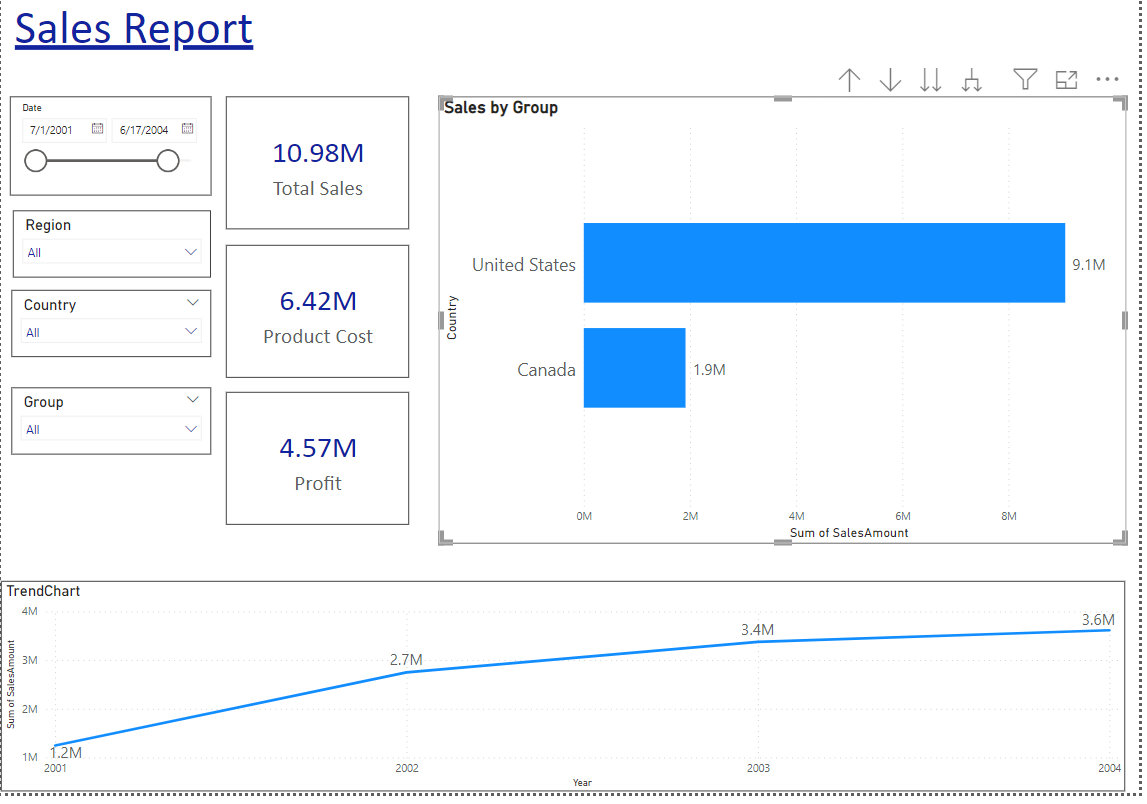
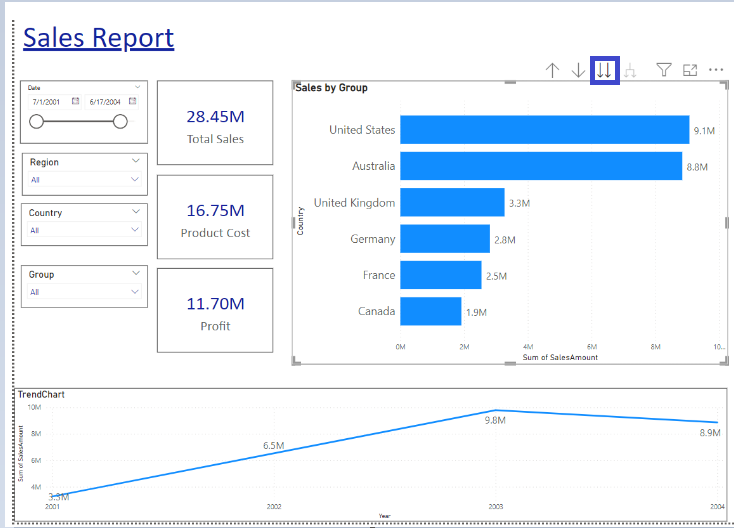
In our report we can click the drill down option on the bar that shows North America. As a result, Power BI showed us the sales from the countries that are grouped under North America. Before the drill down, you can see that the sales of North America are 11M. After drilling down we can see how 11M is split between 2 different countries (9.1M for the United States and 1.9M for Canada).
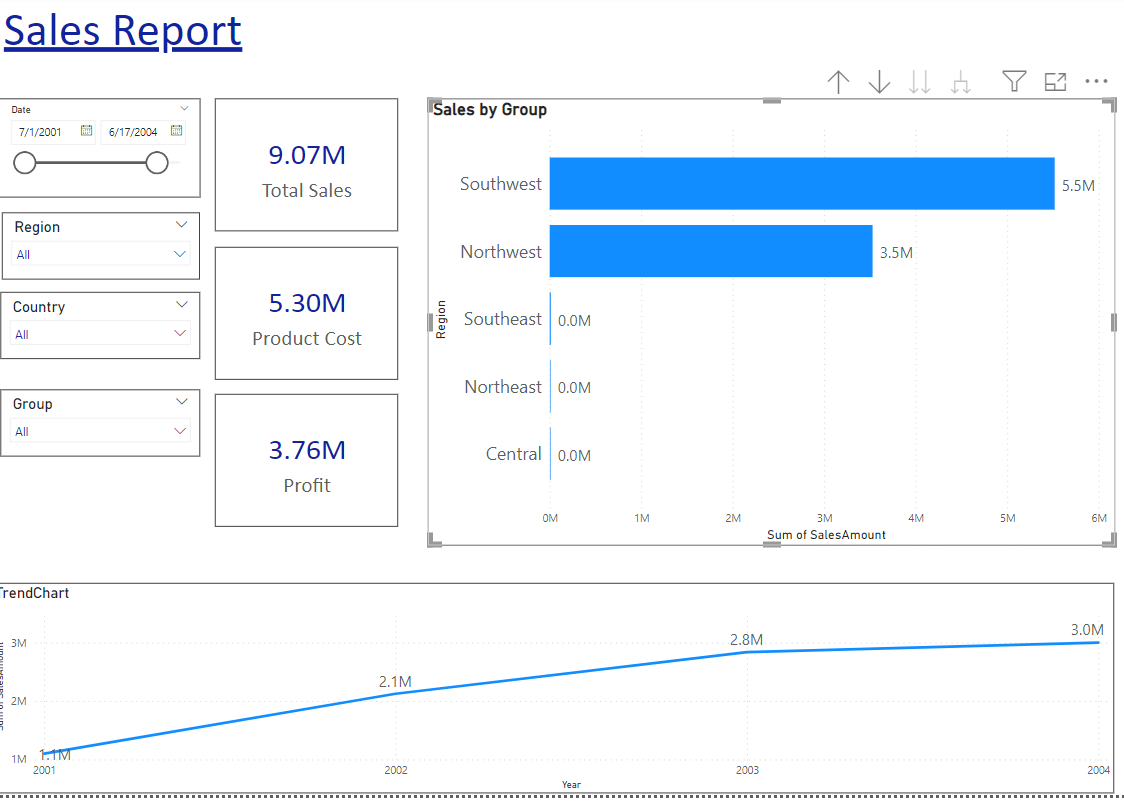
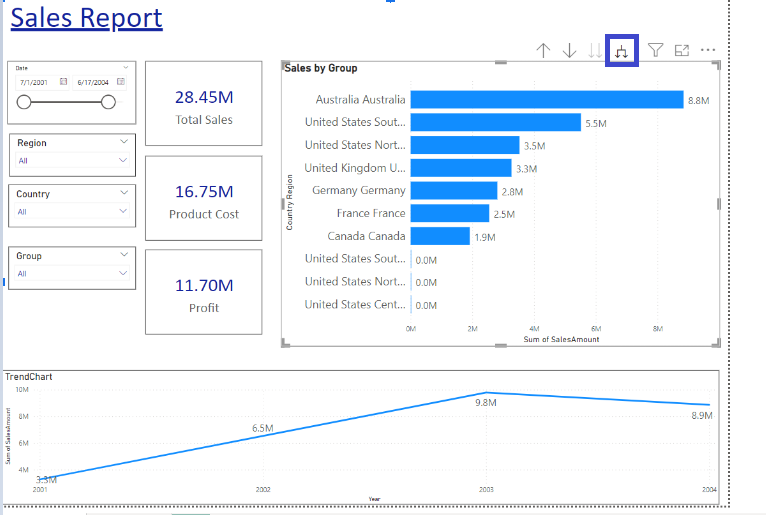
Since we have another dimension available (Region) so let’s do another drill down on the United States bar. Right-click on the United States and then left-click on Drill down.
As you can see, the 9.1M in sales for the United States is distributed among different regions as follows.
As you can see, by using drill down we can see sales across this hierarchy :
Group → Country → Region
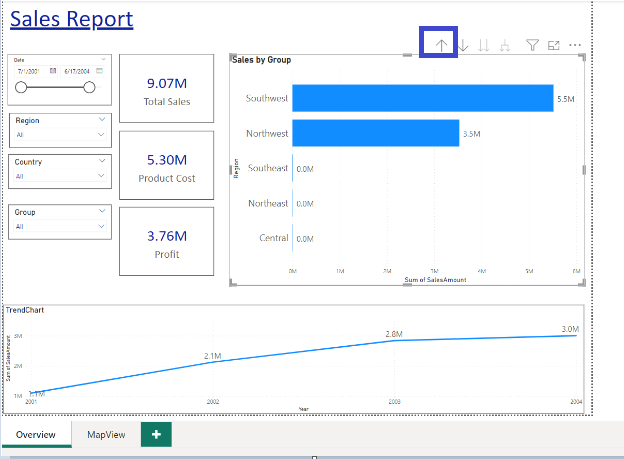
If you want to go back from Region to Country, you can do this by using the upward arrow as marked below:
In conclusion, drill down is a powerful tool in Power BI that allows report users to explore data at different levels of granularity. By implementing drill down and drill through in Power BI, you can save space on your canvas and present hierarchical data in a single chart. In addition, by using drill down effectively, you can make your reports more informative and efficient, and ultimately help your organisation make data-driven decisions.
![]()
![]()
![]()