Benefits of Using Power BI for Shopify Analytics
How to Connect Your Shopify Data to Power BI
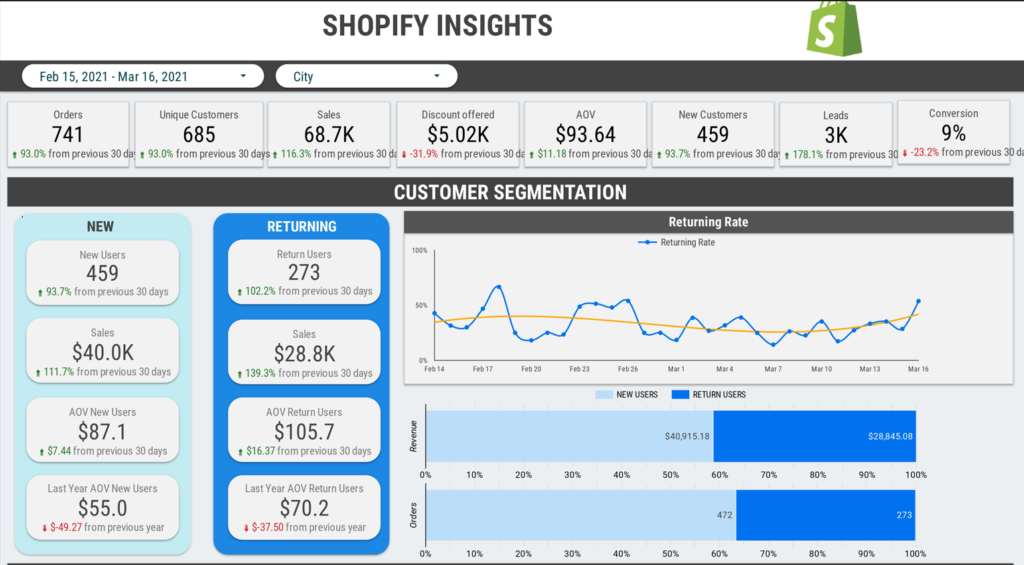
Key Shopify Metrics to Track in Power BI
Building Visually Appealing Dashboards in Power BI
Best Practices for Shopify Analytics Content Governance
—
As an online store or e-commerce owner, you have a considerable amount of data about your customers and business. It is important to get the most out of this data to optimize your Shopify store performance. It will contribute a lot towards taking your online store to the next level of success. This is where you need to be mindful about Shopify store analytics.
Shopify has 700 million consumers as of 2024. The e-commerce platform provides a basic analytics dashboard, but it has limitations in terms of customization, advanced reporting, and data visualization capabilities. This is the main reason to start using Power BI dashboards.
Power BI is a powerful business intelligence and analytics tool from Microsoft that can help you get much deeper insights from your Shopify data. By connecting your Shopify store to Power BI, you can build interactive reports and dashboards tailored to your specific needs. Let’s dive in and see how Power BI can boost your Shopify store analytics!
Here are some of the key reasons Shopify merchants should consider using Power BI.
Power BI makes it easy to build custom reports pulling in data from multiple sources, including your Shopify data. You can track popular metrics like sales, revenue, and conversions while also gaining insights across marketing, inventory, shipping, customer segmentation, web traffic, and other business areas.
Power BI provides a wide array of highly customizable chart and graph types to visualize your data beyond just tables. Choose from line charts, bar charts, pie charts, gauges, maps, scatter plots and more. This allows you to spot trends and patterns in your Shopify metrics quickly. The interactive drill-down capabilities help you find insights that basic tables of numbers might hide.
In Power BI, you can build interactive dashboards with various clickable visuals, filters, and drilldowns. This allows you to explore data easily from high levels down to granular details in real time from a unified view. Easily change date ranges, product categories, traffic sources and other filters to see how metrics shift.
Power BI has data modeling capabilities that allow you to shape, enrich, and transform your Shopify data for easier analytics. Through its “Power Query” ETL functionality, you can pull data from multiple sources, filter and clean your datasets, seamlessly blend data, create custom columns and measures, and apply data aggregation logic tailored to your use cases.
You can securely share interactive Power BI analytics content with users throughout your business. Specific dashboards, reports, and datasets can be given focused access to various user roles rather than everyone seeing the same broad view. Manage permissions to protect sensitive commercial data.
Power BI mobile apps make it easy to access analytics dashboards on the go from iOS and Android smartphones and tablets. Shopify store owners can keep their finger on the pulse of store performance from anywhere.
Connecting Shopify to Power BI is straightforward, thanks to the availability of our connector integration. Here are the key steps:
Use Vidi-Corp Shopify PowerBI Connector:
VIDI’s Shopify connector to Power BI enables you to centralize and manage your Shopify data effortlessly, saving time and resources.
Here’s what VIDI offers:
Here are other steps you could take:
Start by exporting the raw reports data you want from your Shopify admin. Useful reports include Orders, Customers, Products, Marketing, Discount Codes and more. Export data to CSV or Excel file formats for consistency.
Download the free Power BI Desktop application, which allows you to connect data sources and build reports, dashboards, and data models that can later be deployed up to the Power BI cloud service to share access with others.
In Power BI Desktop, click “Get Data” then browse to and select the Shopify data export files you created. The data will now be available in Power BI for transformation and reporting.
Use the built-in “Power Query Editor” to further transform your Shopify data for easier downstream analytics and reporting. Filter rows, rename columns, aggregate figures, create new measures and calculated columns, change data types and more.
Drag and drop fields from your Shopify data onto the Power BI canvas to build charts, tables, cards and graphs to track KPIs. Choose from a multitude of visualization types to tailor to your metrics. Customize colors, data labels, shapes and sizes exactly as needed.
Arrange your visuals from one or more reports onto a dashboard canvas. Unify insights into a single pane of glass. Add slicers, filters, tooltips and clickable spawners to aid in cross-filtering between visuals to spot data trends.
When ready, deploy your configured Power BI Desktop workspace up to the Power BI service cloud. This enables easy sharing of dashboards and reports with others through role-based access controls.
As you can see, creating this type of connection is quite challenging. You will not be able to have real-time updates on your Power BI dashboard. This is why you should think about using a Shopify Power BI connector for Shopify store analytics.
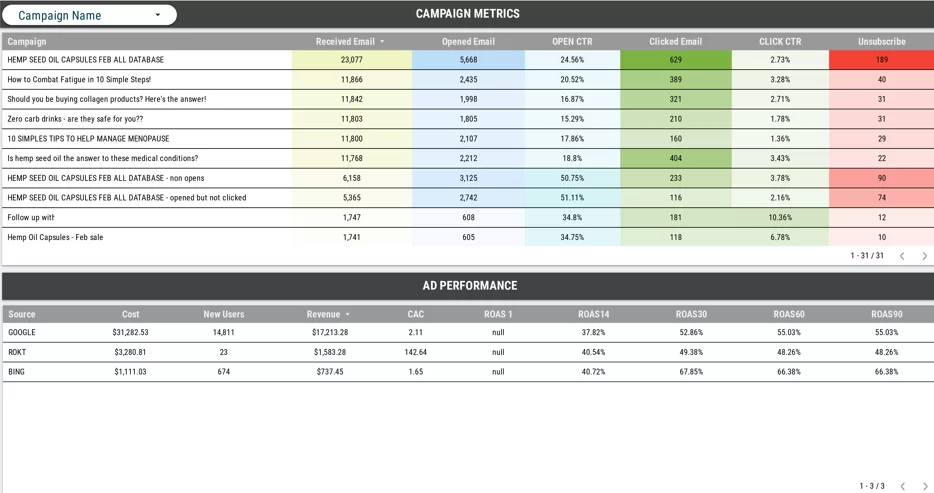
There is a wide variety of Shopify store metrics you may want to track using Power BI analytics. Some examples include:
The layout, formatting and design of your Shopify analytics dashboards in Power BI has a significant impact on their effectiveness. Vidi Corp can help you with getting the dashboard created as well. But if you are developing it on your own, here are tips for building visually appealing dashboards:
Select a dashboard color theme and palette that fits nicely with your brand style guide or identity. Apply theme formatting consistently across all dashboard visuals.
Segment the dashboard visually into different areas of Shopify KPIs or data lens (e.g. Sales, Products, Customers, Marketing). Helps provide structure.
Avoid cluttering tiny hard-to-read mini visuals everywhere. Simplify layouts with clear titles, data labels, captions, filters and highlighting applied judiciously.
Format chart types, color choices, layout principles consistently across multiple dashboards. This improves re-learnability for users.
Add clickable drilldowns, cross-highlighting, filter spawners between visuals and tooltips over data points to support data exploration workflows.
Have your main Shopify KPI cards and trends visible in summarized form near the top of the dashboard for easy digestibility. Allow users to dive deeper.
Call out data observations or anomalies in separate text boxes or visual captions to guide viewer attention to the most impactful or surprising takeaways in your data.
Use line charts, bar/column charts and area charts to showcase time-based trends clearly in your top Shopify metrics. Add reference lines to indicate targets.
Carefully plan the interlinking flow and drill-down map between parent and child dashboards. For example, click on a specific campaign name in your marketing dashboard to navigate to the dedicated campaign results dashboard with metrics, graphs and tables filtered just to its data.
Here are some of the best practices that you can follow to ensure that you get the right analytics out of Power BI at all times.
Configure the Power BI cloud gateway to periodically refresh datasets sourced from Shopify data exports. Weekly or daily refreshes help keep analytics current.
If Shopify modifies the structure of your exported order data, for example with new or renamed columns, quickly update affected Power BI data model mappings.
When you fix issues or add new visuals to existing dashboards, increment the version number and share the update. Avoid confusion from overlapping versions.
If certain dashboard reports become redundant or invalid over time, consider disabling the page to avoid internal data consumers getting misled.
Check which dashboard pages actually get accessed, collect user feedback, and tweak your Shopify analytics content in Power BI accordingly based on what resonates.
![]()
![]()
![]()