This ClickUp Power BI template is designed to help any teams and companies, big or small, use ClickUp for project management and task tracking. If you’re one of them, then you know how important it is to have a clear view of your team’s workload and project progress.
To install this dashboard, you will need to start your free trial for our Clickup Power BI connector. The Power BI template is specifically built for the data format that comes out of our connector so it is not compatible with other connectors.
Our free ClickUp Power BI Dashboard solution that will:
If this could be a step forward for your team, then scroll further to see an example of how our ClickUp Power BI dashboard can make far-reaching changes in the way you manage your team.
We used our custom-built ClickUp Power BI connector to get the data needed to build the dashboards. These pages analyse the team hours, tasks and provide insights into individual employee performance
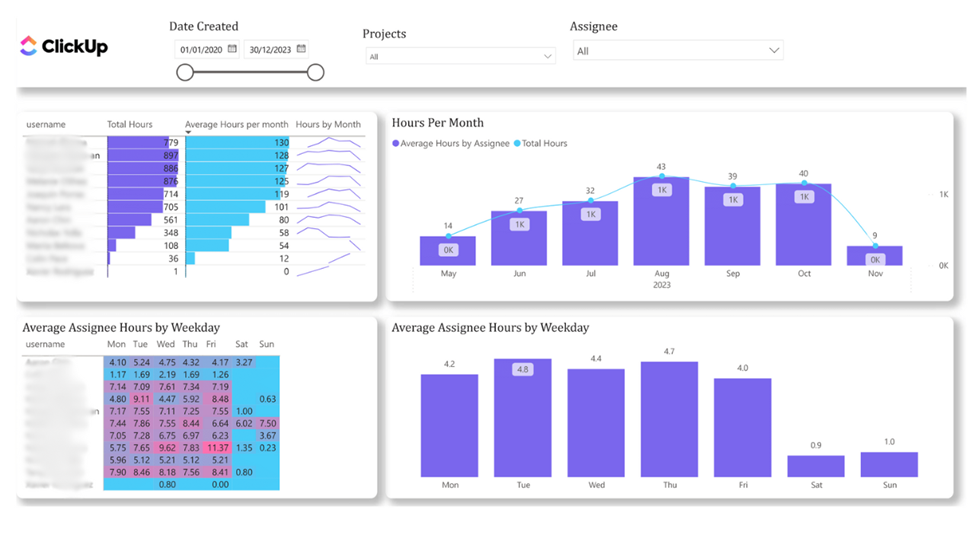
This dashboard lets you measure how well or how much you’re utilizing your human resources based on their work hours.
You can see the total hours and average hours worked by each assignee on a monthly and daily basis across all or any project/ workspace.
This lets you identify team members who are being overworked or underworked at any given time so you can balance the workloads within the team.
For example, if someone was doing a lot of work in the beginning but his or her work hours dropped recently, you can look into why and potentially assign more tasks to the person.
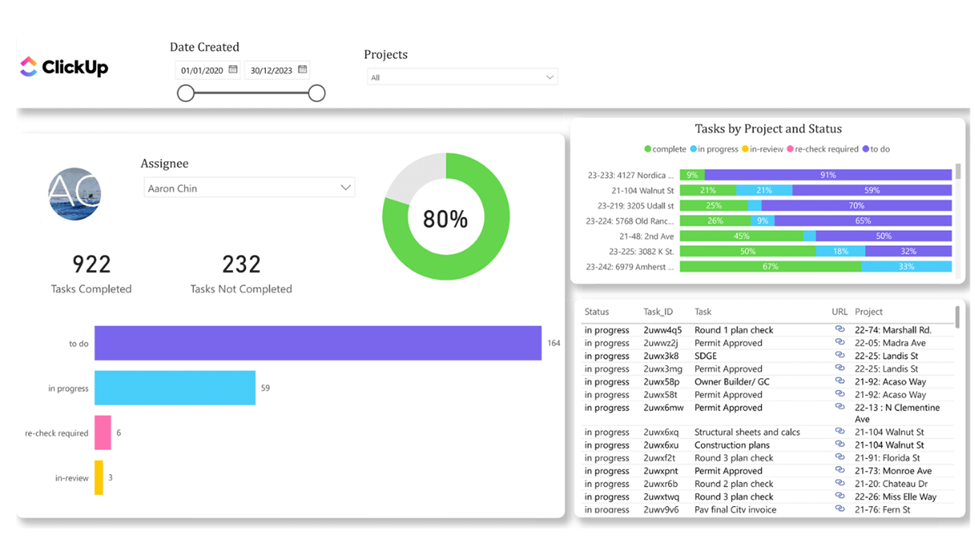
Next up, we have the task tracker dashboard which helps you track the status (completed, in review, in progress, etc) of the different tasks in your workspaces.
This gives you a general idea of the progress of each project i.e. Projects with many completed tasks are likely closer to finishing.
You can also get a better understanding of each assignee’s capacity based on how many completed or ongoing tasks they have.
Finally, the table at the right bottom shows you the details of each task including their URLs which lets you jump straight into ClickUp to take action i.e. to reassign a task to another team member with less workload.
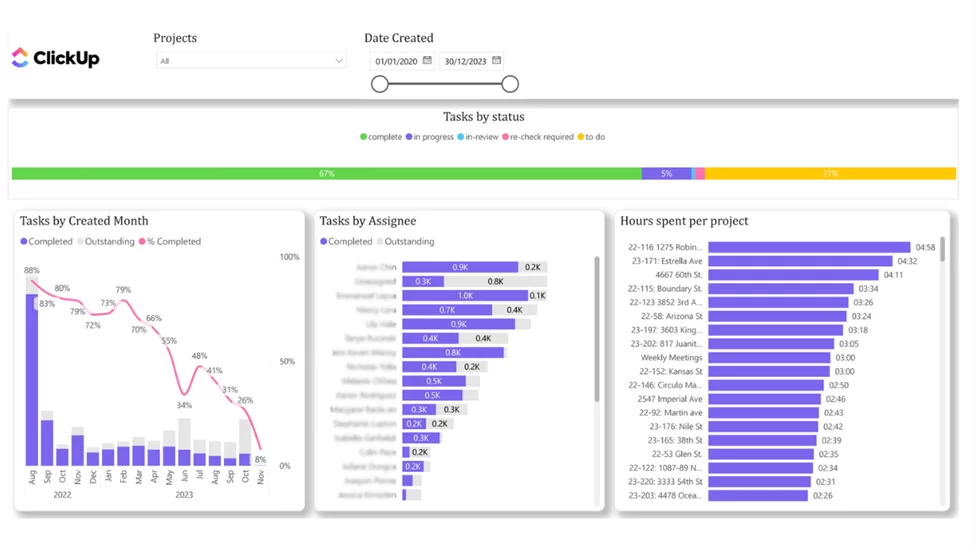
This dashboard is an extension of the task tracker dashboard.
It compares the number of tasks created each month to the number completed. I.e. the trend line that shows the completion percentage helps you assess how effectively tasks are being carried out for each month.
You can also view the breakdown of tasks by assignee to work out individual performance and workload distribution.
And lastly, you can review the total time invested in each project to evaluate resource allocation and project effort.
![]()
![]()
![]()