The client used to use Amplitude to analyse their online conversions. They decided to switch their reporting to Google Data Studio to cut costs while maintaining the same reporting capabilities.
Data Source
Big Query
Analysis Tool
![]() Google Data Studio
Google Data Studio
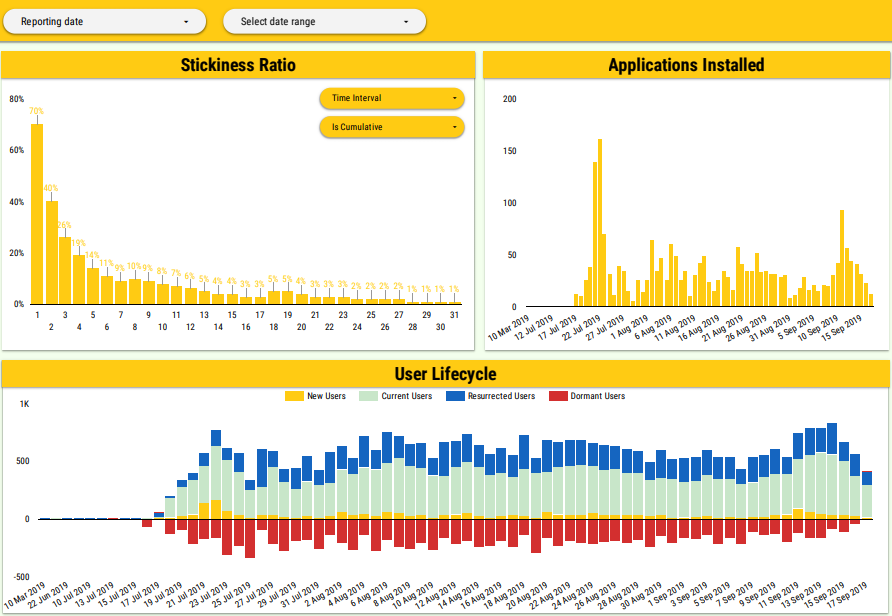
Stickiness ratio shows a proportion of daily active users to monthly active users. This results in a declining numbers on the top-left bar chart. This metric can be filtered by time interval and cumulative/non-cumulative.
There is also a bar chart for applications installed breaking down the number of installations by day.
Finally, there is chart breaking down the user base by new, current, resurrected and dormant.

Support
All the support you need – when you need it. From 1-hour quick fix support to longer-term partnership that drives your business forward.

Consultancy
Advanced data thinking, creative ideas and the best Power Platform practices to unlock the true potential of your business data.

Training
Succeess shouldn’t be a one-off. When we train you teams user adoption surges and your Power Platform results radically improve.
![]()
![]()
![]()