The client is a UK-based consultancy which helps other companies save costs paid as import tax upon import of international goods into the UK. The data source was an Excel file that is usually sent by HMRC. The scope was to analyse import taxes and areas of improvement.
Data Source
Excel
Analysis Tool
![]() Tableau
Tableau
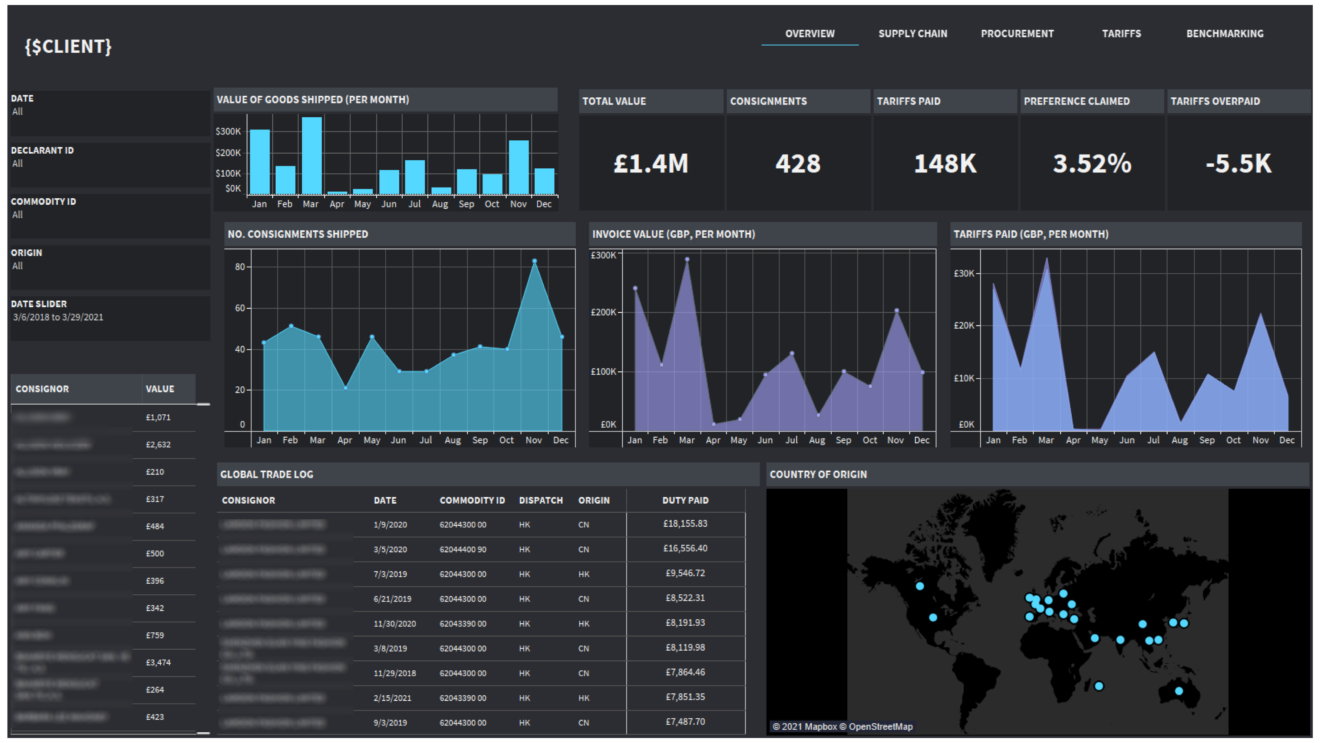
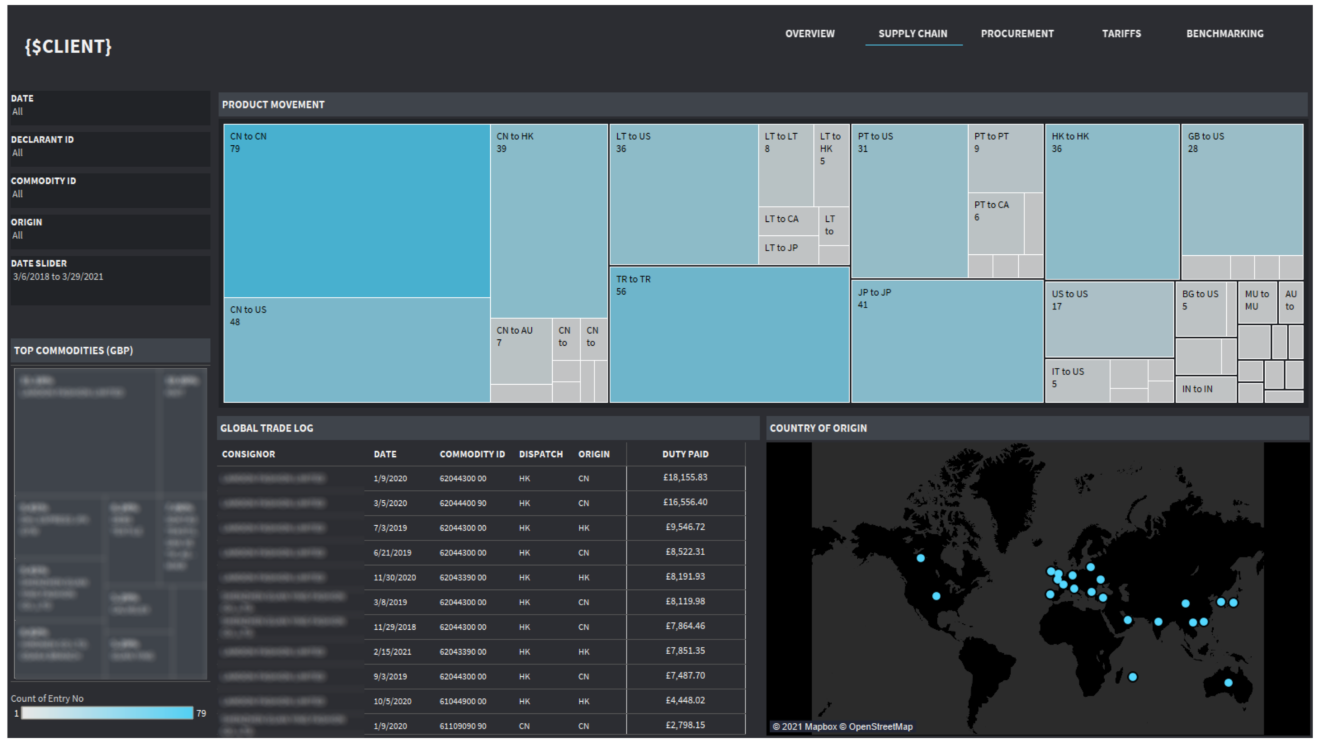
The page shows the value of goods that were shipped, tariffs paid countries that goods were imported from and duties paid for each consignment.
Most importantly the dashboard shows by how much the tariffs are overpaid since this shows the area for improvement to the clients.
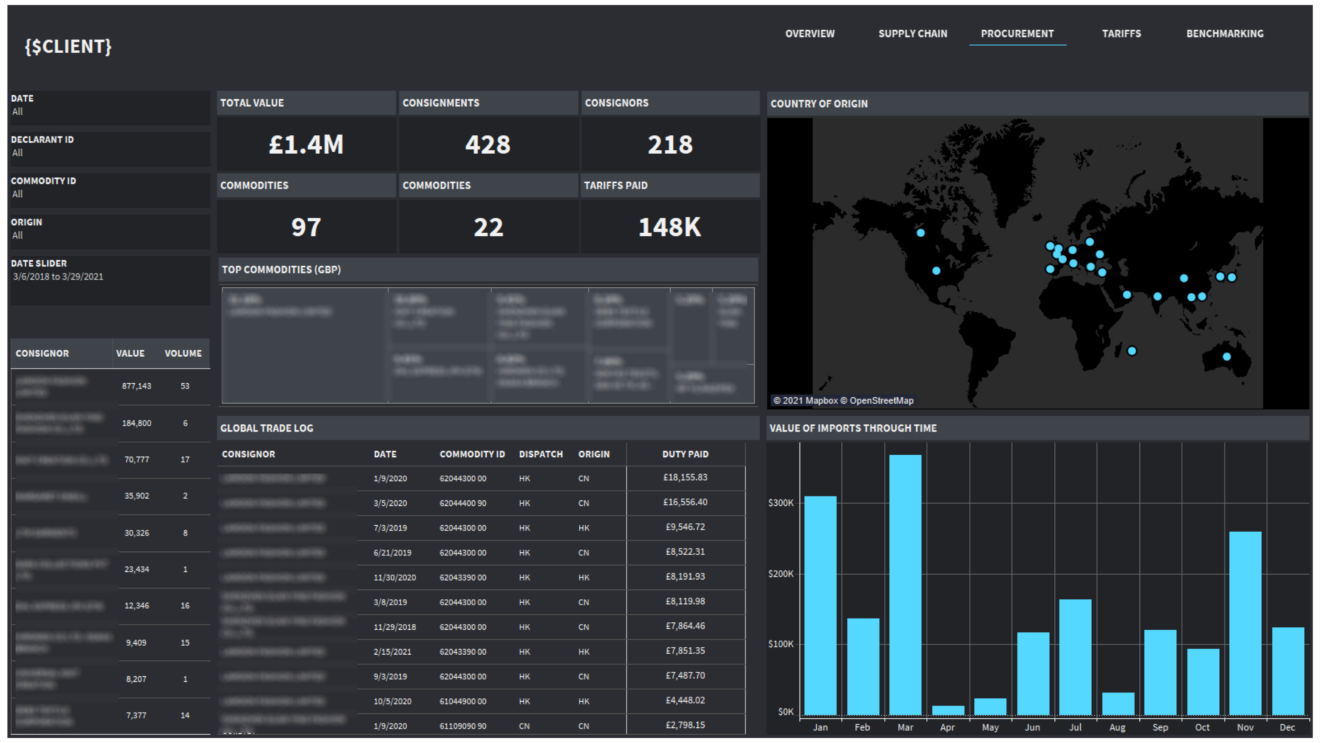
This page analyses the commodities that were imported to the UK by a particular company, where they are imported from and what is their value.
Trend chart shows the value of these imports over time.
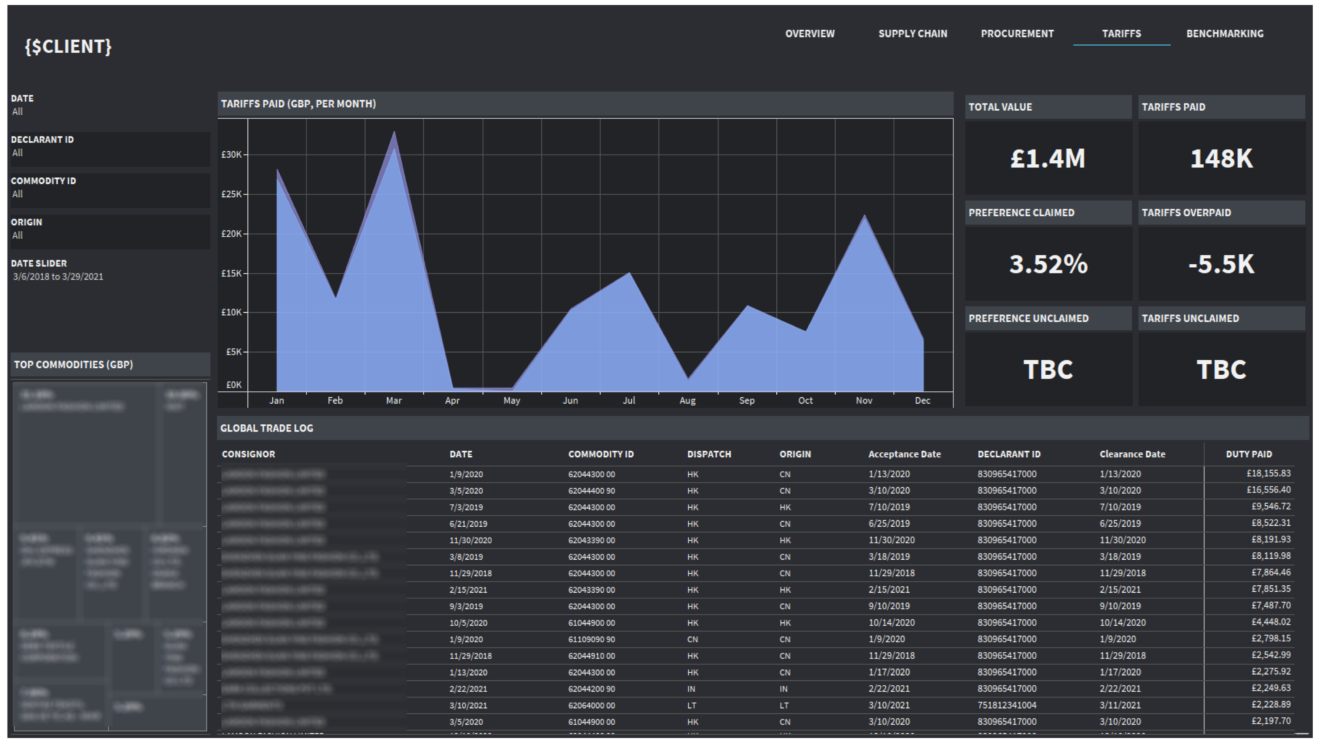
This page focuses on the tariff cost that is paid by a company, what it was paid for and by how much it was overpaid.
Points of entry for goods into the UK are analysed. Whether goods were imported on time or late is also visualised on the dashboard.
Top commodities by import value are also visualised on the dashboard.
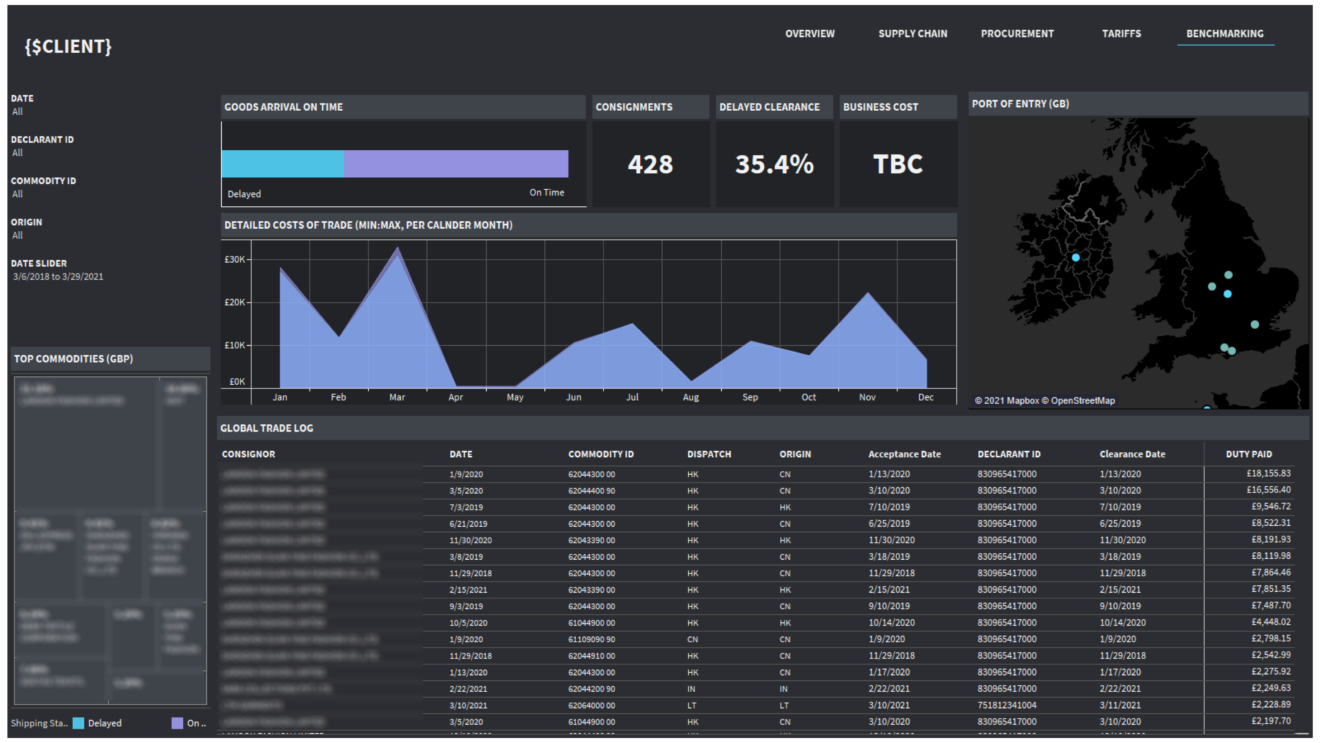
Movement of products from country to country is visualised on the heatmap at the top.
Country of origin for the imported goods is also visualised.
Tariff duty paid by consignor and commodity is presented in a table.

Support
All the support you need – when you need it. From 1-hour quick fix support to longer-term partnership that drives your business forward.

Consultancy
Advanced data thinking, creative ideas and the best Power Platform practices to unlock the true potential of your business data.

Training
Succeess shouldn’t be a one-off. When we train you teams user adoption surges and your Power Platform results radically improve.
![]()
![]()
![]()